

Abstract
Genome-wide association studies have identified more than 70 common variants that are associated with breast cancer risk. Most of these variants map to non-protein-coding regions and several map to gene deserts, regions of several hundred kilobases lacking protein-coding genes. We hypothesized that gene deserts harbor long-range regulatory elements that can physically interact with target genes to influence their expression. To test this, we developed Capture Hi-C (CHi-C), which, by incorporating a sequence capture step into a Hi-C protocol, allows high-resolution analysis of targeted regions of the genome. We used CHi-C to investigate long-range interactions at three breast cancer gene deserts mapping to 2q35, 8q24.21, and 9q31.2. We identified interaction peaks between putative regulatory elements (“bait fragments”) within the captured regions and “targets” that included both protein-coding genes and long noncoding (lnc) RNAs over distances of 6.6 kb to 2.6 Mb. Target protein-coding genes were IGFBP5, KLF4, NSMCE2, and MYC; and target lncRNAs included DIRC3, PVT1, and CCDC26. For one gene desert, we were able to define two SNPs (rs12613955 and rs4442975) that were highly correlated with the published risk variant and that mapped within the bait end of an interaction peak. In vivo ChIP-qPCR data show that one of these, rs4442975, affects the binding of FOXA1 and implicate this SNP as a putative functional variant.
Genome-wide association studies (GWAS) have identified single-nucleotide polymorphisms (SNPs) at more than 70 loci influencing breast cancer risk (Sakoda et al. 2013). Identifying the causal variant(s) underscoring the association signals and their functional basis, however, remains a challenge (Bahcall 2013). Many of the risk SNPs map to non-protein-coding regions and are thought to influence transcriptional regulation (Hindorff et al. 2009; Freedman et al. 2011). In some instances the proximity of the SNP to a plausible candidate gene has provided a potential mechanism (Meyer et al. 2008; Riaz et al. 2012; Bojesen et al. 2013), but several of the breast cancer risk SNPs map to gene deserts with the nearest known gene mapping several hundred kilobases (kb) away.
A systematic approach to the functional characterization of cancer risk loci has recently been proposed (Freedman et al. 2011). This includes fine mapping of potentially large genomic regions (defined as regions that include all SNPs correlated with the published SNP with an r2 of 0.2 or even less), the analysis of SNP genotypes in relation to expression of nearby genes (eQTL), and the use of chromatin association methods (chromosome conformation capture [3C] and chromatin interaction analysis by paired-end tag sequencing [ChIA-PET]) of regulatory regions to determine the identity of target genes. While 3C is a powerful method for assessing whether a region of interest (the bait fragment) can interact with a series of pre-specified target genomic fragments, it suffers from the limitation that only interactions that have been considered a priori will be detected (a “one-by-one” approach) (Dekker et al. 2002, 2013). 4C (“one-by-all”) (Simonis et al. 2006; Zhao et al. 2006) provides genome-wide coverage of interactions but focuses on a single bait fragment; 5C (“many-by-many”) (Dostie et al. 2006) allows high-resolution analysis of interactions between multiple bait fragments and their targets, but both baits and targets must lie within predefined regions. Hi-C (“all-by-all”) (Lieberman-Aiden et al. 2009) provides genome-wide coverage of all possible interactions, but until recently the resolution (∼1 Mb) has prohibited the use of Hi-C for the interrogation of GWAS risk loci.
We and others have hypothesized that the gene deserts identified in breast cancer GWAS harbor long-range tissue-specific regulatory elements that interact with target genes to influence their expression and affect breast cancer risk (Ahmadiyeh et al. 2010). To test this, we have characterized three GWAS risk loci—two gene deserts that have been associated with breast cancer risk (2q35) (Stacey et al. 2007) and 9q31.2 (Fletcher et al. 2011) and one gene desert that has been associated with multiple site-specific cancers (8q24.21) (Ghoussaini et al. 2008; Fletcher and Houlston 2010; Huppi et al. 2012). We have developed Capture Hi-C (CHi-C), a novel Hi-C (van Berkum et al. 2010) protocol that, by incorporating a sequence capture step, allows high-resolution analysis of all interactions for which one end of the di-tag (the bait end) maps to a pre-specified genomic region (the capture region) and the location of the other end (the target end) is unrestricted (“many-by-all”). We have used CHi-C to determine whether 519 bait fragments mapping to these three gene deserts form long-range looping interactions; to identify the targets of these interactions including protein-coding genes, lncRNAs, and miRNAs; and to select SNPs that are potential candidates for having a functional effect on breast cancer risk.
Results
We generated CHi-C libraries from two breast cancer cell lines (BT483 and SUM44) and a control (non-breast cancer) cell line (GM06990). rs13387042 (2q35), rs13281615 (8q24.21), and rs865686 (9q32.1) are all strongly associated with predisposition to estrogen receptor (ER)-positive disease (Broeks et al. 2011; Warren et al. 2012); they are less strongly associated with ER-negative disease and have not been shown to be associated with disease progression (Fasching et al. 2012). We therefore selected BT483 cells (Lasfargues et al. 1978), because, unlike most breast cancer cell lines that are derived from (metastatic) pleural effusions, BT483 cells are derived from a primary invasive ductal carcinoma. BT483 cells are ER-positive and progesterone receptor (PR)-positive, with a modal number of 72 chromosomes. The 8q24.21 locus, however, is amplified in BT483 cells (Supplemental Fig. 1A). For the second breast cancer cell line, we specifically selected a cell line that is copy-number neutral for the 8q24.21 locus; SUM44 cells (Ethier et al. 1993), which are not amplified at 8q24.21 (Supplemental Fig. 1B; Forozan et al. 1999) are ER-positive, PR-negative cells derived from a pleural effusion with a modal number of 60 chromosomes. We also generated CHi-C libraries from the karyotypically normal lymphoblastoid cell line (GM06990) (Supplemental Fig. 1C) that was used to generate the first comprehensive genome-wide map of long-range interactions (Lieberman-Aiden et al. 2009).
We used SureSelect Custom Target Enrichment (Agilent) to capture the genomic regions that included all SNPs correlated with the published GWAS risk SNPs rs13387042 (2q35), rs13281615 (8q24.21), and rs865686 (9q31.2) with r2 ≥ 0.1. As controls we also captured three genomic regions that were randomly selected from gene-poor regions of the genome; these regions were similar in size to the risk loci and had no known association with breast cancer risk (Supplemental Table 1). For each cell line we generated two biological replicates; each CHi-C library was sequenced on one lane of an Illumina HiSeq 2000 generating between 62.2 and 98.9 million di-tags with both ends uniquely mapped to the human reference genome. After excluding invalid pairs (Belton et al. 2012), PCR duplicates, and off-target di-tags (defined as di-tags where neither end mapped to one of the capture regions), the number of analyzable di-tags ranged from 2.3 to 5.9 million (Supplemental Table 2).
For the lymphoblastoid cell line GM06990, we were able to assess the effectiveness of the target enrichment step by comparing our data with publicly available Hi-C data from GM06990 cells (Lieberman-Aiden et al. 2009). In the original (nonenriched) GM06990 Hi-C data, the percentage of di-tags with at least one end mapping to one of our capture regions was 0.26% across four data sets (Lieberman-Aiden et al. 2009); the percentages in our two enriched GM06990 CHi-C libraries were 7.4% and 15.1%, suggesting that we achieved 30- to 60-fold enrichment by incorporating a sequence capture step.
Analysis of interaction peaks between risk loci and cis targets
To test our hypothesis that gene deserts harbor long-range tissue-specific regulatory elements, we first carried out a high-resolution analysis to identify interaction peaks between individual HindIII “bait” fragments that mapped to one of the six capture regions and individual HindIII “target” fragments that mapped within a 5-Mb window on either side of the capture region. Across the six CHi-C libraries, 31.2% to 58.8% of the di-tags that arose from cis interactions represented interactions between captured baits and targets that mapped within 5 Mb of a captured region. We defined an interaction peak as any pair of HindIII fragments for which the number of di-tags was significantly greater than expected under a negative binomial model, taking into account both the distance between the HindIII fragments and the propensity of the bait fragment to form interactions (“interactibility,” see Methods). For statistical significance we used a false discovery rate (FDR) of 0.01. The number of di-tags that constituted a significant interaction peak depended on the distance between the interacting fragments and ranged from seven to 332.
We aligned our interaction peaks with the genomic locations of GENCODE genes (v19; http://www.gencodegenes.org), markers of genome organization (CTCF and RAD21 binding sites) (Phillips-Cremins and Corces 2013), histone modifications that correlate with active enhancers (H3K27ac, H3K4me1), active promoters (H3K4me3) or repressed enhancers (H3K27me3) (Ernst et al. 2011; Gerstein et al. 2012; Natoli and Andrau 2012), and binding sites for the transcription factors estrogen receptor alpha (ESR1) and forkhead box protein A1 (FOXA1) from breast cancer (MCF7) and lymphoblastoid (GM12878) cells; these had been characterized as part of the ENCODE Project by Frietze and colleagues and Hurtado and colleagues (Supplemental Table 3; Hurtado et al. 2011; The ENCODE Project Consortium 2012; Frietze et al. 2012).
In libraries from the BT483 and SUM44 breast cancer cells, there were 20 (BT483) and 45 (SUM44) statistically significant (FDR < 1%) interaction peaks mapping to the 2q35 locus (Supplemental Fig. 2A; Supplemental Table 4). Centromeric to the capture region, the target ends of these interaction peaks were four consecutive HindIII fragments (217,552,337–217,570,353 bp) that colocalized with the coding sequences of insulin-like growth factor binding protein 5 (IGFBP5; 217,536,828–217,560,272 bp; MIM146734) and a region of 10 kb immediately 5′ to IGFBP5 (Fig. 1). IGFBP5 is involved in the systemic and local regulation of insulin-like growth factor 1 (IGF1) and has been shown to promote G2/M cell cycle arrest and apoptosis in breast cancer cell lines (Butt et al. 2003). Telomeric to the capture region, these interaction peaks targeted two distinct regions (218,372,522–218,376,342 bp and 218,552,747–218,619,331 bp) within disrupted in renal carcinoma 3 (DIRC3), a lncRNA that was identified by positional cloning of the breakpoints of a t(2;3)(q35;q21) translocation in a renal cell cancer (Bodmer et al. 2003). Within DIRC3, the target fragments colocalized with CTCF/RAD21 binding sites and regions of active (H3K27ac and H3K4me1) histone modification (Fig. 1). In genomic order, the bait ends of the interaction peaks colocalized to a region of repressive (H3K27me3) histone modification, a CTCF/RAD21 binding site, a region of active (H3K27ac) histone modification, two RAD21 binding sites, and a series of RAD21 binding sites and active histone modification marks that also map within the lncRNA DIRC3 (Fig. 1). Two-way representation of these interaction peaks is shown for BT483 (Fig. 2A, green marks) and SUM44 (Fig. 2B, green marks) as a heatmap; IGFBP5 forms interaction peaks with all of the active bait fragments, whereas the DIRC3 targets form interaction peaks with specific subsets. Comparing the BT483 and SUM44 data, there is one set of fragments mapping to the centromeric end of the capture region which formed multiple interaction peaks with a short (potentially protein-coding) DIRC3 isoform in SUM44 cells, but just a single interaction peak with this region in BT483 cells (Fig. 2A,B). In the libraries from the control lymphoblastoid cell line (GM06990) there were no significant cis interaction peaks mapping to this locus.
Figure 1.
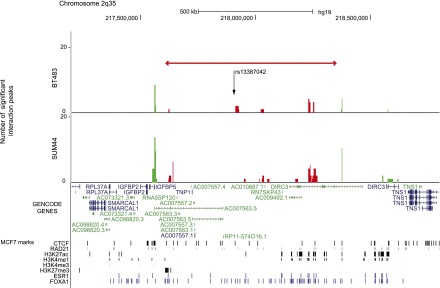
Statistically significant CHi-C interaction peaks at the 2q35 locus. The number of statistically significant interaction peaks mapping to each HindIII fragment (y-axis) is plotted against the genomic location of the HindIII fragment (x-axis) for a 1.6-Mb region (217.2–218.8 Mb) of chromosome 2q35 including the 0.8-Mb genomic region (217,609,776–218,362,744 bp) that was targeted in the sequence capture step of our CHi-C protocol. All coordinates are based on hg19. The capture region is denoted by a double-headed red arrow; the “bait end” of the interaction peaks (i.e., the end that maps to the capture region) is indicated in red, the target end (i.e., the region that maps outside the capture region) is indicated in green. The interaction peaks are aligned with (1) GENCODE genes (v19) with protein-coding transcripts colored blue and noncoding transcripts colored green; and (2) CTCF and RAD21 binding sites, active (H3K27ac, H3K4me1 and H3K4me3) and repressive (H3K27me3) histone modification marks (in black), and ESR1 and FOXA1 binding sites (in blue) generated in the breast cancer cell line MCF7 by the ENCODE Project, Frietze et al. (2012), and Hurtado et al. (2011). The location of the breast cancer risk SNP rs13387042 is also shown.
Figure 2.

Two-way heatmap of interaction peaks at the 2q35 locus. (A) Two-way heatmap of interaction peaks between bait fragments within the 2q35 capture region and target fragments either side of the capture region (green) or between two bait fragments within the capture region (red) for the BT483 libraries. The genomic locations of the bait fragments are shown on the y-axis. The genomic locations of the target fragments, aligned with GENCODE genes, are shown on the x-axis. The color intensity of each square represents the statistical significance of the interaction peak from dark green/red (P = 1 × 10⁻¹⁰) to light green/red (P ≤ 0.01). Interaction peaks with a false discovery corrected P-value of >0.01 are not shown. (B) Two-way heatmap of interaction peaks for the 2q35 locus in the SUM44 libraries.
In the BT483 breast cancer libraries there were just four statistically significant interaction peaks mapping to the 9q31.2 locus (Supplemental Fig. 2B; Supplemental Table 5). For three of these interaction peaks the target end mapped to consecutive HindIII fragments (110,238,956–110,255,868 bp), which colocalized with Krüppel-like factor 4 (KLF4; 110,247,133–110,252,047 bp; MIM602253) and a region of 10 kb immediately 3′ to KLF4; the fourth targeted a region 19 kb telomeric to KLF4 (Fig. 3). KLF4 is a transcription factor which, in common with three other transcription factors (POU5F1, SOX2, and MYC), can induce epigenetic reprogramming of somatic cells to an embryonic pluripotent state (Takahashi and Yamanaka 2006; Wernig et al. 2007). The bait ends of the interaction peaks at the 9q31.2 locus mapped to a single HindIII fragment (fragment 74; 111,033,955–111,035,778 bp), which colocalized with a strong CTCF/RAD21 binding site in MCF7 cells (Fig. 3). In the SUM44 libraries there were no interaction peaks that were significant at an FDR of 1%. At an FDR of 10% there were three significant interaction peaks; all three peaks originated from the same bait fragment (fragment 74; 111,033,955–111,035,778 bp), two targeted KLF4 and one targeted an uncharacterized lncRNA (RP11-363D24.1) that mapped 54 kb centromeric to KLF4 (Supplemental Fig. 3B). In the libraries from the control lymphoblastoid cell line (GM06990) there were no significant cis interactions mapping to this locus.
Figure 3.
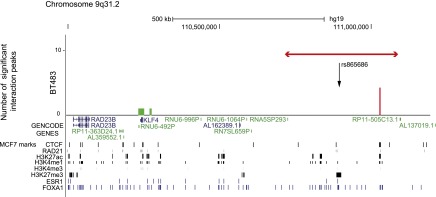
Statistically significant CHi-C interaction peaks at the 9q31.2 locus. The number of statistically significant interaction peaks mapping to each HindIII fragment (y-axis) is plotted against the genomic location of the HindIII fragment (x-axis) for a 1.2-Mb region (110.2–111.0 Mb) of chromosome 9q31.2, including the 0.3-Mb genomic region (110,759,922–111,097,304 bp) that was targeted in the sequence capture step of our CHi-C protocol. All coordinates are based on hg19. The capture region is denoted by a double-headed red arrow; the “bait end” of the interaction peaks is indicated in red; the target end is indicated in green. The significant interaction peaks are aligned with (1) GENCODE genes (v19) with protein-coding transcripts colored blue and noncoding transcripts colored green; and (2) CTCF and RAD21 binding sites, active (H3K27ac, H3K4me1, and H3K4me3) and repressive (H3K27me3) histone modification marks (in black), and ESR1 and FOXA1 binding sites (in blue) generated in the breast cancer cell line MCF7 by the ENCODE Project, Frietze et al. (2012), and Hurtado et al. (2011).
In the BT483 libraries there were three statistically significant interaction peaks at the 8q24 locus (Supplemental Fig. 2C; Supplemental Table 6). The targets of these interaction peaks were consecutive HindIII fragments (128,740,188–128,756,979 bp) that mapped to, or immediately adjacent to, the oncogene MYC (128,748,315–128,753,680 bp; MIM190080) and one fragment that mapped to the lncRNA CCDC26 (130,363,938–130,692,485 bp). CCDC26, which is located >2.5 Mb from the 8q24.21 capture region (Fig. 4A) has previously been associated with non-glioblastoma multiforme glioma (Shete et al. 2009; Enciso-Mora et al. 2013). The bait ends of these interaction peaks were two consecutive HindIII fragments (fragments 1 and 2; 127,886,760–127,891,696 bp) which colocalized with a strong CTCF/RAD21 binding site in MCF7 cells (Fig. 4A). In the SUM44 libraries there were no interaction peaks that were significant at an FDR of 1%. At an FDR of 10% there were three significant interaction peaks originating from the same two bait fragments (fragments 1 and 2; 127,886,760–127,891,696 bp) and targeting the same lncRNA (CCDC26) as in the BT483 data.
Figure 4.
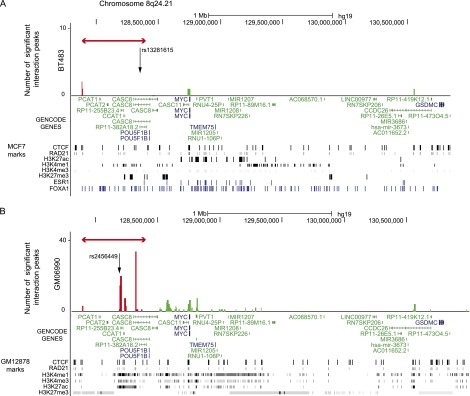
Statistically significant CHi-C interaction peaks at the 8q24.21 locus. (A) The number of statistically significant interaction peaks mapping to each HindIII fragment (y-axis) is plotted against the genomic location of the HindIII fragment (x-axis) for a 3.2-Mb region (127.8–131.0 Mb) of chromosome 8q24.21, including the 0.6-Mb genomic region (127,888,336–128,469,498 bp) that was targeted in the sequence capture step of our CHi-C protocol. All coordinates are based on hg19. The capture region is denoted by a double-headed red arrow; the “bait end” of the interaction peaks is indicated in red; the target end is indicated in green. The significant interaction peaks are aligned with (1) GENCODE genes (v19) with protein-coding transcripts colored blue and noncoding transcripts colored green; and (2) CTCF and RAD21 binding sites, active (H3K27ac, H3K4me1, and H3K4me3) and repressive (H3K27me3) histone modification marks (in black), and ESR1 and FOXA1 binding sites (in blue) generated in the breast cancer cell line MCF7 by the ENCODE Project, Frietze et al. (2012), and Hurtado et al. (2011). The location of the breast cancer risk SNP rs13281615 is also shown. (B) As above, but based on statistically significant interaction peaks in the lymphoblastoid cell line GM06990 and aligned with ENCODE data from the lymphoblastoid cell line GM12878.
The 8q24 locus harbors multiple independent loci with different tumor specificities including both breast (Easton et al. 2007) and chronic lymphocytic leukemia (CLL) (Crowther-Swanepoel et al. 2010). In GM06990 libraries, in contrast to the breast cancer-specific loci (2q35 and 9q31.2) where we found no significant interaction peaks, there were 108 statistically significant interaction peaks mapping to the 8q24 locus (Supplemental Fig. 2C). Centromeric to the capture region there was a single interaction peak involving non-SMC element 2 (NSMCE2; 126,351,704–126,355,582 bp; Supplemental Table 6), a gene that has been associated with MYC locus rearrangements in multiple myeloma (Affer et al. 2014). Telomeric to the capture region, in genomic order, targets were two RAD21 binding sites with active histone modification marks, one of which maps 11 kb 5′ to the lncRNA CASC8 (128,505,501–128,522,323 bp and 128,557,941–128,604,123 bp), MYC, the lncRNA PVT1 (128,808,208–128,808,274 bp), and sequences within the same lncRNA that was targeted in the BT483 libraries (CCDC26; 130,363,938–130,692,485 bp) (Fig. 4B; Supplemental Table 6). Four of the 108 interaction peaks originated from the same CTCF/RAD21 binding sites (fragments 1 and 2; 127,886,760–127,891,696 bp) that formed interactions in the BT483 libraries; in GM12878 cells (but not MCF7 cells) these bait fragments were associated with active histone modification marks (H3K27ac, H3K4me1, and H3K4me3) (Fig. 4B). The bait fragments for the other 104 interactions all mapped to a region of H3K27ac, H3K4me1, and H3K4me3 histone modification spanning ∼150 kb (128,175,000–128,330,000 bp), which included the lncRNA CCAT1 and multiple CTCF/RAD21 binding sites. In contrast, in MCF7 cells this same region was associated with repressive (H3K27me3) marks (Fig. 4A). The two-way representation of these interaction peaks is shown as a heatmap (Fig. 5, green marks); each of the 8q24 bait fragments forms interaction peaks with multiple targets including the distal lncRNA CCDC26.
Figure 5.
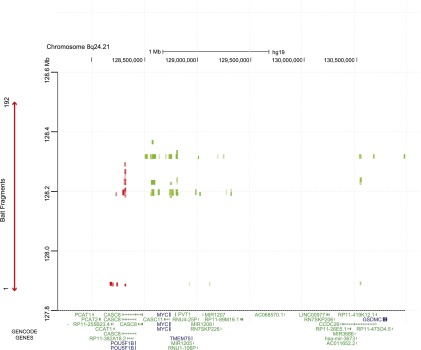
Two-way heatmap of interaction peaks at the 8q24.21 locus. Two-way heatmap of interaction peaks between bait fragments within the 8q24.21 capture region and target fragments either side of the capture region (green) or between two bait fragments within the capture region (red) for the GM06990 libraries. The genomic locations of the bait fragments are shown on the y-axis. The genomic locations of the target fragments, aligned with GENCODE genes, are shown on the x-axis. The color intensity of each square represents the statistical significance of the interaction from dark green/red (P = 1 × 10⁻¹⁰) to light green/red (P ≤ 0.01). Interactions with a false discovery corrected P-value of >0.01 are not shown.
Among the control (random regions) there were no significant interaction peaks originating from any of the loci in any of the libraries.
Validation by q3C
To assess the reliability of this method and to determine whether the interactions we observed in our CHi-C data in BT483 and SUM44 cells were also common to the breast cancer cell line characterized by the ENCODE Project (MCF7 cells), we performed quantitative 3C experiments for a subset of interaction peaks at each of the risk loci. We confirmed interaction peaks with IGFBP5 (2q35; Supplemental Fig. 3A) and KLF4 and the uncharacterized lncRNA RP11-363D24.1 (9q31.2; Supplemental Fig. 3B) in SUM44 cells, and we showed that these interaction peaks were absent from the lymphoblastoid (GM06990) cells. In GM06990 cells we were able to confirm interaction peaks with both MYC and the lncRNA CCDC26. In MCF7 cells we demonstrated a weak interaction peak with IGFBP5 (2q35) and strong interaction peaks with KLF4, RP11-363D24.1 (9q31.2), MYC, and CCDC26 (8q24.21, Supplemental Fig. 3C).
Analysis of interaction peaks between HindIII fragments where both di-tag ends map to the capture regions
Consistent with data from the ENCODE Project Consortium (2012), we found that the majority of bait fragments that generated interaction peaks with long-range targets generated interaction peaks with multiple targets. For instance, in GM06990 cells a single HindIII fragment (fragment 152; 128,314,311–128,319,325 bp, Supplemental Table 6) formed interaction peaks with at least five different targets: two distinct regions that were associated with active histone marks (128,505,501–128,522,323 bp and 128,557,941–128,604,123 bp), MYC, PVT1, and CCDC26. To understand the extent to which individual bait fragments could form interaction peaks with multiple targets, we next tested for significant interaction peaks occurring between two bait fragments within a single capture region. On the basis that the statistical properties of interaction peaks where both ends of the di-tag have been captured will differ from those where just one end has been captured, we carried out separate analyses of these “within capture” interaction peaks.
As with the cis analyses (above), the loci that showed high activity were 2q35 (in BT483 and SUM44, Supplemental Table 7) and 8q24 (in GM06990, Supplemental Table 8). In addition, the bait fragments that predominated in forming interaction peaks were common to both analyses, suggesting that a small subset of bait fragments is highly interactive. In BT483 libraries, for example, fragment 187 (218,230,849–218,232,200 bp; Supplemental Tables 4, 7) formed interaction peaks with IGFBP5, DIRC3, and several distinct sections of the captured region (e.g., fragments 195–200 [218,250,629–218,261,778 bp] and 224 [218,353,009–218,355,732 bp]) (Fig. 2A, red marks). For the SUM44 libraries the pattern was similar, with this same fragment forming interaction peaks with IGFBP5, DIRC3, and a subset of the sections within the capture region (Fig. 2B). Overall, there was more activity within the capture region in the BT483 libraries compared with the SUM44 libraries and, although we did not detect any interactions between bait fragments within the 2q35 capture region and IGFBP5 or DIRC3 in GM06990 cells, we did detect two interaction peaks occurring between fragments within the 2q35 capture region in these libraries (Supplemental Fig. 4). Similarly for the 8q24.21, the same subset of fragments predominated in both analyses (Fig. 5, red marks).
Analysis of interaction peaks between risk loci and long range (>5 Mb) cis and trans targets
Finally, to determine whether we could detect interaction peaks between bait fragments and target fragments over a longer range (>5 Mb) in cis or in trans, we carried out a lower resolution analysis in which we collapsed the di-tags into 50-kb bins and tested for interactions between each bin within a capture region and all other bins on (1) the same chromosome and >5 Mb from the capture region or (2) all other chromosomes. Using in-house comparative genomic hybridization (CGH) BAC arrays (Natrajan et al. 2009), we have previously characterized genomic regions of low-level gain (approximately three to four copies) and amplification (more than four copies) in the karyotypically abnormal BT483 and SUM44 cells and the karyotypically normal GM06990 cells (unpublished data). There were multiple regions of amplification or gain in both BT483 and SUM44 cells but not in GM06990 cells (Supplemental Table 9). We were able to identify many of these regions in our CHi-C data as regions that were associated with multiple interaction peaks spanning large genomic regions and, typically, with interaction peaks involving multiple capture regions. There was, however, one trans interaction peak, which despite mapping to a large (21.5 Mb) region of amplification in BT483 cells and a large (51.9 Mb) region of gain in SUM44 cells, appeared to be remarkably site-specific. This interaction peak was between a single bin within the 2q35 capture region (217,650,001–217,700,000 bp) and a single bin at chromosome 1q42.12 (225,750,001–225,800,000 bp), which colocalized with the enabled homolog (Drosophila) gene (ENAH, MIM609061; Supplemental Table 10) and occurred in both BT483 and SUM44 cell lines. ENAH is an actin regulatory protein with multiple isoforms that is undetectable in normal breast tissue but is progressively expressed in premalignant breast lesions (Di Modugno et al. 2007, 2012). After excluding regions of amplification or gain, there were no significant interaction peaks occurring in cis over distances of >5 Mb; there were interaction peaks with 11, 20, and 0 target regions in trans in BT483, SUM44, and GM06990 cells, respectively (Supplemental Table 10). However, in contrast to our high-resolution cis analysis where we observed strong locus specificity (there were no significant interaction peaks originating from the random regions), there was no evidence that the trans interaction peaks we observed were specific to the risk loci. While in SUM44 cells the majority of trans interaction peaks involved the 2q35 risk locus, there were five interaction peaks involving the random (control) 18q12.3 locus, and in BT483 cells the majority of the trans interaction peaks were with the 16q22.3–23.1 locus.
Correlating interaction peaks with gene expression
Our analyses implicate protein-coding genes (IGFBP5 [2q35], KLF4 [9q31.2], MYC and NSMCE2 [8q24.21]) and lncRNAs (DIRC3 [2q35], RP11-363D24.1 [9q31.2] and CCDC26 and PVT1 [8q24.21]) as targets of the 2q35, 9q31.2, and 8q24.21 risk loci. For the protein-coding genes IGFBP5, KLF4, and MYC, there was some evidence that the tissue specificity of the interaction peaks was consistent with the tissue specificity of gene expression. IGFBP5 and KLF4 were expressed in breast cancer cell lines (BT483, SUM44, and MCF7) but not the lymphoblastoid cell line (GM06990), whereas MYC was expressed in both cell types (Supplemental Fig. 5A–C). The exception was NSMCE2, which formed a single interaction peak with an 8q24.21 bait fragment in GM06990 cells (but not in BT483 or SUM44 cells) but was expressed in both breast cancer and lymphoblastoid cells (Supplemental Fig. 5D). For the lncRNAs there was no evidence that expression was correlated with the presence or absence of interaction peaks. DIRC3 and PVT1, which formed strong tissue-specific interaction peaks in breast cancer and lymphoblastoid cells, respectively, were both expressed in both cell types (Supplemental Fig. 5E,F). In contrast, we were unable to detect expression of RP11-363D24.1 or CCDC26 in any of the cell lines that we characterized. To determine whether the tag SNPs rs13387042 (2q35), rs13281615 (8q24.21), and rs865686 (9q32.1) were associated with levels of expression of these targets, we carried out expression quantitative trait locus (eQTL) analysis using RNA-seq data on 437 ER-positive breast tumors from the Cancer Genome Atlas (http://cancergenome.nih.gov/) (The Cancer Genome Atlas Network 2012). There was some evidence that rs6721196 (a proxy for rs13387042, r2 = 0.97, D′ = 1.0) was associated with expression of both DIRC3 and IGFBP5 (P = 0.03 and P = 0.04, respectively, FDR < 0.1; Supplemental Table 11). We found no evidence for an association between rs471467 (a proxy for rs865686; r2 = 1.0, D′ = 1.0) and KLF4 (P = 0.81), or rs418269 (a proxy for rs1328615; r2 = 0.97, D′ = 1.0) and MYC (P = 0.82). RP11-363D24.1 and CCDC26 were not expressed at detectable levels in these data.
Prioritizing regions for functional studies
Chromatin association methods have been used to propose the identity of target genes (Freedman et al. 2011), while the selection of putative causal variants for detailed functional characterization has relied on fine mapping and colocalization of genetic variants with markers of active chromatin and/or binding sites for specific transcription factors. In particular, Cowper-Sal lari et al. (2012) demonstrated that breast cancer risk SNPs and their associated variant sets (AVS) preferentially localized to regions of H3K4me1 modification, FOXA1, and ESR1 binding. We hypothesized that if our CHi-C interaction peaks represent protein–protein-mediated looping interactions between active regulatory elements, a functional variant that can directly influence gene expression has a high probability of mapping within the bait fragment of a CHi-C interaction peak. To explore this we mapped the location of each SNP that was correlated with the published risk SNP (r2 ≥ 0.1) to a HindIII fragment within the capture region, and we looked for evidence that clusters of correlated SNPs colocalized to a particular CHi-C interaction peak.
For the 9q31.2 and 8q24.21 breast cancer risk loci, there was no evidence that correlated SNPs were clustered within the interaction peaks. There were just two (9q31.2; Supplemental Table 12) and four (8q24.21; Supplemental Table 13) SNPs that were correlated with rs865686 and rs13281615, respectively, and that mapped to interacting HindIII fragments; none of these was strongly correlated with the published SNPs (all r2 ≤ 0.22). In contrast, for the 2q35 capture region there were 33 SNPs that were correlated with rs13387042 (r2 ≥ 0.1; Supplemental Table 14) and that colocalized with a CHi-C interaction peak. A total of 18 (54.5%) of these SNPs, including two SNPs (rs12613955 and rs4442975) that were highly correlated with rs13387042 (r2 > 0.8) clustered within a single HindIII fragment (fragment 82; 217,912,886–217,925,467 bp) that lies 7 kb telomeric to the risk SNP rs13387042. Based on in vivo data generated by the ENCODE Project in MCF7 cells, there is a CTCF/RAD21 binding site within this region of the 2q35 risk locus, but there is no evidence of active histone modification marks (Fig. 6A). However, levels of expression of IGFBP5 were low in MCF7 cells (Supplemental Fig. 5) and pyrosequencing of four CpG sites within the IGFBP5 promoter showed these sites were hypermethylated in MCF7 cells (Supplemental Fig. 6), suggesting that this locus may be epigenetically silenced in MCF7 cells. If so, markers of active chromatin in MCF7 cells may not accurately reflect regions of regulatory activity at this locus. In silico algorithms (Boyle et al. 2012; Ward and Kellis 2012; Mathelier et al. 2014) predict that both SNPs alter consensus binding sites for potentially relevant transcription factors; rs12613955 alters the seventh position of a consensus binding site for HOXB13 (Berger et al. 2008; Huang et al. 2014), with the alternate (T) allele favoring binding (Fig. 6B), while rs4442975 alters the ninth position of a sequence that has one mismatch with a consensus binding site for FOXA1 with the reference (T) allele being favored over the alternate (G) allele (Fig. 6C).
Figure 6.
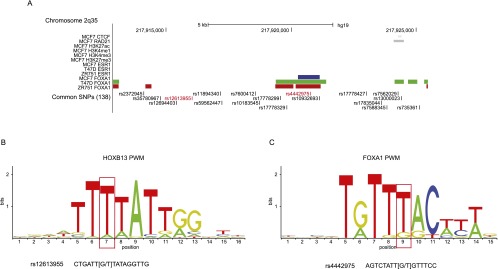
Functional annotation of bait fragment 82 at the 2q35 capture region. (A) The locations of all SNPs that are correlated (r2 ≥ 0.1) with the published risk SNP (rs13387042) are shown, with the two SNPs that are strongly correlated (r2 ≥ 0.8) in red. SNPs are aligned with CTCF and RAD21 binding sites, active (H3K27ac, H3K4me1, and H3K4me3) and repressive (H3K27me3) histone modification marks (in black) generated in the breast cancer cell line MCF7 by the ENCODE Project and by Frietze et al. (2012), and ESR1 and FOXA1 binding peaks generated in MCF7 (blue), T-47D (green), and ZR75-1 cells (red) by Hurtado et al. (2011). All three breast cancer cell lines are homozygous for the G-allele of rs4442975. (B) Position weighted matrix (PWM) for HOXB13 binding site. The base position that is altered by rs12613955 is indicated by a red box and the sequence of rs12613955 is shown below. Based on ChIP-seq data in (human) prostate cancer cells (Huang et al. 2014), the consensus sequence is conserved between mouse and man. (C) PWM for FOXA1 binding site with the base position that is altered by rs4442975 indicated by a red box and the sequence of rs4442975 shown below.
For FOXA1 we first examined ChIP-seq data for the three ER-positive breast cancer cell lines (MCF7, ZR75-1, and T-47D) characterized by Hurtado et al. (2011). We found a FOXA1 binding peak colocalizing with rs4442975 in all three cell lines (Fig. 6A). Using ChIP-qPCR we were able to replicate these data in MCF7 cells and show that FOXA1 also binds to rs4442975 in SUM44 cells (Fig. 7A). All four of these cell lines (MCF7, ZR75-1, T-47D, and SUM44) carry two copies of the low-affinity (G) allele of rs4442975. To determine whether FOXA1 binds preferentially to the T allele of rs4442975, we used a cell line that is heterozygous for rs4442975 (and a linked SNP rs6723013) (Cowper-Sal lari et al. 2012). ChIP-qPCR in BT474 cells demonstrated strong binding of FOXA1 (15-fold enrichment over input compared with twofold in MCF7 and SUM44 cells), and sequencing analysis of the rs4442975-containing region showed that the T allele was enriched in chromatin fragments immunoprecipitated with antibody to FOXA1 compared with input genomic DNA (Fig. 7B).
Figure 7.
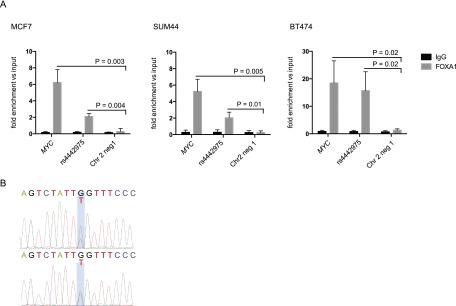
ChIP qPCR analysis of FOXA1 binding to rs4442975 region. (A) FOXA1 ChIP-qPCR for MYC (positive control), rs4442975 (test region), and a control region (Chr2: 217,922,940–217,923,055 bp) mapping 2.1 kb telomeric to rs4442975 that showed no evidence of FOXA1 binding in data from Hurtado and colleagues. Mean ±SD for three technical replicates. (B) Sanger sequencing of the rs4442975 region in FOXA1 immunoprecipitated chromatin (top) and input genomic DNA (bottom).
To our knowledge, there are no HOXB13 ChIP-seq data available for breast cancer cell lines. To determine whether HOXB13 bound to rs12613955 in vivo we therefore carried out ChIP-qPCR, first to replicate data from Huang et al. (2014) in VCaP prostate cancer cells as a positive control, and then to interrogate rs12613955 in breast cancer cells. We were able to demonstrate sequence-specific binding of HOXB13 to a SNP within intron 4 of RFX6 (rs339331) in VCaP prostate cancer cells, but found no evidence of HOXB13 binding to rs12613955 in SUM44 breast cancer cells (Supplemental Fig. 7).
Discussion
While Hi-C (Lieberman-Aiden et al. 2009) provides unbiased genome-wide coverage of all possible short- and long-range interactions, until recently the resolution (∼1 Mb) has prohibited the use of this method for the interrogation of GWAS risk loci. The resolution of Hi-C is dependent on the number of di-tags that map within a region of interest (Lieberman-Aiden et al. 2009; Hughes et al. 2014). We have demonstrated that by incorporating a sequence capture step into a Hi-C protocol (van Berkum et al. 2010) we can generate high-resolution maps of interaction peaks originating from specific regions of the genome. We selected six genomic regions that ranged from 350 to 750 kb comprising 3.3 Mb of captured sequences in total. However, with appropriate arrays, this method could be used to interrogate all of the published breast cancer risk loci in a single analysis and could potentially be extended to fresh frozen tumor samples. We defined our regions to include all SNPs with minor allele frequencies (MAFs) of 5% or greater and which were correlated (r2 > 0.1) with the published SNP. We excluded rare SNPs and used r2 (rather than D′) as the metric for linkage disequilibrium, since GWAS are predicated on the assumption that the arrayed SNPs have a reasonably high correlation with common causal variants, and while rare causal variants are also possible, they are less likely (Anderson et al. 2011; Wray et al. 2011; Dudbridge et al. 2012). The least efficient step within our protocol was the target enrichment step where the efficiency varied from 7.4% to 15.1%. This relatively low efficiency may, in part, reflect our choice of genomic regions; gene deserts have been shown to have a lower than average GC content and a higher than average content of repetitive sequences (Ovcharenko et al. 2005) which, despite repeat masking of our arrays, may have led to the capture of a relatively high proportion of off-target di-tags. Despite this, our incorporation of a sequence capture step resulted in a 30- to 60-fold increase in on-target di-tags compared with conventional Hi-C, allowing us to map interaction peaks at the resolution of a single HindIII fragment within windows of ∼10 Mb and genome-wide at a resolution of 50 kb.
For the characterization of gene deserts identified in breast cancer GWAS, where neither the location of the causal variant (and hence the “bait” fragment) nor the target(s) are known, this method has several advantages over the other published “C” methods (Dekker et al. 2013). 4C (“one-by-all”) provides genome-wide coverage of interactions but focused on a single bait fragment. 5C (“many-by-many”) allows high-resolution analysis of interactions between multiple bait fragments and their targets, but pragmatic considerations such as the need to generate one unique probe for each potential bait and target fragment restricts the number and hence the location of baits and targets to defined regions. In addition, 5C can only detect interactions at one end of any given restriction fragment and assumes that the orientation of ligations is random (Sanyal et al. 2012). Hi-C (“all-by-all”) provides genome-wide coverage of all possible interactions, but until recently the resolution (∼1 Mb) has prohibited the use of Hi-C for the interrogation of GWAS risk loci. A high resolution (5–10 kb) Hi-C map of interactions in primary human fibroblast cells has been published recently (Jin et al. 2013). This degree of resolution, however, comes at a high cost; Jin and colleagues sequenced and combined data from Hi-C libraries generated from six biological replicates each of unstimulated and TNF-alpha stimulated fibroblasts totaling 5.3 billion di-tags for their high-resolution Hi-C maps. Sequencing for our protocol was an order of magnitude lower and was achievable on one lane of an Illumina HiSeq 2000 per library. A genome-wide Capture 3C methodology has also been published recently (Hughes et al. 2014). Hughes and colleagues generated exquisitely high-resolution data for interactions between 457 captured gene promoters and their targets. Hi-C libraries, however, have an advantage over 3C libraries in that there is enrichment for bona fide (biotinylated) interaction products before the library is subjected to sequence capture, reducing the number of “invalid” (Belton et al. 2012) interaction products that will be sequenced. Specifically, the proportion of di-tags in our CHi-C libraries that represented unique valid interaction products ranged from 18.2% to 62.4% (Supplemental Table 2).
Our eQTL analysis of RNA-seq data from TCGA is consistent with an eQTL analysis of 15 breast cancer risk loci based on Agilent array data from TCGA (Li et al. 2013). Li and colleagues demonstrated an association between rs6721996 (a proxy for rs13387042 [2q35], r2 = 0.97, D′ = 1.0) and levels of expression of IGFBP5. Neither our RNA-seq analysis nor Li and colleagues’ array-based analysis found any direct association between rs418269 (correlated with rs13281615 [8q24.21], r2 = 0.97, D′ = 1.0) and MYC or rs471467 (correlated with rs865686 [9q31.2], r2 = 1.0, D′ = 1.0) and KLF4, but Li and colleagues were able to identify a set of eQTL-associated genes for both of these loci and demonstrate that their ENCODE-defined enhancer elements were enriched for MYC and KLF4 consensus binding sites. Consistent with these data, we demonstrated statistically significant interaction peaks between bait fragments at the 2q35, 8q24.21, and 9q31.2 risk loci and IGFBP5, MYC, and KLF4, respectively. To our knowledge, our reporting of an interaction peak between the 8q24.21 locus and NSMCE2 in lymphoblastoid cells is novel and consistent with a role for this locus in multiple myeloma (Affer et al. 2014).
In addition to interaction peaks with protein-coding genes, we were able to demonstrate strong interaction peaks with lncRNAs, and while DIRC3 probes are not included on the arrays analyzed by Li et al. (2013), we were able to show that rs6721996 is also associated with levels of expression of DIRC3. lncRNAs have been shown to be involved in a wide range of biological processes including dosage compensation, genomic imprinting, chromatin regulation, alternative splicing of pre-mRNA, and nuclear organization (Niland et al. 2012). Dysregulation of lncRNAs has been reported in several cancers and two of the most well-characterized lncRNAs, HOTAIR and ANRIL, have both been shown to repress the expression of tumor-suppressor genes by altering chromatin structure either locally or over long distances (Gupta et al. 2010; Yap et al. 2010). Several of the lncRNAs that formed interaction peaks with sequences within the risk loci have previously been associated with other site-specific cancers; DIRC3 (2q35) was identified as one end of the translocation breakpoint in a renal cell cancer (Bodmer et al. 2003), and a SNP (rs55705857) that maps to a highly evolutionarily conserved sequence within CCDC26 (8q24.21) has been associated with non-glioblastoma multiforme glioma (Shete et al. 2009; Enciso-Mora et al. 2013). There is a diverse body of evidence linking PVT1 and the associated MIR1204, which are targets of the 8q24 locus in lymphoblastoid cells, with multiple site-specific cancers and end-stage renal disease (Huppi et al. 2012), and several of these studies support PVT1 and miR-1204 functioning independently of MYC. However, it remains to be seen whether expression of the lncRNAs we identified as targets of the 2q35, 9q31.2, and 8q24.21 breast cancer risk loci affect breast cancer risk directly, or via an effect on the protein coding genes with which they colocalize.
In our analysis of cis interactions, we observed 65, four, and 111 statistically significant interaction peaks at the 2q35, 9q31.2, and 8q24.21 risk loci, respectively. The majority of these interaction peaks demonstrated tissue specificity such that at the 2q35 and 9q31.2 breast cancer risk loci the interaction peaks were specific to breast cancer cell lines, while at the 8q24.21 multiple-cancer risk locus there were significant interaction peaks in multiple (breast and lymphoblastoid) cell lines. The majority of 8q24.21 interaction peaks were unique to GM06990 cells, but there was a single target fragment mapping to CCDC26 (130,558,006–130,562,996 bp), >2.5 Mb from the capture region that formed interaction peaks with two consecutive bait fragments (1; 127,886,760–127,889,453 bp and 2; 127,889,454–127,891,696 bp) in BT483 and GM06990 cells, respectively, suggesting that at least some long-range looping interactions are common to both cell types.
The fact that we observed a single trans interaction that was common to both breast cancer cell lines is intriguing. Mapping within the 2q35 capture region 50-kb bin, there is both a lncRNA (AC007563.5) and a ribosomal RNA (RNA5SP120), and the target bin (225,750,001–225,800,000 bp) colocalizes very precisely with the 5′ end of ENAH (225,674,534–225,840,845 bp). However, the significance of this interaction peak against a background of multiple regions of amplification or gain at chromosome 1 in both BT483 and SUM44 cells is not clear. Similarly, while the other statistically significant trans interaction peaks that we observed may represent contacts between loci that share the same subcompartment within the nucleus (Fraser and Bickmore 2007), given the abnormal karyotypes of both breast cancer cell lines and the fact that many of these trans interaction peaks involved the random (control) capture regions, it is not clear that these interaction peaks are informative in the context of breast cancer risk.
While CHi-C can provide rich data on the likely targets of GWAS risk loci, the potential for informing the selection of putative causal variants may be more limited. Any SNP that is correlated with the published risk SNP could, in theory, be a causal variant. In practice, it is more likely that the causal variant will be strongly correlated with the published risk SNP. For the 9q31.2 and 8q24.21 loci, the bait fragments that formed significant interaction peaks mapped primarily to strong CTCF/RAD21 binding sites, and we found no evidence of SNPs that were correlated with the published risk SNP clustering within these interacting fragments. For the 2q35 locus we found multiple correlated SNPs, including two SNPs that were strongly correlated (r2 > 0.8) with rs13387042, clustering within a single HindIII fragment. In silico algorithms predict that both SNPs could affect the binding of a potentially relevant transcription factor. HOXB13 was expressed in a subset of the breast cancer cell lines assayed by Bild et al. (2006) and Wu et al. (2009), and a SNP (rs339331) that alters a HOXB13 binding site has recently been shown to affect prostate cancer risk by influencing expression of RFX6 (Huang et al. 2014). However, in vivo ChIP-qPCR data provided no evidence of sequence-specific binding of HOXB13 to rs12613955. Based on ChIP-seq data from three breast cancer cell lines (MCF-7, ZR75-1, and T-47D), Hurtado et al. (2011) demonstrated a highly significant enrichment of overlap between ESR1 (the defining feature of ER-positive breast cancer) and FOXA1 binding. Using ChIP-qPCR we found consistent evidence that FOXA1 binds to rs4442975 with the variant (T) allele favored over the reference (G) allele, supporting rs4442975 as a putative causal variant. However, fine mapping studies and detailed functional characterization providing statistical and functional evidence that supports or refutes this will be required to fully evaluate the potential of CHi-C for mapping putative causal variants.
In conclusion, we have demonstrated that our novel Hi-C protocol can provide high-resolution interaction maps of selected genomic regions. Our data are consistent with each of these gene deserts comprising complex regulatory regions. We can demonstrate long-range (up to 2.6 Mb) CTCF-associated interaction peaks with both protein-coding genes and lncRNAs. At the more active loci we can demonstrate multiple interaction peaks, in which several putative regulatory elements all interact with the same set of protein-coding genes and lncRNAs. Understanding the mechanisms by which these loci influence risk is likely to require an approach that takes into account the combined effects of multiple regulatory elements and assays the activities of both protein-coding genes and lncRNAs.
Methods
Target enrichment array design
To define our minimal target enrichment regions for the 2q35 (rs13387042), 8q24.21 (rs13281615), and 9q31.2 (rs865686) breast cancer risk loci, we used the web-based tool SNAP (http://www.broadinstitute.org/mpg/snap/) (Johnson et al. 2008) to identify the region that included all SNPs with minor allele frequencies (MAFs) of 5% or greater, and with r2 > 0.1 with the published SNP based on 1000 Genomes pilot data (http://www.1000genomes.org/) (The 1000 Genomes Project Consortium 2012). This resulted in regions of 943 kb (217,416,703–218,359,846 bp), 581 kb (127,888,336–128,469,498 bp), and 337 kb (110,759,922–111,097,304 bp) for the 2q35, 8q24.21, and 9q31.2 loci, respectively. One of our aims was to identify interaction peaks between hypothetical regulatory elements within the capture regions and protein-coding genes potentially mapping several 100 kb from the published risk SNP. For the 2q35 locus, therefore, we excluded the most centromeric 194 kb (217,416,703–217,610,271 bp) from the capture region as this included two a priori candidate protein-coding genes, IGFBP5 (217,536,828–217,560,272 bp) and IGFBP2 (217,498,127–217,529,158 bp). This reduced the 2q35 capture region to 750 kb (217,610,272–218,359,846 bp) and resulted in our excluding 15 SNPs that were weakly correlated (r2 < 0.22) with rs13387042. The coordinates of the three risk loci capture regions are given in Supplemental Table 1. We also selected three control regions that had no known association with breast cancer risk. The control regions were randomly selected from gene-poor regions of the genome and were selected to be of similar size to the risk loci (Supplemental Table 1). A SureSelect Custom Target Enrichment Array covering the three breast cancer risk loci and the three control regions was designed using eArray software (Agilent). The total enrichment target of 3.3 Mb was submitted to Agilent eArray software, generating 120-mer RNA baits designed to tile the nonrepetitive fraction of the test regions at 3× coverage with moderately stringent repeat masking.
Cell culture and formaldehyde crosslinking for Hi-C and 3C
BT483 and MCF7 cell lines were obtained from ATCC, SUM44 cells were from Asterand, and GM06990 cells were supplied by Coriell Cell Repositories (Coriell Institute for Medical Research). Genotype data for rs13387042 (2q35), rs13281615 (8q24.21), and rs865686 (9q32.1) in all four cell lines are shown in Supplemental Table 15.
BT483, SUM44, and GM06990 cells were grown in RPMI 1640 (Gibco, Life Technologies) supplemented with 20% (BT483), 10% (SUM44), or 15% (GM06990) fetal bovine serum (FBS, Life Technologies), 50 units/mL penicillin, 50 µg/mL streptomycin (Sigma-Aldrich), 2 mM L-Glutamine, and 0.01 mg/mL recombinant human insulin (Sigma-Aldrich; BT483), or 1 nM estradiol (Sigma-Aldrich; SUM44). MCF7 cells were grown in Dulbecco’s modified eagle medium (DMEM; Gibco, Life Technologies) supplemented with 10% FBS and 50 units/mL penicillin, 50 µg/mL streptomycin (Sigma-Aldrich), and 2 mM L-Glutamine. Formaldehyde crosslinking of 20 million cells was performed as described by Belton et al. (2012) by substituting standard culture media with FBS-free media containing 2% formaldehyde for 5 min at room temperature. Crosslinking was quenched by addition of glycine to a final concentration of 150 mM. Adherent cells (BT483, SUM44, and MCF7) were scraped off the culture flask after crosslinking. Cells were washed with cold PBS, snap-frozen in liquid nitrogen, and stored at −80°C before preparation of the Hi-C library.
Hi-C library generation
Each cross-linked cell aliquot (∼20 million cells) was resuspended in 50 mL of permeabilization buffer (10 mM Tris-HCl at pH 8, 10 mM NaCl, 0.2% IGEPAL CA-630 [Sigma-Aldrich], supplemented with complete mini EDTA free tablets [Roche]) and incubated on ice for 30 min with occasional mixing. SUM44 and GM06990 cells were lysed using 10 strokes of a dounce homogenizer. BT483 and MCF7 cells were lysed by incubating with trypsin (0.25%, Sigma-Aldrich) at 37°C for 5 min. Trypsin was inactivated by addition of 500 µL FBS. Permeabilized cells were centrifuged for 6 min at 600g and washed three times in 1 mL 1.3 × NEBuffer 2 (New England Biolabs). Nuclei were resuspended and chromatin digestion and Hi-C library preparation were carried out as described by van Berkum et al. (2010) with the following modifications: (1) Cells were split into three microcentrifuge tubes instead of five; (2) restriction fragment overhangs were filled in with biotinylated dATP instead of biotinylated dCTP; (3) dGTP was added to the reaction mixture for the removal of biotinylated dATP from unligated ends; (4) we did not include an agarose gel size selection step; (5) after PCR amplification (six to eight cycles) of the Hi-C library bound streptavidin beads, the PCR product was pooled and subjected to target enrichment (below) before paired-end sequencing.
Target enrichment
Target enrichment was performed based on the SureSelect protocol (Agilent) but incorporating the following modifications: (1) Biotinylated Hi-C ditags bound to streptavidin-beads were amplified prehybridization directly from beads using 24 parallel 25-µL PCR reactions with six to eight cycles using Phusion High-Fidelity DNA polymerase (New England Biolabs) to yield ∼500 ng total DNA. PCR primers to the paired-end adaptors were as described in Belton et al. (2012). Subsequently, PCR products were pooled, purified using Agencourt AMPure XP beads (Beckman Coulter) and dried using a speedvac concentrator, then resuspended in 34 µL of water. (2) Enriched fragments were amplified post-hybridization again directly from the streptavidin beads, using 13 parallel 25-µL reactions of six cycles of PCR. PCR products were again pooled and purified using Agencourt AMPure XP beads (Beckman Coulter).
Paired-end next generation sequencing (NGS), mapping, and filtering
Six target enriched Hi-C libraries (two biological replicates for each of three cell lines) were prepared. Each library was sequenced on a single flow cell lane on an Illumina HiSeq 2000 (Illumina) generating 76-bp paired-end reads. CASAVA software (v1.8, Illumina) was used to make base calls; reads failing the Illumina chastity filter were removed before further analysis. Sequences were output in FASTQ format before mapping against the human reference genome (GRCh37/hg19) and filtering to remove experimental artifacts using the publicly available Hi-C User Pipeline (HiCUP). Full details of this pipeline are available from Babraham Bioinformatics (http://www.bioinformatics.babraham.ac.uk/projects/hicup/). In addition to the standard pipeline, off-target di-tags (defined as di-tags where neither end mapped to one of the capture regions) were removed from the final processed data sets. Full details of the number and proportion of excluded di-tags are given in Supplemental Table 2.
Analysis of Hi-C interaction peaks
The three risk loci and three random regions comprised a total of 1077 HindIII fragments. Valid di-tags could be generated by ligations between a captured fragment and (1) another captured fragment in cis, (2) a noncaptured fragment in cis, mapping within 5 Mb, (3) a noncaptured fragment in cis, mapping >5 Mb from the captured fragment, or (4) a fragment in trans. In theory there are two classes of trans ligations: ligations between two captured fragments and ligations between a captured fragment and a noncaptured fragment. In practice we combined these because there were insufficient numbers of di-tags from two captured fragments for separate analyses (∼0.1% of all trans ligations were between two captured fragments).
We carried out separate analyses for each type of ligation (1–4 above) on the basis that the statistical properties of ligations where both ends of the di-tag have been captured (type [1]) will differ from those where just one end has been captured (type [2]) and that our power to detect significant interaction peaks (and hence our resolution) will depend on the read density. Thus, for types (1) and (2), our unit of analysis was individual HindIII fragments, but to increase our power for (3) and (4) we combined di-tags from individual HindIII fragments into 50-kb bins and tested for interaction peaks between each 50-kb bin within the capture region and all other bins (3) on the same chromosome and >5 Mb from the capture region or (4) all other chromosomes. We generated data sets that comprised all di-tags in each category using the SeqMonk mapped sequence analysis tool (http://www.bioinformatics.babraham.ac.uk/projects/seqmonk/).
High-resolution (per HindIII fragment) analyses of cis interaction peaks
In common with other “C”-based techniques, our Capture Hi-C methodology includes several steps that will show local differences in efficiency, thereby introducing biases in the detection of interaction peaks (Sanyal et al. 2012). We first excluded di-tags in which the two ligated fragments were <20-kb apart since, based on 3C data, interaction frequencies within the first 20 kb of the bait fragment occur at a very high frequency (Naumova et al. 2012). To correct for experimental biases we used a modification of the procedure described by Sanyal et al. (2012); specifically, on the assumption that the majority of trans ligations represent random events we calculated the total number of trans ligations (NT) made by each of the 1077 captured HindIII fragments as a measure of the fragment’s “interactability,” its propensity to interact with other fragments. The interactability had a bimodal distribution that we assumed to arise from two components corresponding to low numbers of counts, which we regarded as stochastic noise, and higher numbers of counts, which we regarded as genuine signal. We fitted a truncated negative binomial distribution to the higher component, with the truncation point set at a count of 1000 di-tags based on visual inspection of the histogram. We then defined a threshold at the 5% quantile point of the corresponding nontruncated distribution, and regarded all fragments with a total number of di-tags from trans ligations below this value to be noise. The threshold was close to a count of 500 for all of the cell lines we analyzed, so we finally fixed the threshold at a count of 500 for all analyses and filtered out all fragments with fewer than 500 di-tags from trans ligations. For the BT483, SUM44, and GM06990 libraries this resulted in excluding 18%, 27%, and 13% of the fragments with the lowest number of trans ligations (di-tags). We fitted negative binomial regression models to the filtered data sets, combining data from the two biological replicates for each cell line. We corrected for experimental biases due to differing interactability of fragments by including as a covariate the loge of the total number of trans ligations [ln(NT)] for each captured fragment from each biological replicate; for cis ligations within the capture regions we also included a term for interaction products of ln(NT) for each of the two ligated fragments in each biological replicate. We corrected for distance between the ligated fragments by including as a covariate the loge of the distance between the mid-points of the two fragments [ln(D)]; to approximate local smoothing we fitted the data in bins each of which contained 1 percentile of the distance range.
Low-resolution (per 50-kb bins) analysis of long-range (>5 Mb) cis and trans interaction peaks
For the longer range (>5 Mb), cis analyses and trans analyses data were modeled as above, using negative binomial regression models with local smoothing adjusting for the interactibility of the captured 50-kb bin [ln(NT)] in both analyses and [ln(D)] for cis but not trans analyses. P-values were obtained by comparing the observed counts with the fitted distributions. For each capture region in each cell line, we controlled the false discovery rate using the method of Benjamini and Hochberg (Benjamini et al. 2001).
Quantitative 3C
We generated (validation) 3C libraries from all three cell lines that we used for our CHi-C analysis. In addition, we generated 3C libraries from MCF7 breast cancer cells as they are an ER-positive, PR-positive cell line that has been used extensively as a model for ER-positive breast cancer, and we were able to access publicly available data on transcription factor binding sites and histone modifications generated by the ENCODE Project (The ENCODE Project Consortium 2011, 2012). MCF7s are derived from a pleural effusion and they have a modal number of 65 chromosomes. We did not initially select MCF7 cells for CHi-C as they are highly rearranged with translocations involving all chromosomes except chromosome 4 (http://www.path.cam.ac.uk/∼pawefish/BreastCellLineDescriptions/mcf7.htm). They have multiple regions of amplification or gain including a region of amplification that encompasses the 8q24.21 capture region and flanking sequences (Supplemental Fig. 1D).
3C libraries were generated using the crosslinking, digestion, and ligation steps of the Hi-C protocol (above) (van Berkum et al. 2010) excluding the biotin dNTP fill-in, which was replaced with the addition of 56.7 µL of water. For each of the risk loci, a control 3C template was generated using minimally overlapping BAC clones (Children’s Hospital Oakland Research Institute; Life Technologies) covering the entire capture and target region as previously described (Miele et al. 2006). To optimize the TaqMan PCR reactions and normalize the data, we generated standard curves using the control templates. TaqMan PCR was carried out using TaqMan Universal PCR Mastermix no UNG (Life Technologies) on 250 ng of 3C library. Reactions were carried out in triplicate with three biological replicates and expressed as relative interaction frequencies compared with the control BAC library standard curve. BAC libraries used are listed in Supplemental Table 16. Quantitative 3C primer and probe sequences are listed in Supplemental Table 17.
Quantitation of IGFBP5, KLF4, MYC, NSMCE2, DIRC3, PVT1 mRNA
RNA was extracted from cell lines (BT483, SUM44, MCF7, and GM06990) using the RNeasy Mini Kit (Qiagen). RNA was reverse transcribed to cDNA using the SuperScript III Reverse Transcriptase Kit (Life Technologies) according to the manufacturer’s instructions. Levels of expression were measured by using SYBR Green PCR Mastermix (Life Technologies) or TaqMan Universal PCR Mastermix no UNG (Life Technologies) and normalized to GAPDH. Each reaction was carried out in triplicate with three biological replicates. Primer sequences and TaqMan assay information is listed in Supplemental Table 18.
eQTL analysis
We accessed RNA-seq data in the form of RNA-seq by Expectation-Maximization (RSEM), genotype data (Affymetrix SNP 6.0) and clinical data (sex, ER status, and ethnicity) for 1048 breast cancer samples from The Cancer Genome Atlas (TCGA) data portal (http://cancergenome.nih.gov/) (The Cancer Genome Atlas Network 2012). Germline SNP calls for the three risk SNPs analyzed in this study (rs6721196 [2q35], rs471467 [9q31.2], and rs418269 [8q24.21]) were available for 1013 samples. Call rates for these three SNPs were 100%, 99.6%, and 99.7%, respectively. We excluded eight samples from male cases on the grounds that OR estimates for a subset of breast cancer risk SNPs are inconsistent between males and females (Orr et al. 2011, 2012). A total of 50 samples that had no clinical data were excluded from the analysis. We excluded 204 samples that were from women of non-Caucasian ethnicity on the grounds that tag SNP:disease associations are, in general, population specific. Finally, we excluded 116 samples from ER-negative tumors and 198 samples with missing data on ethnicity (156) or receptor status (42). The analysis was based on the remaining 437 samples. Linear regression of genotype (coded 0, 1, 2) on RSEM normalized RNA-seq expression data was implemented using the Matrix eQTL R-package described by Shabalin (2012).
ChIP-qPCR
Additional breast cancer (BT474) and prostate cancer (VCaP) cell lines were obtained from ATCC. BT474 cells were grown in phenol red-free RPMI 1640 (Gibco, Life Technologies) supplemented with 10% fetal bovine serum (FBS, Life Technologies), 1 nM estradiol, 50 units/mL penicillin, 50 µg/mL streptomycin, and 2 mM L-Glutamine (Sigma-Aldrich). VCaP cells were grown in DMEM (Gibco, Life Technologies) supplemented with 10% FBS, 50 units/mL penicillin, 50 µg/mL streptomycin, and 2 mM L-Glutamine (Sigma-Aldrich).
Chromatin immunoprecipitation was performed in MCF7, SUM44, BT474, and VCaP cells as previously described (Schmidt et al. 2009). Briefly, 1 × 10⁷ cells were fixed with 1% paraformaldehyde for 10 min. Cells were then lysed and chromatin sonicated using a Sonics Vibracell at 40% amplitude for eight cycles of 15 sec on, then 15 sec off. Chromatin was immunoprecipitated using an anti-FOXA1 antibody (ab5089 Abcam), anti-HOXB13 antibody (sc28333 Santa Cruz Biotechnology) or IgG control. Following DNA purification, DNA immunopreciptiated by FOXA1 was detected using primers to (1) the FOXA1 target gene MYC (positive control) (Hurtado et al. 2011), (2) the rs4442975 region (test region), and (3) a negative control region (Chr2: 217,922,940–217,923,055) mapping 2.1 kb telomeric to rs4442975 that showed no evidence of FOXA1 binding in data from Hurtado and colleagues. DNA immunoprecipitated by HOXB13 was detected using primers to (1) a region encompassing rs339331 (positive control), (2) a negative control region (ChrX: 151,322,487–151,322,621) both previously described (Huang et al. 2014), (3) the rs12613955 region (test region), and (4) a further control region (Chr2: 217,917,454–217,917,555) mapping ∼1.6 kb telomeric to rs12613955 and selected as lacking any active histone modification marks on the basis of ENCODE data in MCF7 cells. Sequences of the primers are given in Supplemental Table 19.
Sequencing of FOXA1 immunoprecipitated chromatin and input genomic DNA
The rs4442795 region was PCR amplified using 2.5 µL FOXA1 immunoprecipitated chromatin or 2.5 µL input genomic DNA (diluted 1:10) as template. The product (439 bp) was excised from a 3% agarose gel, purified using a QIAquick gel extraction kit (Qiagen), and sequenced by Sanger sequencing. Primer sequences for amplification and sequencing are given in Supplemental Table 19.
Pyrosequencing
Pyrosequencing of 1 µg of genomic DNA from each cell line was carried out by the London Genome Center (Barts and the London School of Medicine and Dentistry) using a PyroMark CpG assay (PM00097776 Qiagen) according to the manufacturer’s instructions.
Data access
Sequencing data from Capture Hi-C experiments have been submitted to the NCBI Gene Expression Omnibus (GEO; http://www.ncbi.nlm.nih.gov/geo/) under accession number GSE55634.
Acknowledgments
This work was supported by Breakthrough Breast Cancer, Cancer Research UK (C347/A13047), and Breast Cancer Campaign (2009NovPhD51). R.N. is funded by a Breast Cancer Campaign Career Development Fellowship. We acknowledge National Health Service funding to the NIHR Royal Marsden Biomedical Research Centre. F.D. is supported by the MRC (G1000718 and K006215). We thank Professor P.J.W. Rigby for helpful discussion of this manuscript.
Author contributions: Conception and experimental design: O.F., P.F., A.A. Data generation: N.H.D., L.R.B., N.J., S.S., T.N., I.K., I.A., K.F., R.N., M.L., E.P. Analysis and interpretation of data: F.D., N.O., S.A., S.W., S.L.M., J.C., N.H.D., L.R.B., O.F. Writing of the manuscript: O.F., P.F., A.A., N.H.D., L.R.B.
Footnotes
[Supplemental material is available for this article.]
Article published online before print. Article, supplemental material, and publication date are at http://www.genome.org/cgi/doi/10.1101/gr.175034.114.
References
- The 1000 Genomes Project Consortium . 2012. An integrated map of genetic variation from 1,092 human genomes. Nature 491: 56–65 [DOI] [PMC free article] [PubMed] [Google Scholar]
- Affer M, Chesi M, Chen WD, Keats JJ, Demchenko YN, Roschke AV, Van Wier S, Fonseca R, Bergsagel PL, Kuehl WM. 2014. Promiscuous rearrangements of the MYC locus hijack enhancers and super-enhancers to dysregulate MYC expression in multiple myeloma. Leukemia 28: 1725–1735 [DOI] [PMC free article] [PubMed] [Google Scholar]
- Ahmadiyeh N, Pomerantz MM, Grisanzio C, Herman P, Jia L, Almendro V, He HH, Brown M, Liu XS, Davis M, et al. 2010. 8q24 prostate, breast, and colon cancer risk loci show tissue-specific long-range interaction with MYC. Proc Natl Acad Sci 107: 9742–9746 [DOI] [PMC free article] [PubMed] [Google Scholar]
- Anderson CA, Soranzo N, Zeggini E, Barrett JC. 2011. Synthetic associations are unlikely to account for many common disease genome-wide association signals. PLoS Biol 9: e1000580. [DOI] [PMC free article] [PubMed] [Google Scholar]
- Bahcall O. 2013. Functional annotation of susceptibility loci identified by COGS. Nat Genet doi: 10.1038/ngicogs.3
- Belton JM, McCord RP, Gibcus JH, Naumova N, Zhan Y, Dekker J. 2012. Hi-C: a comprehensive technique to capture the conformation of genomes. Methods 58: 268–276 [DOI] [PMC free article] [PubMed] [Google Scholar]
- Benjamini Y, Drai D, Elmer G, Kafkafi N, Golani I. 2001. Controlling the false discovery rate in behavior genetics research. Behav Brain Res 125: 279–284 [DOI] [PubMed] [Google Scholar]
- Berger MF, Badis G, Gehrke AR, Talukder S, Philippakis AA, Pena-Castillo L, Alleyne TM, Mnaimneh S, Botvinnik OB, Chan ET, et al. 2008. Variation in homeodomain DNA binding revealed by high-resolution analysis of sequence preferences. Cell 133: 1266–1276 [DOI] [PMC free article] [PubMed] [Google Scholar]
- Bild AH, Yao G, Chang JT, Wang Q, Potti A, Chasse D, Joshi MB, Harpole D, Lancaster JM, Berchuck A, et al. 2006. Oncogenic pathway signatures in human cancers as a guide to targeted therapies. Nature 439: 353–357 [DOI] [PubMed] [Google Scholar]
- Bodmer D, Schepens M, Eleveld MJ, Schoenmakers EF, Geurts van Kessel A. 2003. Disruption of a novel gene, DIRC3, and expression of DIRC3-HSPBAP1 fusion transcripts in a case of familial renal cell cancer and t(2;3)(q35;q21). Genes Chromosomes Cancer 38: 107–116 [DOI] [PubMed] [Google Scholar]
- Bojesen SE, Pooley KA, Johnatty SE, Beesley J, Michailidou K, Tyrer JP, Edwards SL, Pickett HA, Shen HC, Smart CE, et al. 2013. Multiple independent variants at the TERT locus are associated with telomere length and risks of breast and ovarian cancer. Nat Genet 45: 371–384 [DOI] [PMC free article] [PubMed] [Google Scholar]
- Boyle AP, Hong EL, Hariharan M, Cheng Y, Schaub MA, Kasowski M, Karczewski KJ, Park J, Hitz BC, Weng S, et al. 2012. Annotation of functional variation in personal genomes using RegulomeDB. Genome Res 22: 1790–1797 [DOI] [PMC free article] [PubMed] [Google Scholar]
- Broeks A, Schmidt MK, Sherman ME, Couch FJ, Hopper JL, Dite GS, Apicella C, Smith LD, Hammet F, Southey MC, et al. 2011. Low penetrance breast cancer susceptibility loci are associated with specific breast tumor subtypes: findings from the Breast Cancer Association Consortium. Hum Mol Genet 20: 3289–3303 [DOI] [PMC free article] [PubMed] [Google Scholar]
- Butt AJ, Dickson KA, McDougall F, Baxter RC. 2003. Insulin-like growth factor-binding protein-5 inhibits the growth of human breast cancer cells in vitro and in vivo. J Biol Chem 278: 29676–29685 [DOI] [PubMed] [Google Scholar]
- The Cancer Genome Atlas Network . 2012. Comprehensive molecular portraits of human breast tumours. Nature 490: 61–70 [DOI] [PMC free article] [PubMed] [Google Scholar]
- Cowper-Sal lari R, Zhang X, Wright JB, Bailey SD, Cole MD, Eeckhoute J, Moore JH, Lupien M. 2012. Breast cancer risk-associated SNPs modulate the affinity of chromatin for FOXA1 and alter gene expression. Nat Genet 44: 1191–1198 [DOI] [PMC free article] [PubMed] [Google Scholar]
- Crowther-Swanepoel D, Broderick P, Di Bernardo MC, Dobbins SE, Torres M, Mansouri M, Ruiz-Ponte C, Enjuanes A, Rosenquist R, Carracedo A, et al. 2010. Common variants at 2q37.3, 8q24.21, 15q21.3 and 16q24.1 influence chronic lymphocytic leukemia risk. Nat Genet 42: 132–136 [DOI] [PMC free article] [PubMed] [Google Scholar]
- Dekker J, Rippe K, Dekker M, Kleckner N. 2002. Capturing chromosome conformation. Science 295: 1306–1311 [DOI] [PubMed] [Google Scholar]
- Dekker J, Marti-Renom MA, Mirny LA. 2013. Exploring the three-dimensional organization of genomes: interpreting chromatin interaction data. Nat Rev Genet 14: 390–403 [DOI] [PMC free article] [PubMed] [Google Scholar]
- Di Modugno F, DeMonte L, Balsamo M, Bronzi G, Nicotra MR, Alessio M, Jager E, Condeelis JS, Santoni A, Natali PG, et al. 2007. Molecular cloning of hMena (ENAH) and its splice variant hMena+11a: epidermal growth factor increases their expression and stimulates hMena+11a phosphorylation in breast cancer cell lines. Cancer Res 67: 2657–2665 [DOI] [PMC free article] [PubMed] [Google Scholar]
- Di Modugno F, Iapicca P, Boudreau A, Mottolese M, Terrenato I, Perracchio L, Carstens RP, Santoni A, Bissell MJ, Nistico P. 2012. Splicing program of human MENA produces a previously undescribed isoform associated with invasive, mesenchymal-like breast tumors. Proc Natl Acad Sci 109: 19280–19285 [DOI] [PMC free article] [PubMed] [Google Scholar]
- Dostie J, Richmond TA, Arnaout RA, Selzer RR, Lee WL, Honan TA, Rubio ED, Krumm A, Lamb J, Nusbaum C, et al. 2006. Chromosome Conformation Capture Carbon Copy (5C): a massively parallel solution for mapping interactions between genomic elements. Genome Res 16: 1299–1309 [DOI] [PMC free article] [PubMed] [Google Scholar]
- Dudbridge F, Fletcher O, Walker K, Johnson N, Orr N, Dos Santos Silva I, Peto J. 2012. Estimating causal effects of genetic risk variants for breast cancer using marker data from bilateral and familial cases. Cancer Epidemiol Biomarkers Prev 21: 262–272 [DOI] [PMC free article] [PubMed] [Google Scholar]
- Easton DF, Pooley KA, Dunning AM, Pharoah PD, Thompson D, Ballinger DG, Struewing JP, Morrison J, Field H, Luben R, et al. 2007. Genome-wide association study identifies novel breast cancer susceptibility loci. Nature 447: 1087–1093 [DOI] [PMC free article] [PubMed] [Google Scholar]
- Enciso-Mora V, Hosking FJ, Kinnersley B, Wang Y, Shete S, Zelenika D, Broderick P, Idbaih A, Delattre JY, Hoang-Xuan K, et al. 2013. Deciphering the 8q24.21 association for glioma. Hum Mol Genet 22: 2293–2302 [DOI] [PMC free article] [PubMed] [Google Scholar]
- The ENCODE Project Consortium . 2011. A user’s guide to the encyclopedia of DNA elements (ENCODE). PLoS Biol 9: e1001046. [DOI] [PMC free article] [PubMed] [Google Scholar]
- The ENCODE Project Consortium . 2012. An integrated encyclopedia of DNA elements in the human genome. Nature 489: 57–74 [DOI] [PMC free article] [PubMed] [Google Scholar]
- Ernst J, Kheradpour P, Mikkelsen TS, Shoresh N, Ward LD, Epstein CB, Zhang X, Wang L, Issner R, Coyne M, et al. 2011. Mapping and analysis of chromatin state dynamics in nine human cell types. Nature 473: 43–49 [DOI] [PMC free article] [PubMed] [Google Scholar]
- Ethier SP, Mahacek ML, Gullick WJ, Frank TS, Weber BL. 1993. Differential isolation of normal luminal mammary epithelial cells and breast cancer cells from primary and metastatic sites using selective media. Cancer Res 53: 627–635 [PubMed] [Google Scholar]
- Fasching PA, Pharoah PD, Cox A, Nevanlinna H, Bojesen SE, Karn T, Broeks A, van Leeuwen FE, van’t Veer LJ, Udo R, et al. 2012. The role of genetic breast cancer susceptibility variants as prognostic factors. Hum Mol Genet 21: 3926–3939 [DOI] [PMC free article] [PubMed] [Google Scholar]
- Fletcher O, Houlston RS. 2010. Architecture of inherited susceptibility to common cancer. Nat Rev Cancer 10: 353–361 [DOI] [PubMed] [Google Scholar]
- Fletcher O, Johnson N, Orr N, Hosking FJ, Gibson LJ, Walker K, Zelenika D, Gut I, Heath S, Palles C, et al. 2011. Novel breast cancer susceptibility locus at 9q31.2: results of a genome-wide association study. J Natl Cancer Inst 103: 425–435 [DOI] [PubMed] [Google Scholar]
- Forozan F, Veldman R, Ammerman CA, Parsa NZ, Kallioniemi A, Kallioniemi OP, Ethier SP. 1999. Molecular cytogenetic analysis of 11 new breast cancer cell lines. Br J Cancer 81: 1328–1334 [DOI] [PMC free article] [PubMed] [Google Scholar]
- Fraser P, Bickmore W. 2007. Nuclear organization of the genome and the potential for gene regulation. Nature 447: 413–417 [DOI] [PubMed] [Google Scholar]
- Freedman ML, Monteiro AN, Gayther SA, Coetzee GA, Risch A, Plass C, Casey G, De Biasi M, Carlson C, Duggan D, et al. 2011. Principles for the post-GWAS functional characterization of cancer risk loci. Nat Genet 43: 513–518 [DOI] [PMC free article] [PubMed] [Google Scholar]
- Frietze S, Wang R, Yao L, Tak YG, Ye Z, Gaddis M, Witt H, Farnham PJ, Jin VX. 2012. Cell type-specific binding patterns reveal that TCF7L2 can be tethered to the genome by association with GATA3. Genome Biol 13: R52. [DOI] [PMC free article] [PubMed] [Google Scholar]
- Gerstein MB, Kundaje A, Hariharan M, Landt SG, Yan KK, Cheng C, Mu XJ, Khurana E, Rozowsky J, Alexander R, et al. 2012. Architecture of the human regulatory network derived from ENCODE data. Nature 489: 91–100 [DOI] [PMC free article] [PubMed] [Google Scholar]
- Ghoussaini M, Song H, Koessler T, Al Olama AA, Kote-Jarai Z, Driver KE, Pooley KA, Ramus SJ, Kjaer SK, Hogdall E, et al. 2008. Multiple loci with different cancer specificities within the 8q24 gene desert. J Natl Cancer Inst 100: 962–966 [DOI] [PMC free article] [PubMed] [Google Scholar]
- Gupta RA, Shah N, Wang KC, Kim J, Horlings HM, Wong DJ, Tsai MC, Hung T, Argani P, Rinn JL, et al. 2010. Long non-coding RNA HOTAIR reprograms chromatin state to promote cancer metastasis. Nature 464: 1071–1076 [DOI] [PMC free article] [PubMed] [Google Scholar]
- Hindorff LA, Sethupathy P, Junkins HA, Ramos EM, Mehta JP, Collins FS, Manolio TA. 2009. Potential etiologic and functional implications of genome-wide association loci for human diseases and traits. Proc Natl Acad Sci 106: 9362–9367 [DOI] [PMC free article] [PubMed] [Google Scholar]
- Huang Q, Whitington T, Gao P, Lindberg JF, Yang Y, Sun J, Vaisanen MR, Szulkin R, Annala M, Yan J, et al. 2014. A prostate cancer susceptibility allele at 6q22 increases RFX6 expression by modulating HOXB13 chromatin binding. Nat Genet 46: 126–135 [DOI] [PubMed] [Google Scholar]
- Hughes JR, Roberts N, McGowan S, Hay D, Giannoulatou E, Lynch M, De Gobbi M, Taylor S, Gibbons R, Higgs DR. 2014. Analysis of hundreds of cis-regulatory landscapes at high resolution in a single, high-throughput experiment. Nat Genet 46: 205–212 [DOI] [PubMed] [Google Scholar]
- Huppi K, Pitt JJ, Wahlberg BM, Caplen NJ. 2012. The 8q24 gene desert: an oasis of non-coding transcriptional activity. Front Genet 3: 69. [DOI] [PMC free article] [PubMed] [Google Scholar]
- Hurtado A, Holmes KA, Ross-Innes CS, Schmidt D, Carroll JS. 2011. FOXA1 is a key determinant of estrogen receptor function and endocrine response. Nat Genet 43: 27–33 [DOI] [PMC free article] [PubMed] [Google Scholar]
- Jin F, Li Y, Dixon JR, Selvaraj S, Ye Z, Lee AY, Yen CA, Schmitt AD, Espinoza CA, Ren B. 2013. A high-resolution map of the three-dimensional chromatin interactome in human cells. Nature 503: 290–294 [DOI] [PMC free article] [PubMed] [Google Scholar]
- Johnson AD, Handsaker RE, Pulit SL, Nizzari MM, O’Donnell CJ, de Bakker PI. 2008. SNAP: a web-based tool for identification and annotation of proxy SNPs using HapMap. Bioinformatics 24: 2938–2939 [DOI] [PMC free article] [PubMed] [Google Scholar]
- Lasfargues EY, Coutinho WG, Redfield ES. 1978. Isolation of two human tumor epithelial cell lines from solid breast carcinomas. J Natl Cancer Inst 61: 967–978 [PubMed] [Google Scholar]
- Li Q, Seo JH, Stranger B, McKenna A, Pe’er I, Laframboise T, Brown M, Tyekucheva S, Freedman ML. 2013. Integrative eQTL-based analyses reveal the biology of breast cancer risk loci. Cell 152: 633–641 [DOI] [PMC free article] [PubMed] [Google Scholar]
- Lieberman-Aiden E, van Berkum NL, Williams L, Imakaev M, Ragoczy T, Telling A, Amit I, Lajoie BR, Sabo PJ, Dorschner MO, et al. 2009. Comprehensive mapping of long-range interactions reveals folding principles of the human genome. Science 326: 289–293 [DOI] [PMC free article] [PubMed] [Google Scholar]
- Mathelier A, Zhao X, Zhang AW, Parcy F, Worsley-Hunt R, Arenillas DJ, Buchman S, Chen CY, Chou A, Ienasescu H, et al. 2014. JASPAR 2014: an extensively expanded and updated open-access database of transcription factor binding profiles. Nucleic Acids Res 42: D142–D147 [DOI] [PMC free article] [PubMed] [Google Scholar]
- Meyer KB, Maia AT, O’Reilly M, Teschendorff AE, Chin SF, Caldas C, Ponder BA. 2008. Allele-specific up-regulation of FGFR2 increases susceptibility to breast cancer. PLoS Biol 6: e108. [DOI] [PMC free article] [PubMed] [Google Scholar]
- Miele A, Gheldof N, Tabuchi TM, Dostie J, Dekker J. 2006. Mapping chromatin interactions by chromosome conformation capture. Curr Protoc Mol Biol 80: 21.14.1–21.14.13 [DOI] [PubMed] [Google Scholar]
- Natoli G, Andrau JC. 2012. Noncoding transcription at enhancers: general principles and functional models. Annu Rev Genet 46: 1–19 [DOI] [PubMed] [Google Scholar]
- Natrajan R, Lambros MB, Rodriguez-Pinilla SM, Moreno-Bueno G, Tan DS, Marchio C, Vatcheva R, Rayter S, Mahler-Araujo B, Fulford LG, et al. 2009. Tiling path genomic profiling of grade 3 invasive ductal breast cancers. Clin Cancer Res 15: 2711–2722 [DOI] [PubMed] [Google Scholar]
- Naumova N, Smith EM, Zhan Y, Dekker J. 2012. Analysis of long-range chromatin interactions using Chromosome Conformation Capture. Methods 58: 192–203 [DOI] [PMC free article] [PubMed] [Google Scholar]
- Niland CN, Merry CR, Khalil AM. 2012. Emerging roles for long non-coding RNAs in cancer and neurological disorders. Front Genet 3: 25. [DOI] [PMC free article] [PubMed] [Google Scholar]
- Orr N, Cooke R, Jones M, Fletcher O, Dudbridge F, Chilcott-Burns S, Tomczyk K, Broderick P, Houlston R, Ashworth A, et al. 2011. Genetic variants at chromosomes 2q35, 5p12, 6q25.1, 10q26.13, and 16q12.1 influence the risk of breast cancer in men. PLoS Genet 7: e1002290. [DOI] [PMC free article] [PubMed] [Google Scholar]
- Orr N, Lemnrau A, Cooke R, Fletcher O, Tomczyk K, Jones M, Johnson N, Lord CJ, Mitsopoulos C, Zvelebil M, et al. 2012. Genome-wide association study identifies a common variant in RAD51B associated with male breast cancer risk. Nat Genet 44: 1182–1184 [DOI] [PMC free article] [PubMed] [Google Scholar]
- Ovcharenko I, Loots GG, Nobrega MA, Hardison RC, Miller W, Stubbs L. 2005. Evolution and functional classification of vertebrate gene deserts. Genome Res 15: 137–145 [DOI] [PMC free article] [PubMed] [Google Scholar]
- Phillips-Cremins JE, Corces VG. 2013. Chromatin insulators: linking genome organization to cellular function. Mol Cell 50: 461–474 [DOI] [PMC free article] [PubMed] [Google Scholar]
- Riaz M, Berns EM, Sieuwerts AM, Ruigrok-Ritstier K, de Weerd V, Groenewoud A, Uitterlinden AG, Look MP, Klijn JG, Sleijfer S, et al. 2012. Correlation of breast cancer susceptibility loci with patient characteristics, metastasis-free survival, and mRNA expression of the nearest genes. Breast Cancer Res Treat 133: 843–851 [DOI] [PubMed] [Google Scholar]
- Sakoda LC, Jorgenson E, Witte JS. 2013. Turning of COGS moves forward findings for hormonally mediated cancers. Nat Genet 45: 345–348 [DOI] [PubMed] [Google Scholar]
- Sanyal A, Lajoie BR, Jain G, Dekker J. 2012. The long-range interaction landscape of gene promoters. Nature 489: 109–113 [DOI] [PMC free article] [PubMed] [Google Scholar]
- Schmidt D, Wilson MD, Spyrou C, Brown GD, Hadfield J, Odom DT. 2009. ChIP-seq: using high-throughput sequencing to discover protein-DNA interactions. Methods 48: 240–248 [DOI] [PMC free article] [PubMed] [Google Scholar]
- Shabalin AA. 2012. Matrix eQTL: ultra fast eQTL analysis via large matrix operations. Bioinformatics 28: 1353–1358 [DOI] [PMC free article] [PubMed] [Google Scholar]
- Shete S, Hosking FJ, Robertson LB, Dobbins SE, Sanson M, Malmer B, Simon M, Marie Y, Boisselier B, Delattre JY, et al. 2009. Genome-wide association study identifies five susceptibility loci for glioma. Nat Genet 41: 899–904 [DOI] [PMC free article] [PubMed] [Google Scholar]
- Simonis M, Klous P, Splinter E, Moshkin Y, Willemsen R, de Wit E, van Steensel B, de Laat W. 2006. Nuclear organization of active and inactive chromatin domains uncovered by chromosome conformation capture-on-chip (4C). Nat Genet 38: 1348–1354 [DOI] [PubMed] [Google Scholar]
- Stacey SN, Manolescu A, Sulem P, Rafnar T, Gudmundsson J, Gudjonsson SA, Masson G, Jakobsdottir M, Thorlacius S, Helgason A, et al. 2007. Common variants on chromosomes 2q35 and 16q12 confer susceptibility to estrogen receptor-positive breast cancer. Nat Genet 39: 865–869 [DOI] [PubMed] [Google Scholar]
- Takahashi K, Yamanaka S. 2006. Induction of pluripotent stem cells from mouse embryonic and adult fibroblast cultures by defined factors. Cell 126: 663–676 [DOI] [PubMed] [Google Scholar]
- van Berkum NL, Lieberman-Aiden E, Williams L, Imakaev M, Gnirke A, Mirny LA, Dekker J, Lander ES. 2010. Hi-C: a method to study the three-dimensional architecture of genomes. J Vis Exp 39: e1869. [DOI] [PMC free article] [PubMed] [Google Scholar]
- Ward LD, Kellis M. 2012. HaploReg: a resource for exploring chromatin states, conservation, and regulatory motif alterations within sets of genetically linked variants. Nucleic Acids Res 40: D930–D934 [DOI] [PMC free article] [PubMed] [Google Scholar]
- Warren H, Dudbridge F, Fletcher O, Orr N, Johnson N, Hopper JL, Apicella C, Southey MC, Mahmoodi M, Schmidt MK, et al. 2012. 9q31.2-rs865686 as a susceptibility locus for estrogen receptor-positive breast cancer: evidence from the breast cancer association consortium. Cancer Epidemiol Biomarkers Prev 21: 1783–1791 [DOI] [PMC free article] [PubMed] [Google Scholar]
- Wernig M, Meissner A, Foreman R, Brambrink T, Ku M, Hochedlinger K, Bernstein BE, Jaenisch R. 2007. In vitro reprogramming of fibroblasts into a pluripotent ES-cell-like state. Nature 448: 318–324 [DOI] [PubMed] [Google Scholar]
- Wray NR, Purcell SM, Visscher PM. 2011. Synthetic associations created by rare variants do not explain most GWAS results. PLoS Biol 9: e1000579. [DOI] [PMC free article] [PubMed] [Google Scholar]
- Wu C, Orozco C, Boyer J, Leglise M, Goodale J, Batalov S, Hodge CL, Haase J, Janes J, Huss JW III, et al. 2009. BioGPS: an extensible and customizable portal for querying and organizing gene annotation resources. Genome Biol 10: R130. [DOI] [PMC free article] [PubMed] [Google Scholar]
- Yap KL, Li S, Munoz-Cabello AM, Raguz S, Zeng L, Mujtaba S, Gil J, Walsh MJ, Zhou MM. 2010. Molecular interplay of the noncoding RNA ANRIL and methylated histone H3 lysine 27 by polycomb CBX7 in transcriptional silencing of INK4a. Mol Cell 38: 662–674 [DOI] [PMC free article] [PubMed] [Google Scholar]
- Zhao Z, Tavoosidana G, Sjolinder M, Gondor A, Mariano P, Wang S, Kanduri C, Lezcano M, Sandhu KS, Singh U, et al. 2006. Circular chromosome conformation capture (4C) uncovers extensive networks of epigenetically regulated intra- and interchromosomal interactions. Nat Genet 38: 1341–1347 [DOI] [PubMed] [Google Scholar]