

Abstract
Skeletal muscle sirtuin 1 (SIRT1) expression is reduced under insulin-resistant conditions, such as those resulting from high-fat diet (HFD) feeding and obesity. Herein, we investigated whether constitutive activation of SIRT1 in skeletal muscle prevents HFD-induced muscle insulin resistance. To address this, mice with muscle-specific overexpression of SIRT1 (mOX) and wild-type (WT) littermates were fed a control diet (10% calories from fat) or HFD (60% of calories from fat) for 12 wk. Magnetic resonance imaging and indirect calorimetry were used to measure body composition and energy expenditure, respectively. Whole body glucose metabolism was assessed by oral glucose tolerance test, and insulin-stimulated glucose uptake was measured at a physiological insulin concentration in isolated soleus and extensor digitorum longus muscles. Although SIRT1 was significantly overexpressed in muscle of mOX vs. WT mice, body weight and percent body fat were similarly increased by HFD for both genotypes, and energy expenditure was unaffected by diet or genotype. Importantly, impairments in glucose tolerance and insulin-mediated activation of glucose uptake in skeletal muscle that occurred with HFD feeding were not prevented in mOX mice. In contrast, mOX mice showed enhanced postischemic cardiac functional recovery compared with WT mice, confirming the physiological functionality of the SIRT1 transgene in this mouse model. Together, these results demonstrate that activation of SIRT1 in skeletal muscle alone does not prevent HFD-induced glucose intolerance, weight gain, or insulin resistance.
Keywords: SIRT1, insulin resistance, high-fat diet, skeletal muscle
impaired glucose uptake in response to insulin is a common metabolic derangement that can result from the consumption of a hypercaloric, high-fat diet (HFD) and is a key contributor to the etiology of type 2 diabetes (6, 30). The NAD+-dependent protein deacetylase sirtuin 1 (SIRT1) may be a key convergence point that links fluctuations in nutrient status to the regulation of insulin sensitivity (18). Mechanistically, this occurs via deacetylation of acetylated targets by SIRT1, which in turn regulates their cellular localization and function (45). Supporting its possible role as an energy sensor in skeletal muscle, SIRT1 activity has been shown to increase in low nutrient conditions (38) and to decrease in insulin-resistant states such as those present in patients with type 2 diabetes and with HFD feeding (17, 40). Thus, interventions that activate SIRT1 hold promise for the treatment of insulin resistance and type 2 diabetes (18, 21). Indeed, SIRT1 activation with small molecule activators (16, 25, 26, 39) or via increasing NAD+ availability (3, 4, 12, 44) improves glucose homeostasis in models of insulin resistance.
To investigate the role of SIRT1 activation in vivo, several genetic mouse models have been created and have revealed metabolic benefits of SIRT1 overexpression. For example, mice with moderate SIRT1 overexpression in several important metabolic tissues, including white adipose tissue, brown adipose tissue, and brain, are leaner, have elevated energy expenditure, and display improved glucose tolerance (7). However, SIRT1 overexpression in these mice is not present in liver or skeletal muscle (7), tissues that are generally considered to be key mediators of postprandial glucose metabolism. In another mouse model, SIRT1 overexpression in multiple tissues, including liver, adipose tissue, and skeletal muscle, had no overt effects on glucose homeostasis on a low-fat diet but prevented HFD-induced glucose intolerance (31). Similarly, in a SIRT1 gain-of-function mouse model, HFD-fed mice were protected from glucose intolerance, although these improvements occurred in the liver and not skeletal muscle (5). Thus, although it is apparent from these transgenic mouse models that SIRT1 can provide protection from the deleterious effects of HFD on glucose metabolism, the contribution of skeletal muscle SIRT1 remains to be fully defined.
Regarding specific effects in skeletal muscle, SIRT1 overexpression in C2C12 myotubes has been demonstrated to protect against fatty acid-induced insulin resistance through transcriptional repression of protein-tyrosine phosphatase 1B (PTP1B) (40). Additionally, SIRT1 overexpression in L6 myotubes and primary human myotubes increases insulin-stimulated Akt activation, although whether this translates into functional improvements in insulin-stimulated glucose uptake or maintains insulin action under insulin-resistant conditions was not determined (17). In contrast to these cell-based studies, we recently found that skeletal muscle-specific overexpression of SIRT1 does not enhance muscle insulin sensitivity in young, lean mice in response to a physiological insulin concentration (43). Since it is possible that SIRT1 is protective only under insulin-resistant conditions (40), and given that SIRT1 activation in the presence of insulin resistance is more therapeutically relevant, the goal of the present study was to determine whether SIRT1 overexpression in skeletal muscle prevents HFD-induced insulin resistance in mice.
RESEARCH DESIGN AND METHODS
Animals.
Generation of the muscle-specific SIRT1 overexpressing (mOX) mouse has been described elsewhere (43). The control/wild-type (WT) mice for all studies were floxed, muscle creatine kinase (MCK) Cre-negative littermates. All mice were on a C57BL/6 background, with all studies conducted in male mice. At 10 wk of age, mice were randomized to either continue control (10% calories from fat) diet (CON) or were switched to a high-fat [60% calories from fat (90.7% and 9.3% of fat calories are from lard and soybean oil, respectively), 20% calories from carbohydrate, 20% calories from protein; D12492, Research Diets, New Brunswick, NJ] diet (HFD) for 12 wk. Major endpoint measurements, including ex vivo basal and insulin-stimulated 2-deoxyglucose uptake (2DOGU) and assessment of oral glucose tolerance, were performed in 21- to 22-wk-old, 4- to 6-h-fasted mice between 1300 and 1500. Gastrocnemius (GA) and tibialis anterior (TA) muscles for immunoblotting analysis were collected from mice at the same time that soleus and extensor digitorum longus (EDL) muscles were excised for 2DOGU experiments. Soleus and EDL muscles for MHC analysis were taken from nonfasted mice between 0900 and 1600. GA muscle for mitochondrial respiration analysis was collected from nonfasted mice between 0900 and 1030. All experiments were approved by and conducted in accordance with the Animal Care Program at the University of California, San Diego.
Isolated muscle 2DOGU.
Ex vivo muscle insulin sensitivity was measured by the 2DOGU technique in isolated soleus and EDL muscles as described previously (38, 43). Briefly, mice were fasted for 4 h and then deeply anesthetized. Soleus and EDL muscles were removed and incubated in oxygenated (95% O2-5% CO2) flasks containing Krebs-Henseleit buffer (KHB; 0.1% BSA, 2 mmol/l sodium pyruvate, 6 mmol/l mannitol) for 30 min at 35°C. One muscle of the pair was incubated in KHB without insulin and the other was incubated in KHB with 60 μU/ml (0.36 nmol/l) insulin. After this initial incubation, each muscle was transferred to a separate flask with KHB containing 9 mmol/l [14C]mannitol (0.053 mCi/mmol; PerkinElmer, Waltham, MA) and 1 mmol/l [3H]2DG (6 mCi/mmol; PerkinElmer) with or without 60 μU/ml insulin. At the end of the 20-min incubation, muscles were trimmed on ice-cold filter paper, freeze-clamped, and stored at −80°C.
Immunoprecipitation and immunoblotting.
Acetylated-peroxisome proliferator-activated receptor-γ coactivator 1α (Ac-PGC-1α) was assessed by immunoprecipitation in nuclear fractions (100 μg protein) of GA muscle, as previously described (32, 38). Nuclear fractions were isolated using a commercially available kit (78835: NE-PER; Thermo Scientific, Waltham, MA) (32). Immunoblotting was performed by SDS-PAGE, and the antibodies used for insulin signaling measurements have been described previously (38, 43). Additional antibodies used in this study include eEF2 (Cell Signaling Technology, Danvers MA, cat. no. 2332), cytochrome c (cyt-c; BD Biosciences, San Jose CA, cat. no. 556433), and antibodies from Life Technologies (Carlsbad CA): complex II (C-II, cat. no. A11142), complex IV subunit I (C-IV.1, cat. no. A6403), complex IV subunit IV (C-IV.4, cat. no. A21348), and complex Vβ (C-V, cat. no. A21351).
Blood glucose, plasma insulin and leptin concentrations.
Blood glucose concentration was determined from tail vein blood after a 4-h fast prior to an oral glucose tolerance test (OGTT) using a standard glucose meter. Whole blood was collected with EDTA from the inferior vena cava of anesthetized mice and centrifuged at 5,000 g at 4°C for 5 min, and the plasma was frozen at −80°C for subsequent determination of plasma insulin and leptin concentrations with a Milliplex mouse adipokine kit (Millipore, Billerica, MA).
OGTT.
After 11 wk on HFD, 4-h-fasted mice were orally gavaged with 5 g/kg dextrose. Blood glucose concentration was measured using a standard glucose meter by tail vein at 0, 20, 40, 60, 80, and 120 min. The OGTT area under the curve (AUC) was calculated using the trapezoidal rule.
Energy expenditure and body composition.
Energy expenditure (EE), respiratory exchange ratio (RER), spontaneous activity, fat oxidation, and body composition were assessed in 21- to 22-wk-old mice as previously described (43).
Real-time RT-PCR.
RNA was extracted from GA muscle using the phenol-chloroform method, and real-time RT-PCR was performed as previously described (43). Primer sequences for SIRT1 and GAPDH have been described previously (43). PTP1B primers were: 5′-TTTTCA AAGTCCGAGAGTCAG-3′ and 3′-AGTAAGAGGCAGGTGTCAG-5′.
Mitochondrial isolation and measurement of oxygen consumption.
GA was minced and further disrupted with a polytron in isolation buffer (100 mM KCl, 50 mM Tris base, pH 7.8, 5 mM MgSO4, 1 mM ATP, 1 mM EGTA, 0.5% BSA) containing 1 mg/ml subtilisin. The lysate was then homogenized in a 2-ml Teflon/glass Potter Elvehjem tissue grinder followed by centrifugation at 800 g at 4°C for 10 min. The postnuclear supernatant was filtered through 200-μm nylon mesh and centrifuged at 10,000 g for 10 min to generate a crude mitochondrial pellet. This pellet was resuspended in 210 mM mannitol, 70 mM sucrose, 5 mM HEPES (pH 7.2), 1 mM EGTA, and 0.5% BSA and centrifuged again (at 10,000 g) to generate the mitochondrial fraction used for measurement of oxygen consumption. Mitochondrial respiration was measured in a Seahorse XF96 (36). Briefly, mitochondria were centrifuged (2,000 g for 20 min at 4°C) in 20 μl into the wells of an XF96 plate at 1 μg/well in medium [70 mM sucrose, 220 mM mannitol, 10 mM KH2PO4, 5 mM MgCl2, 2 mM HEPES, 1 mM EGTA, 0.2% (wt/vol) fatty acid-free BSA, pH 7.2] containing substrate [10 mM glutamate + 10 mM malate (GLU/MAL) or 10 mM pyruvate + 1 mM malate (PYR/MAL)] and 4 mM ADP. The volume in each well was then brought to 100 μl with the same medium, and the plate was warmed to 37°C and transferred into the XF96 analyzer. State 3, state 4 (with 2 μM oligomycin) and uncoupler-stimulated respiration (with 4 μM FCCP) were measured with five replicate wells for each condition.
Myosin heavy chain.
Muscle fiber type was estimated using myosin heavy chain (MHC) composition as previously described (41). Snap-frozen muscles were weighed, crushed, and placed in sample buffer at a concentration of 125 μg/ml. Samples were loaded into SDS-PAGE gels, with 4% acrylamide stacking and 8% acrylamide resolving portions, and run at 4°C at 10 mA constant current for 1 h followed by 275 V constant voltage for 16–22 h. The gels were trimmed and stained according to the Bio-Rad Silver Stain Plus kit protocol (Bio-Rad, Hercules, CA), and bands were identified and quantified using densitometry (Quantity One, Bio-Rad).
Langendorff-perfused hearts.
At 13 wk of age, hearts were excised from WT and mOX mice and perfused on a Langendorff apparatus as described previously (35, 37). Briefly, hearts were stabilized for 30 min (15 min equilibration, 15 min pacing), after which time they were subjected to global, no-flow ischemia for 25 min followed by reperfusion for 45 min. Postischemic recovery of cardiac parameters including left ventricular developed pressure as a percent of baseline (%LVDP), left ventricular end-diastolic pressure (LVEDP), and peak positive and negative differentials of pressure percent change from baseline with time (%dP/dt max and %dP/dt min, respectively) were assessed throughout reperfusion. Lactate dehydrogenase (LDH), which is released during necrosis of cardiac myocytes, was measured from total perfusates collected over the reperfusion period using an in vitro colorimetric toxicology assay kit (Sigma-Aldrich, St. Louis, MO) as per manufacturer instructions.
Statistics.
Statistical analyses were performed using SPSS and Prism 6. Data were analyzed by three-way ANOVA with repeated measures when necessary, followed by Tukey's post hoc analysis with significant differences at P < 0.05. For the 2DOGU and insulin signaling data, main effects were diet, genotype, and treatment (basal vs. insulin). Once a significant effect for treatment was found, data were separated and two-way ANOVAs within basal and within insulin were performed. For EE data, a three-way ANOVA was performed for the main effects diet, genotype, and time (light vs. dark). Where there was a significant effect of time, data were analyzed by two-way ANOVA within light and within dark. OGTT AUC was analyzed with a two-way ANOVA for diet and genotype, and two-way ANOVAs were used to compare blood glucose levels at each time point of the OGTT. Langendorff-perfused heart data were analyzed with a two-way ANOVA with the main factors group and time followed by Bonferroni's post hoc multiple comparison with a significant difference assumed at P < 0.05. LDH activity [one value was treated as an outlier (more than two times the standard deviation of the mean)], MHC, Ac-PGC-1α, electron transport chain (ETC) proteins, and mitochondrial oxygen consumption were analyzed with a student's t-test. All data are expressed as means ± SE.
RESULTS
Model validation.
Nuclear PGC-1α acetylation was reduced by ∼30–40% in mOX vs. WT skeletal muscle (Fig. 1, A and B). Complementing this decrease in PGC-1α acetylation in mOX mice, the protein abundance of cyt c, C-II, and C-IV.4 of the ETC proteins were increased two- to threefold (Fig. 1, C and D). Together, this demonstrates the activity of SIRT1 is enhanced in mOX muscle. There was not, however, a universal increase in ETC proteins, as C-IV.1 and C-V were not different between genotypes (Fig. 1, C and D). Overall, this resulted in no change in the functional capacity of mitochondria, as evidenced by no difference in GLU/MAL- or PYR/MAL-stimulated state 3 respiration in isolated mitochondria (Fig. 1E). There was also no genotype differences in type I, IIa, IIx, or IIb MHC protein expression in soleus or EDL muscles (Fig. 1, F and G). Thus, in this murine model, although SIRT1 overexpression is functionally active in skeletal muscle, it is evident that it regulates some, but not all, components of the ETC. This is not unprecedented, and such findings are similar to those seen in mice with overexpression of nuclear respiratory factor 1 (NRF-1) in skeletal muscle (2).
Fig. 1.

Mice with muscle-specific overexpression of sirtuin 1 (SIRT1) (mOX mice) display reduced PPARγ coactivator 1α (PGC-1α) acetylation and increased protein expression of a subset of electron transport chain (ETC) proteins in skeletal muscle. Representative images (A) and quantification (B) of acetylated PGC-1α, which was determined by immunoprecipitation (IP) with an Ac-Lys or PGC-1α antibody, and subsequent immunoblotting (IB) with an Ac-Lys or PGC-1α antibody. Analysis was conducted in gastrocnemius (GA) muscle; n = 6–8/group. Representative images (C) and quantification (D) of mitochondrial ETC proteins in GA muscle; n = 4/group. Representative image (E) and quantification of MHC expression in soleus (SOL; F) and extensor digitorum longus (EDL; G) muscles; n = 14/group. H: maximal state 3 respiration measured in isolated mitochondria using glutamate/malate (GLU/MAL) or pyruvate/malate (PYR/MAL) as a substrate; n = 5/group. Data reported as means ± SE. *P < 0.05 vs. WT.
Tissue SIRT1 expression.
SIRT1 gene expression was ∼60-fold higher in GA muscle from mOX compared with WT mice but did not differ in liver or epididymal fat (Fig. 2A). SIRT1 protein levels were significantly higher in soleus and EDL muscles of mOX vs. WT mice, but there was no effect of diet on SIRT1 abundance (Fig. 2B).
Fig. 2.
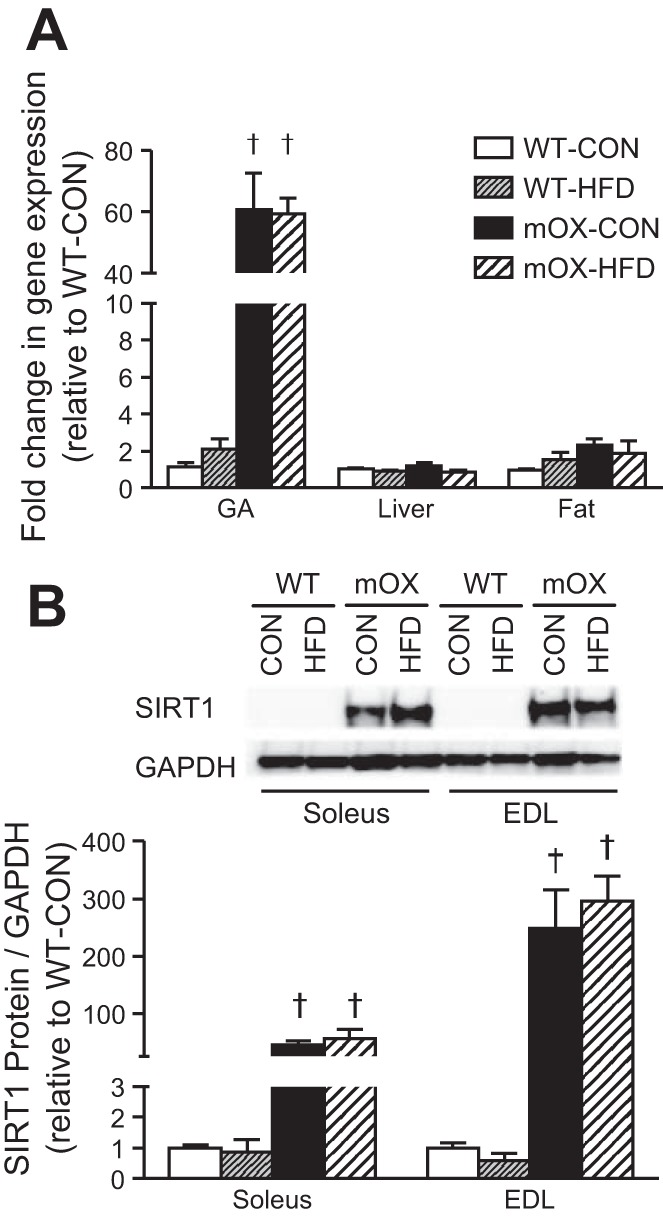
mOX mice have increased SIRT1 gene and protein expression in skeletal muscle. WT and mOX mice were fed a control (CON) or high-fat diet (HFD) for 12 wk. A: real-time RT-PCR measurement of SIRT1 gene expression in GA muscle, liver, and epididymal fat of mOX and WT mice fed CON or HFD. B: SIRT1 protein content in SOL and EDL muscles. Data reported as means ± SE; n = 4–6/group. †P < 0.05 vs. WT.
Body mass and plasma hormone concentrations.
Body mass, fat mass, and percent body fat were significantly higher after 12 wk of HFD feeding in both WT and mOX mice (Fig. 3, A and B). In line with these data, epididymal fat pad mass was significantly higher in HFD-fed mice, but there was no effect of diet or genotype on GA muscle mass, liver mass, or heart mass (Table 1). Fasting glucose levels were increased in WT and mOX animals fed the HFD compared with CON-fed mice (Table 2). Plasma insulin and leptin concentrations were increased similarly in WT and mOX mice on HFD compared with CON (Table 2).
Fig. 3.

HFD feeding increases body fat and fat oxidation in WT and mOX mice. WT and mOX mice were fed CON or HFD for 12 wk. Body mass, lean mass, and fat mass (A) and percent body fat (B). C–F: energy expenditure and spontaneous activity measurements were made using the CLAMS system over 3 consecutive days and averages for the light and dark cycles on days 2 and 3 are presented. V̇o2 (C) and respiratory exchange ratio (D; RER) were measured by indirect calorimetry. E: fat oxidation was calculated from indirect calorimetry data. F: total (x-total) activity was measured as all beam breaks on the horizontal axis. Data reported as means ± SE; n = 6/group. *P < 0.05 vs. CON.
Table 1.
Tissue mass
| WT-CON | WT-HF | mOX-CON | mOX-HF | |
|---|---|---|---|---|
| Gastrocnemius | 127 ± 2 | 130 ± 3 | 120 ± 3 | 124 ± 4 |
| Epididymal fat | 350 ± 28 | 1,702 ± 165* | 331 ± 31 | 1,436 ± 151* |
| Liver | 1,319 ± 53 | 1,278 ± 68 | 1,255 ± 42 | 1,635 ± 162 |
| Heart | 134 ± 2 | 142 ± 4 | 139 ± 5 | 150 ± 6 |
Data reported as means ± SE in mg; n = 7–24/group. Tissues were weighed to the nearest mg. CON, control diet; HF, high fat diet; WT, wild type mice; mOX, mice with muscle-specific overexpression of sirtuin 1.
P < 0.05 vs. CON.
Table 2.
Blood parameters
| WT-CON | WT-HF | mOX-CON | mOX-HF | |
|---|---|---|---|---|
| Fasting glucose, mg/dl | 123 ± 5 | 144 ± 10* | 111 ± 7 | 150 ± 15* |
| Plasma insulin, pg/ml | 623 ± 88 | 1,135 ± 184* | 518 ± 25 | 971 ± 177* |
| Plasma leptin, pg/ml | 806 ± 133 | 30,386 ± 4486* | 1,269 ± 257 | 19,677 ± 5448* |
Data reported as means ± SE; n = 7–24/group.
P < 0.05 vs. CON.
Whole body EE and spontaneous activity.
V̇o2 was higher during the dark vs. the light phase but was unaffected by diet or genotype (Fig. 3C). RER was decreased equally by HFD compared with CON in both WT and mOX mice (Fig. 3D). Consistent with the RER data, fat oxidation was increased similarly by HFD for both genotypes (Fig. 3E). Spontaneous activity, as measured by all beam breaks on the x-axis (x-total), was increased during the dark phase compared with the light phase and was not significantly affected by genotype or diet, though HFD trended (P = 0.058) to decrease activity in both WT and mOX mice compared with CON (Fig. 3F).
Oral glucose tolerance and skeletal muscle insulin sensitivity.
Blood glucose concentrations during the OGTT were significantly higher in HFD- vs. CON-fed mice (Fig. 4A), resulting in an ∼50% higher AUC (Fig. 3B), but there was no effect of genotype on oral glucose tolerance (Fig. 4, A and B). In line with our previous study (38), insulin-stimulated 2DOGU (insulin 2DOGU − basal 2DOGU) did not differ between WT and mOX mice on CON (Fig. 4C). As expected, insulin-stimulated 2DOGU in soleus and EDL muscles of WT mice was significantly decreased by ∼50% with HFD compared with CON-fed mice (Fig. 4C). Importantly, however, there was no effect of SIRT1 overexpression on the magnitude of this impairment (Fig. 4C). Basal 2DOG did not differ based on genotype or diet in the soleus (WT-CON: 0.26 ± 0.02; WT-HFD: 0.25 ± 0.03; mOX-CON: 0.19 ± 0.02; mOX-HFD: 0.20 ± 0.04, P > 0.05), or in the EDL with the exception that the mOX-HFD group had lower basal 2DOG than CON-fed animals (WT-CON: 0.25 ± 0.02; WT-HFD: 0.23 ± 0.01; mOX-CON: 0.28 ± 0.04; mOX-HFD: *0.17 ± 0.04, *P < 0.05). Complementing the 2DOGU data, insulin-stimulated activation of Akt and GSK3β in soleus (Fig. 4, D and F) and EDL muscles (Fig. 4, E and G) was impaired by HFD but was unaffected by SIRT1 overexpression. There was no effect of diet or genotype on basal p-AktSer473, p-AktThr308 or p-GSK3βSer9. There was no effect of diet or genotype on PTP1B gene expression (WT-CON: 1.0 ± 0.2; WT-HFD: 0.9 ± 0.1; mOX-CON: 1.2 ± 0.1; mOX-HFD: 1.0 ± 0.1, fold change vs. WT-CON, P > 0.05).
Fig. 4.

SIRT1 overexpression in muscle does not protect against HFD-induced impairments in glucose tolerance or insulin-stimulated glucose uptake. WT and mOX mice were fed CON or HFD for 12 wk. Blood glucose concentrations (A) and area under the curve (AUC) quantification (B) during a 120-min oral glucose tolerance test (5 g/kg). C: insulin-stimulated 2-deoxyglucose uptake (2DOGU), calculated as insulin (60 μU/ml) 2DOGU − basal 2DOGU in isolated SOL and EDL muscles. Phospo-AktSer473 (pAktSer473), phospho-AktThr308 (pAktThr308), total Akt, phospho-GSK3βSer9 (pGSK3βSer9), and total GSK3β in basal and insulin-stimulated (B and I, respectively) SOL (D) and EDL (E) muscles. Quantification of pAktSer473, pAktThr308, and pGSK3βSer9 compared with total protein abundance of Akt and GSK3β in SOL (F) and EDL (G) muscles. Data reported as means ± SE; n = 6–15/group. *P < 0.05 vs. CON.
SIRT1 overexpression protects the heart from ischemia/reperfusion injury.
Herein, we confirmed the functionality of the SIRT1 transgene in mOX mice by measuring recovery from ischemia/reperfusion (I/R) injury in the heart, which is known to be modulated by SIRT1 (1, 18, 19, 27, 31). This was possible as the mOX mouse was generated using mice with Cre recombinase driven by the muscle creatine kinase (MCK) promoter, which drives transgene expression in both skeletal and cardiac muscle (17, 21). Accordingly, SIRT1 gene expression was ∼100-fold higher in mOX compared with WT hearts (Fig. 5A). The mOX hearts had a significantly reduced level of LDH in the effluent after the 45-min reperfusion period (Fig. 5B), indicating a reduction in cardiac cell death. Remarkably, SIRT1 overexpression restored cardiac function after I/R injury to ∼80% of preischemia levels vs. ∼50% in WT hearts, as evidenced by increased percent left ventricular developed pressure (Fig. 5C), decreased diastolic dysfunction (Fig. 5D), increased force of muscle contraction (%dP/dt max − inotropic state; Fig. 5E), and increased myocardial relaxation (%dP/dt min − lusitropic state; Fig. 5F).
Fig. 5.

SIRT1 overexpression protects the heart from ischemia/reperfusion (I/R) injury. A: SIRT1 gene expression in heart relative to GAPDH. WT and mOX mice were subjected to I/R injury on a Langendorff perfused heart setup. B: release of LDH was reduced in mOX compared with WT hearts. Percent left ventricular developed pressure (C), end-diastolic pressure (D), and %dP/dt max/min (E and F) were improved with SIRT1 overexpression. There were significant main effects of diet and genotype and a significant interaction (P < 0.05). Data reported as means ± SE; n = 5–8/group. *P < 0.05 vs. WT.
DISCUSSION
Given the potential benefit of SIRT1 activation for the treatment of insulin resistance (16, 25, 26, 39), and the importance of skeletal muscle in postprandial glycemia (14), we investigated whether overexpression of SIRT1 in skeletal muscle is sufficient to prevent obesity-related impairments in glucose tolerance and muscle insulin action. In line with our recent study (43), we observed no beneficial effect of skeletal muscle-specific overexpression of SIRT1 on insulin-stimulated glucose uptake in mice fed CON. Significantly, we now extend these findings to reveal that SIRT1 overexpression does not prevent HFD-induced weight gain or impairments in insulin-stimulated glucose uptake in skeletal muscle.
The role of SIRT1 in the regulation of skeletal muscle insulin action is controversial. For example, our current data are in agreement with reports that show no effect of SIRT1 overexpression on glucose disposal during a hyperinsulinemic-euglycemic clamp in HFD-fed or aged mice (5), insulin-stimulated glucose uptake in isolated soleus and EDL muscles in CON-fed mice (43), or in C2C12 myotubes under normal cell culture conditions (40). In contrast, under insulin-resistant conditions induced by treatment with free fatty acids, insulin-stimulated glucose uptake is slightly enhanced in C2C12 myotubes in which SIRT1 is overexpressed (40). In addition, others have demonstrated that glucose uptake during a hyperinsulinemic-euglycemic clamp and/or glucose tolerance are improved by treatment with SIRT1 activators (16, 25), SIRT1 overexpression (29), or by increasing NAD+ availability to enhance SIRT1 activity (3, 4, 12, 44). However, in those studies it is difficult to discern whether the observed beneficial effects on glucose metabolism are due to direct activation of SIRT1 in skeletal muscle or if they are due to effects of SIRT1 activation in other important metabolic tissues such as adipose tissue, pancreas, or liver. Indeed, activation of SIRT1 specifically in adipose tissue (23), β-cells (8, 27), or liver (24, 46) of HFD-fed rodents has been shown to improve glucose homeostasis. Furthermore, improvements in glucose tolerance have been reported in a mouse model with moderate overexpression of SIRT1 in brain and adipose tissue but not in skeletal muscle, suggesting that effects in these other tissues, but not in skeletal muscle, play a role in the metabolic benefits of SIRT1 activation (7). Together, these studies highlight the importance of investigating the tissue-specific effects of SIRT1 activation and reveal that SIRT1 is not an important mediator of skeletal muscle insulin action under normal or overfeeding conditions.
With regard to skeletal muscle specifically, recent studies have shown that overexpression of SIRT1 in L6 myoblasts and primary human myotubes enhances insulin-stimulated Akt activation under normal conditions (17). Conversely, SIRT1 overexpression in C2C12 myotubes does not enhance insulin-stimulated Akt activation under normal conditions but prevents impairments in Akt activation induced by treatment with palmitate (40). In that study, protection from palmitate-induced impairments in insulin signaling were found to be due to increased suppression of PTP1B by SIRT1 (40). Interestingly, we observed no effects of muscle-specific SIRT1 overexpression on PTP1B gene expression in CON- or HFD-fed mice. We also found no effect of SIRT1 overexpression on insulin signaling in CON-fed mice or protection against HFD-mediated impairments in insulin signaling. The discrepancy between our results and those reported previously (17, 40) could be explained by the difference in the model systems that were used, since immortalized muscle cell lines and primary muscle cells may not recapitulate the behavior of bona fide skeletal muscle. In addition, we used a physiological insulin concentration (0.36 nmol/l) to study insulin action, whereas those other studies used insulin concentrations (100–1,000 nmol/l) that are well above the normal physiological range (17, 40). However, although the insulin concentration used is an important consideration, we previously reported that SIRT1 overexpression in skeletal muscle does not alter insulin signaling even in response to a supraphysiological insulin dose in young, lean mice (43), further highlighting differences between in vitro muscle models and studies in skeletal muscle. While our observation that SIRT1 gene expression and protein levels were not significantly reduced with HFD contrasts with some reports (17, 40), others have observed a reversal of HFD-induced insulin resistance with increased SIRT1 activation, even in the absence of an HFD-induced decrease in SIRT1 levels (13, 15, 31). This suggests that in tissues such as liver and adipose tissue SIRT1 activation above normal levels holds potential for reversing HFD-induced insulin resistance, and the current results reveal that this activation solely in skeletal muscle is not sufficient to prevent or reverse HFD-induced insulin resistance.
Another important alternative to consider is the activity of the SIRT1 transgene in mOX mice. We are confident that the SIRT1 transgene is active in skeletal muscle of mOX mice, as evidenced by the fact that SIRT1 is overexpressed by ∼100-fold, and the acetylation of p53 (43) and PGC-1α, well-known targets of SIRT1, are significantly reduced in mOX vs. WT muscle. We also found significant increases in the protein expression of some, but not all, ETC proteins. Nevertheless, because we saw no effect of SIRT1 overexpression on skeletal muscle insulin action, we sought to confirm the functionality of SIRT1 overexpression in our model by assessing recovery from I/R injury in the hearts of mOX and WT mice, as SIRT1 has previously been shown to be cardioprotective in I/R models (1, 19, 20, 28, 29). We were able to do this because the MCK Cre mouse used to generate the mOX model results in overexpression of SIRT1 in both skeletal and cardiac muscle (9, 22, 42). In line with prior reports on the protective effects of SIRT1 (1, 19, 20, 28, 29), mOX hearts were almost completely protected against I/R injury compared with WT hearts. These data confirm that SIRT1 is active and functional in mOX mice, and as such, if increasing SIRT1 activity per se modulates skeletal muscle insulin action, we believe that it would be observable in our model. An additional consideration is that the magnitude of SIRT1 overexpression in the mOX mouse is so large (greater than 100-fold), and this level of activation may lead to detrimental effects that would obscure any possible benefits of moderate SIRT1 activation, as has been observed in the heart (1). However, even moderate (2- to 3-fold) whole body SIRT1 overexpression (including skeletal muscle) does not reverse HFD-induced insulin resistance (5). Together, this suggests that large-scale overexpression of SIRT1 is likely not a confounding issue in the mOX model and also that neither low- nor high-level overexpression of SIRT1 in skeletal muscle improves insulin action in normal chow- or HFD-fed mice.
In addition to its purported role in insulin sensitivity and signaling, SIRT1 has been advocated as a key regulator of energy expenditure and metabolism (10, 11, 18, 21). For example, moderately higher energy expenditure has been observed in SIRT1-overexpressing mice on HFD (31). Furthermore, treatment with small-molecule activators of SIRT1 has been demonstrated to protect against HFD-induced obesity (16, 26) and to increase V̇o2 in animals fed an HFD (16). In contrast, V̇o2 and body weight were reported to be unaltered with moderate whole body overexpression of SIRT1 in young mice fed normal chow (31). Interestingly, SIRT1 gain of function in mice fed HFD does not affect body weight gain, spontaneous activity, or metabolic rate (5) but decreases metabolic rate in mice fed normal chow (5). Clearly, the role of increased SIRT1 activity in the modulation of energy expenditure and body weight/composition is controversial, and discrepancies in reported data may reflect tissue-specific effects of SIRT1 activation. Until now, the muscle-specific effects of SIRT1 activation on whole body energy metabolism in HFD-fed mice have not been reported. In the present study, we observed increased body weight and fat mass, decreased RER, and increased fat oxidation with HFD feeding, but we did not observe any effects of muscle-specific SIRT1 overexpression on whole body energy expenditure or body composition. Thus, it is evident that the observed benefits of whole body SIRT1 overexpression on energy expenditure and protection from HFD-induced obesity likely occur due to contributions from tissues other than skeletal muscle. For example, enhanced energy expenditure has been observed in SIRT1-overexpressing mice that lack increased SIRT1 activity in skeletal muscle (7). Additionally, SIRT1 overexpression in the brain significantly increases V̇o2 (34), and SIRT1 activation induces the “browning” of white adipose tissue, which is associated with increased metabolic rate (33).
In summary, SIRT1 activation has been put forth as a promising therapeutic approach for the treatment of insulin resistance and type 2 diabetes. However, since systemic SIRT1 upregulation by genetic and pharmacological means leads to SIRT1 activation in multiple tissues, it is important to understand the contribution of specific tissues to the insulin-sensitizing effects of SIRT1 activation. Herein, we report that skeletal muscle-specific overexpression of SIRT1 in mice does not attenuate the deleterious effects of HFD-induced obesity on glucose tolerance or skeletal muscle insulin sensitivity. Furthermore, SIRT1 overexpression in muscle does not alter whole body energy expenditure or prevent weight gain caused by HFD feeding. In conclusion, it is apparent that improvements in skeletal muscle insulin sensitivity, glucose tolerance, and body composition that manifest due to whole body SIRT1 activation in HFD models result from SIRT1 activation in tissues other than skeletal muscle. This should be an important consideration in future studies aimed at understanding the potential of SIRT1 activators as therapeutics for the treatment of insulin resistance and type 2 diabetes.
GRANTS
S. Schenk and this research were supported by the National Institute of Aging and National Institute of Child Health and Human Development of the National Institutes of Health (NIH) under award numbers R01 AG-043120 and R24 HD-050837. S. Schenk also received support for this work from a UCSD Academic Senate (RL131M) grant, and a Pilot and Feasibility grant from the UCSD/UCLA Diabetes and Endocrinology Research Center, which is supported by the National Institute of Diabetes and Digestive and Kidney Diseases of the NIH under award number P30 DK-063491. H. H. Patel was supported by grants from the NIH under award numbers HL-091071 and HL-107200,- and a VA merit grant BX001963. D. L. Hamilton is supported by a Society for Endocrinology Early Career Grant. C. E. McCurdy is supported by grants from the NIH (P30 DK-048520, P30 DK-57516) and the Office of Research in Women's Health (K12 HD-057022). The content is solely the responsibility of the authors and does not necessarily represent the official views of the National Institutes of Health.
DISCLOSURES
No conflicts of interest, financial or otherwise are reported by the author(s).
AUTHOR CONTRIBUTIONS
S.S., A.T.W., H.N.F, J.M.S, and H.H.P. conception and design of the study; S.S., A.T.W., H.N.F, J.M.S., and H.H.P. analysis and interpretation of data; D.L.H., A.P., A.N.M. and C.E.M. conducted analysis and reviewed the manuscript; H.N.F., J.M.S., and H.H.P. reviewed the manuscript; A.T.W. design and drafting of the manuscript; S.S. revised manuscript critically; S.S., A.T.W., H.N.F, J.M.S, H.H.P., D.L.H., A.P., A.N.M. and C.E.M. gave final approval.
ACKNOWLEDGMENTS
We are grateful to Benjamin Huang, Elisa Buckner, and Jennie R. Kim for assistance with mouse studies. We also thank the UCSD Animal Care Program Phenotyping Core for the measurements of energy expenditure and spontaneous activity and Jianhua Shao (Department of Pediatrics, University of California, San Diego) for use of the MRI machine.
REFERENCES
- 1.Alcendor RR, Gao S, Zhai P, Zablocki D, Holle E, Yu X, Tian B, Wagner T, Vatner SF, Sadoshima J. Sirt1 regulates aging and resistance to oxidative stress in the heart. Circ Res 100: 1512–1521, 2007 [DOI] [PubMed] [Google Scholar]
- 2.Baar K, Song Z, Semenkovich CF, Jones TE, Han DH, Nolte LA, Ojuka EO, Chen M, Holloszy JO. Skeletal muscle overexpression of nuclear respiratory factor 1 increases glucose transport capacity. FASEB J 17: 1666–1673, 2003 [DOI] [PubMed] [Google Scholar]
- 3.Bai P, Canto C, Brunyanszki A, Huber A, Szanto M, Cen Y, Yamamoto H, Houten SM, Kiss B, Oudart H, Gergely P, Menissier-de Murcia J, Schreiber V, Sauve AA, Auwerx J. PARP-2 regulates SIRT1 expression and whole-body energy expenditure. Cell Metab 13: 450–460, 2011 [DOI] [PMC free article] [PubMed] [Google Scholar]
- 4.Bai P, Canto C, Oudart H, Brunyanszki A, Cen Y, Thomas C, Yamamoto H, Huber A, Kiss B, Houtkooper RH, Schoonjans K, Schreiber V, Sauve AA, Menissier-de Murcia J, Auwerx J. PARP-1 inhibition increases mitochondrial metabolism through SIRT1 activation. Cell Metab 13: 461–468, 2011 [DOI] [PMC free article] [PubMed] [Google Scholar]
- 5.Banks AS, Kon N, Knight C, Matsumoto M, Gutierrez-Juarez R, Rossetti L, Gu W, Accili D. SirT1 gain of function increases energy efficiency and prevents diabetes in mice. Cell Metab 8: 333–341, 2008 [DOI] [PMC free article] [PubMed] [Google Scholar]
- 6.Barnard RJ, Youngren JF. Regulation of glucose transport in skeletal muscle. FASEB J 6: 3238–3244, 1992 [DOI] [PubMed] [Google Scholar]
- 7.Bordone L, Cohen D, Robinson A, Motta MC, van Veen E, Czopik A, Steele AD, Crowe H, Marmor S, Luo J, Gu W, Guarente L. SIRT1 transgenic mice show phenotypes resembling calorie restriction. Aging Cell 6: 759–767, 2007 [DOI] [PubMed] [Google Scholar]
- 8.Bordone L, Motta MC, Picard F, Robinson A, Jhala US, Apfeld J, McDonagh T, Lemieux M, McBurney M, Szilvasi A, Easlon EJ, Lin SJ, Guarente L. Sirt1 regulates insulin secretion by repressing UCP2 in pancreatic beta cells. PLoS Biology 4: e31, 2006 [DOI] [PMC free article] [PubMed] [Google Scholar]
- 9.Bruning JC, Michael MD, Winnay JN, Hayashi T, Horsch D, Accili D, Goodyear LJ, Kahn CR. A muscle-specific insulin receptor knockout exhibits features of the metabolic syndrome of NIDDM without altering glucose tolerance. Mol Cell 2: 559–569, 1998 [DOI] [PubMed] [Google Scholar]
- 10.Canto C, Auwerx J. PGC-1alpha, SIRT1 and AMPK, an energy sensing network that controls energy expenditure. Curr Opin Lipidol 20: 98–105, 2009 [DOI] [PMC free article] [PubMed] [Google Scholar]
- 11.Canto C, Auwerx J. Targeting sirtuin 1 to improve metabolism: all you need is NAD(+)? Pharmacol Rev 64: 166–187, 2012 [DOI] [PMC free article] [PubMed] [Google Scholar]
- 12.Canto C, Houtkooper RH, Pirinen E, Youn DY, Oosterveer MH, Cen Y, Fernandez-Marcos PJ, Yamamoto H, Andreux PA, Cettour-Rose P, Gademann K, Rinsch C, Schoonjans K, Sauve AA, Auwerx J. The NAD(+) precursor nicotinamide riboside enhances oxidative metabolism and protects against high-fat diet-induced obesity. Cell Metab 15: 838–847, 2012 [DOI] [PMC free article] [PubMed] [Google Scholar]
- 13.Caron AZ, He X, Mottawea W, Seifert EL, Jardine K, Dewar-Darch D, Cron GO, Harper ME, Stintzi A, McBurney MW. The SIRT1 deacetylase protects mice against the symptoms of metabolic syndrome. FASEB J 28: 1306–1316, 2014 [DOI] [PubMed] [Google Scholar]
- 14.DeFronzo RA, Tripathy D. Skeletal muscle insulin resistance is the primary defect in type 2 diabetes. Diabetes Care 32, Suppl 2: S157–S163, 2009 [DOI] [PMC free article] [PubMed] [Google Scholar]
- 15.Escande C, Chini CC, Nin V, Dykhouse KM, Novak CM, Levine J, van Deursen J, Gores GJ, Chen J, Lou Z, Chini EN. Deleted in breast cancer-1 regulates SIRT1 activity and contributes to high-fat diet-induced liver steatosis in mice. J Clin Invest 120: 545–558, 2010 [DOI] [PMC free article] [PubMed] [Google Scholar]
- 16.Feige JN, Lagouge M, Canto C, Strehle A, Houten SM, Milne JC, Lambert PD, Mataki C, Elliott PJ, Auwerx J. Specific SIRT1 activation mimics low energy levels and protects against diet-induced metabolic disorders by enhancing fat oxidation. Cell Metab 8: 347–358, 2008 [DOI] [PubMed] [Google Scholar]
- 17.Frojdo S, Durand C, Molin L, Carey AL, El-Osta A, Kingwell BA, Febbraio MA, Solari F, Vidal H, Pirola L. Phosphoinositide 3-kinase as a novel functional target for the regulation of the insulin signaling pathway by SIRT1. Mol Cell Endocrinol 335: 166–176, 2011 [DOI] [PubMed] [Google Scholar]
- 18.Haigis MC, Sinclair DA. Mammalian sirtuins: biological insights and disease relevance. Annu Rev Pathol 5: 253–295, 2010 [DOI] [PMC free article] [PubMed] [Google Scholar]
- 19.Hsu CP, Odewale I, Alcendor RR, Sadoshima J. Sirt1 protects the heart from aging and stress. Biol Chem 389: 221–231, 2008 [DOI] [PubMed] [Google Scholar]
- 20.Hsu CP, Zhai P, Yamamoto T, Maejima Y, Matsushima S, Hariharan N, Shao D, Takagi H, Oka S, Sadoshima J. Silent information regulator 1 protects the heart from ischemia/reperfusion. Circulation 122: 2170–2182, 2010 [DOI] [PMC free article] [PubMed] [Google Scholar]
- 21.Hubbard BP, Sinclair DA. Small molecule SIRT1 activators for the treatment of aging and age-related diseases. Trends Pharmacol Sci 35: 146–154, 2014 [DOI] [PMC free article] [PubMed] [Google Scholar]
- 22.Johnson JE, Wold BJ, Hauschka SD. Muscle creatine kinase sequence elements regulating skeletal and cardiac muscle expression in transgenic mice. Mol Cell Biol 9: 3393–3399, 1989 [DOI] [PMC free article] [PubMed] [Google Scholar]
- 23.Kotas ME, Gorecki MC, Gillum MP. Sirtuin-1 is a nutrient-dependent modulator of inflammation. Adipocyte 2: 113–118, 2013 [DOI] [PMC free article] [PubMed] [Google Scholar]
- 24.Li Y, Xu S, Giles A, Nakamura K, Lee JW, Hou X, Donmez G, Li J, Luo Z, Walsh K, Guarente L, Zang M. Hepatic overexpression of SIRT1 in mice attenuates endoplasmic reticulum stress and insulin resistance in the liver. FASEB J 25: 1664–1679, 2011 [DOI] [PMC free article] [PubMed] [Google Scholar]
- 25.Milne JC, Lambert PD, Schenk S, Carney DP, Smith JJ, Gagne DJ, Jin L, Boss O, Perni RB, Vu CB, Bemis JE, Xie R, Disch JS, Ng PY, Nunes JJ, Lynch AV, Yang H, Galonek H, Israelian K, Choy W, Iffland A, Lavu S, Medvedik O, Sinclair DA, Olefsky JM, Jirousek MR, Elliott PJ, Westphal CH. Small molecule activators of SIRT1 as therapeutics for the treatment of type 2 diabetes. Nature 450: 712–716, 2007 [DOI] [PMC free article] [PubMed] [Google Scholar]
- 26.Minor RK, Baur JA, Gomes AP, Ward TM, Csiszar A, Mercken EM, Abdelmohsen K, Shin YK, Canto C, Scheibye-Knudsen M, Krawczyk M, Irusta PM, Martin-Montalvo A, Hubbard BP, Zhang Y, Lehrmann E, White AA, Price NL, Swindell WR, Pearson KJ, Becker KG, Bohr VA, Gorospe M, Egan JM, Talan MI, Auwerx J, Westphal CH, Ellis JL, Ungvari Z, Vlasuk GP, Elliott PJ, Sinclair DA, de Cabo R. SRT1720 improves survival and healthspan of obese mice. Sci Rep 1: 70, 2011 [DOI] [PMC free article] [PubMed] [Google Scholar]
- 27.Moynihan KA, Grimm AA, Plueger MM, Bernal-Mizrachi E, Ford E, Cras-Meneur C, Permutt MA, Imai S. Increased dosage of mammalian Sir2 in pancreatic beta cells enhances glucose-stimulated insulin secretion in mice. Cell Metab 2: 105–117, 2005 [DOI] [PubMed] [Google Scholar]
- 28.Nadtochiy SM, Redman E, Rahman I, Brookes PS. Lysine deacetylation in ischaemic preconditioning: the role of SIRT1. Cardiovasc Res 89: 643–649, 2011 [DOI] [PMC free article] [PubMed] [Google Scholar]
- 29.Nadtochiy SM, Yao H, McBurney MW, Gu W, Guarente L, Rahman I, Brookes PS. SIRT1-mediated acute cardioprotection. Am J Physiol Heart Circ Physiol 301: H1506–H1512, 2011 [DOI] [PMC free article] [PubMed] [Google Scholar]
- 30.Petersen KF, Shulman GI. Pathogenesis of skeletal muscle insulin resistance in type 2 diabetes mellitus. Am J Cardiol 90: 11G–18G, 2002 [DOI] [PubMed] [Google Scholar]
- 31.Pfluger PT, Herranz D, Velasco-Miguel S, Serrano M, Tschop MH. Sirt1 protects against high-fat diet-induced metabolic damage. Proc Natl Acad Sci USA 105: 9793–9798, 2008 [DOI] [PMC free article] [PubMed] [Google Scholar]
- 32.Philp A, Chen A, Lan D, Meyer GA, Murphy AN, Knapp AE, Olfert IM, McCurdy CE, Marcotte GR, Hogan MC, Baar K, Schenk S. Sirtuin 1 (SIRT1) deacetylase activity is not required for mitochondrial biogenesis or peroxisome proliferator-activated receptor-(gamma) coactivator-1(alpha) (PGC-1(alpha)) deacetylation following endurance exercise. J Biol Chem 286: 30561–30570, 2011 [DOI] [PMC free article] [PubMed] [Google Scholar]
- 33.Qiang L, Wang L, Kon N, Zhao W, Lee S, Zhang Y, Rosenbaum M, Zhao Y, Gu W, Farmer SR, Accili D. Brown remodeling of white adipose tissue by SirT1-dependent deacetylation of Ppargamma. Cell 150: 620–632, 2012 [DOI] [PMC free article] [PubMed] [Google Scholar]
- 34.Ramadori G, Fujikawa T, Anderson J, Berglund ED, Frazao R, Michan S, Vianna CR, Sinclair DA, Elias CF, Coppari R. SIRT1 deacetylase in SF1 neurons protects against metabolic imbalance. Cell Metab 14: 301–312, 2011 [DOI] [PMC free article] [PubMed] [Google Scholar]
- 35.Reichelt ME, Willems L, Hack BA, Peart JN, Headrick JP. Cardiac and coronary function in the Langendorff-perfused mouse heart model. Exp Physiol 94: 54–70, 2009 [DOI] [PubMed] [Google Scholar]
- 36.Rogers GW, Brand MD, Petrosyan S, Ashok D, Elorza AA, Ferrick DA, Murphy AN. High throughput microplate respiratory measurements using minimal quantities of isolated mitochondria. PLoS ONE 6: e21746, 2011 [DOI] [PMC free article] [PubMed] [Google Scholar]
- 37.Sastri M, Haushalter KJ, Panneerselvam M, Chang P, Fridolfsson H, Finley JC, Ng D, Schilling JM, Miyanohara A, Day ME, Hakozaki H, Petrosyan S, Koller A, King CC, Darshi M, Blumenthal DK, Ali SS, Roth DM, Patel HH, Taylor SS. A kinase interacting protein (AKIP1) is a key regulator of cardiac stress. Proc Natl Acad Sci USA 110: E387–396, 2013 [DOI] [PMC free article] [PubMed] [Google Scholar]
- 38.Schenk S, McCurdy CE, Philp A, Chen MZ, Holliday MJ, Bandyopadhyay GK, Osborn O, Baar K, Olefsky JM. Sirt1 enhances skeletal muscle insulin sensitivity in mice during caloric restriction. J Clin Invest 121: 4281–4288, 2011 [DOI] [PMC free article] [PubMed] [Google Scholar]
- 39.Smith JJ, Kenney RD, Gagne DJ, Frushour BP, Ladd W, Galonek HL, Israelian K, Song J, Razvadauskaite G, Lynch AV, Carney DP, Johnson RJ, Lavu S, Iffland A, Elliott PJ, Lambert PD, Elliston KO, Jirousek MR, Milne JC, Boss O. Small molecule activators of SIRT1 replicate signaling pathways triggered by calorie restriction in vivo. BMC systems biology 3: 31, 2009 [DOI] [PMC free article] [PubMed] [Google Scholar]
- 40.Sun C, Zhang F, Ge X, Yan T, Chen X, Shi X, Zhai Q. SIRT1 improves insulin sensitivity under insulin-resistant conditions by repressing PTP1B. Cell Metab 6: 307–319, 2007 [DOI] [PubMed] [Google Scholar]
- 41.Talmadge RJ, Roy RR. Electrophoretic separation of rat skeletal muscle myosin heavy-chain isoforms. J Appl Physiol (1985) 75: 2337–2340, 1993 [DOI] [PubMed] [Google Scholar]
- 42.Trask RV, Billadello JJ. Tissue-specific distribution and developmental regulation of M and B creatine kinase mRNAs. Biochim Biophys Acta 1049: 182–188, 1990 [DOI] [PubMed] [Google Scholar]
- 43.White AT, McCurdy CE, Philp A, Hamilton DL, Johnson CD, Schenk S. Skeletal muscle-specific overexpression of SIRT1 does not enhance whole-body energy expenditure or insulin sensitivity in young mice. Diabetologia 56: 1629–1637, 2013 [DOI] [PMC free article] [PubMed] [Google Scholar]
- 44.Yoshino J, Mills KF, Yoon MJ, Imai S. Nicotinamide mononucleotide, a key NAD(+) intermediate, treats the pathophysiology of diet- and age-induced diabetes in mice. Cell Metab 14: 528–536, 2011 [DOI] [PMC free article] [PubMed] [Google Scholar]
- 45.Yu J, Auwerx J. Protein deacetylation by SIRT1: an emerging key post-translational modification in metabolic regulation. Pharmacol Res 62: 35–41, 2010 [DOI] [PMC free article] [PubMed] [Google Scholar]
- 46.Zhou B, Li C, Qi W, Zhang Y, Zhang F, Wu JX, Hu YN, Wu DM, Liu Y, Yan TT, Jing Q, Liu MF, Zhai QW. Downregulation of miR-181a upregulates sirtuin-1 (SIRT1) and improves hepatic insulin sensitivity. Diabetologia 55: 2032–2043, 2012 [DOI] [PubMed] [Google Scholar]