Abstract
Clinical inhibitors Darunavir (DRV) and Amprenavir (APV) are less effective on HIV-2 protease (PR2) than on HIV-1 protease (PR1). To identify molecular basis associated with the lower inhibition, molecular dynamics (MD) simulations and molecular mechanics Poisson-Boltzmann surface area (MM-PBSA) calculations were performed to investigate the effectiveness of the PR1 inhibitors DRV and APV against PR1/PR2. The rank of predicted binding free energies agrees with the experimental determined one. Moreover, our results show that two inhibitors bind less strongly to PR2 than to PR1, again in agreement with the experimental findings. The decrease in binding free energies for PR2 relative to PR1 is found to arise from the reduction of the van der Waals interactions induced by the structural adjustment of the triple mutant V32I, I47V and V82I. This result is further supported by the difference between the van der Waals interactions of inhibitors with each residue in PR2 and in PR1. The results from the principle component analysis suggest that inhibitor binding tends to make the flaps of PR2 close and the one of PR1 open. We expect that this study can theoretically provide significant guidance and dynamics information for the design of potent dual inhibitors targeting PR1/PR2.
Acquired immunodeficiency syndrome (AIDS) has been a global pandemic threatening health of people. According to the UNAIDS report, Over 60 million people around the world were infected with HIV and 25 million deaths have occurred1. HIV-1 and HIV-2 are two etiological causative agents of AIDS. HIV-1 is observed in worldwide, while HIV-2 is more prevalent in West Africa2,3,4. However, the patients infected by HIV-2 are slowly and persistently increasing in other parts of the world5,6. Currently, an alert trend of cross-infections of HIV-1 and HIV-2 is increasingly spreading7, but no drugs have been designed specifically targeting HIV-2.
HIV-1 protease (PR1) and HIV-2 protease (PR2) play an important role during maturation of infectious AIDS virus. PR1 and PR2 share about 50% sequence identity and very similar overall structure8,9,10,11,12,13. Currently, there are 10 U.S food and drug administration (FDA)-approved PR1 inhibitors (PIs). These PIs can competitively bind in the active-site cavity of PR1 and block hydrolysis of the viral Gag and Gal-Pol polyproteins, resulting in immature and noninfectious virions. Due to the lacks of drugs specially targeting HIV-2, PIs have been used in therapy for patients infected by HIV-2 and show lower efficiency and weaker inhibition of PR2 compared with that of PR114,15,16,17,18. The previous studies indicate that the wild-type PR2 sequence harbors multiple substitutions related with multi-drug resistance and cross-resistance of HIV-1 on current PIs19. The presence of these resistance mutations in PR2 suggests that the development of potent new drugs specially targeting PR2 is essential in treatment of HIV-2 infections.
Understanding the origin of decrease in potency of PIs against PR2 compared to PR1 is beneficial for designs of potent PR2 inhibitors. Although many experimental works and computational studies have been performed to probe interaction mechanisms of inhibitors with PR1 and drug resistance of PR19,20,21,22,23,24, researches on binding modes of PIs to PR2 are still fewer. Tie et al. solved the crystal structure of PR2 with clinical inhibitor amprenavir (APV) at 1.5 Å resolution to identify structural changes associated with the lower inhibition25. Kovalevsky et al. obtained the crystal structures of PR2 complexes with inhibitors darunavir (DRV), GRL98065 and GRL06579A to analyze the molecular basis for antiviral potency11. Kar et al. applied MD simulations and binding free energy calculation to investigate the binding modes of DRV, GRL98065 and GRL06579A to PR1/PR2 and revealed the origin of the decrease in binding affinity26. Recently, Brower et al. also assessed the effectiveness of currently FDA-approved PIs against the PR2 and they observed a decrease in potency for PR2 compared to PR1 by factors ranging from 2 to 8027. Thus further clarification of interaction mechanism of PIs with PR1/PR2 help to develop dual-inhibitors treating cross-infection of two type HIV.
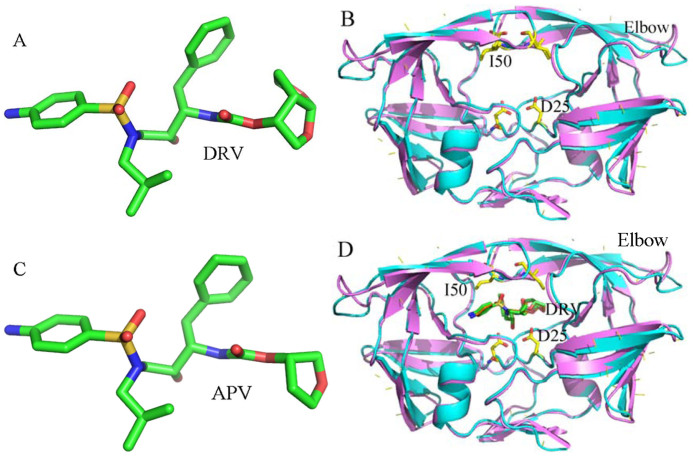
In this study, two inhibitors Darunavir (DRV) and amprenavir (APV) were selected to probe distinct effects of inhibitor bindings on PR1 and PR2. DRV was designed to target drug-resistant PR1 by forming more hydrogen bonds with main-chain PR atoms compared to older PIs and its structure was shown in Figure 1A and B28,29. DRV showed 17-fold decreased inhibition for PR2 compared to PR127. APV is a potent inhibitor and efficiently inhibits the activity of PR1 (Figure 1C and D), but some mutations (V32I, I47V and V82I) in PR2 produce natural resistance to APV. Thus it is significant to study the difference in binding abilities of inhibitors to PR1/PR2 and conformational changes of PR1/PR2 induced by PI bindings at atomic level for designs of potent PR2 inhibitors.
Figure 1. Molecular structures of inhibitors, PR1 and PR2.
(A) Darunavir(DRV), (B) superimposed structures of PR1 (violet) and PR2 (cyans) in a cartoon diagram, (C) Amprenavir (APV), (D) superimposed structures of the inhibitor-PR1 (violext) and inhibitor-PR2 (cyans) complexes in a cartoon diagram. DRV, APV and key residues are shown in sticks.
Recent studies have shown that molecular simulations have been an important tool to study inhibitor-protein interactions, protein folding, and other important properties of proteins30,31,32,33,34,35,36,37,38,39,40,41,42,43,44,45,46,47,48,49. In this work, MD simulations and MM-PBSA method50,51,52 have been adopted to quantitatively study the mechanism underlying the bindings of DRV and APV to PR2 and clarify the origin of decrease in potency of these two inhibitors against PR2 relative to PR1. At the same time, cross-correlation analysis and PC analysis were also performed to probe the difference in internal dynamics and conformational changes of PR2/PR1 induced by inhibitor binding. This study can not only reveal the molecular basis of lower inhibition of inhibitors against PR2, but also provide significant dynamical information for designing potent dual inhibitors inhibiting the activities of PR1 and PR2.
Results
Stability and flexibility of the PR1/PR2-inhibitor complex
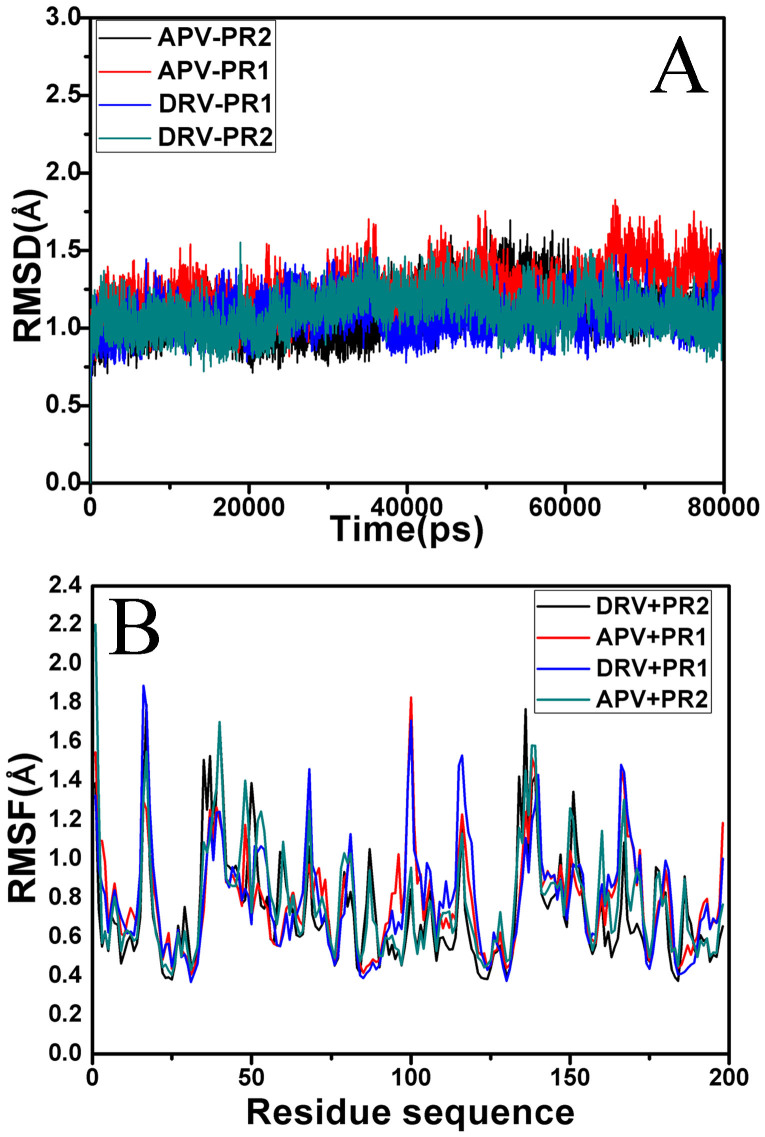
To evaluate the reliability of MD simulation equilibrium, the root mean square deviation (RMSD) of the backbone atoms relative to the corresponding crystal structure during simulations were computed and plotted in Figure 2A. It is shown that four simulated systems have reached equilibrium after 20 ns simulation. The average RMSD of the backbone atoms after the equilibrium are 1.12, 1.33, 1.07 and 1.21 Å for the DRV-PR2, APV-PR1, DRV-PR1 and APV-PR2 complexes, respectively. All RMSD deviations from the mean value are lower than 0.69 Å. Thus, the equilibrium of MD simulation is reliable. The result also indicates that the fluctuations of four systems from their corresponding crystal structures are similar.
Figure 2. RMSD and RMSF values for PR1 and PR2.
(A) the root-mean-square deviations (RMSD) of the backbone atoms relative to the corresponding crystal structures as function of time, (B) the root-mean-square fluctuation (RMSF) of Cα atoms of PR1 and PR2.
Root mean square fluctuation (RMSF) of Cα atoms may provide direct insights into the structural fluctuation and flexibility of different regions in PR1 and PR2. The RMSF values of Cα atoms in individual residues of PR1 and PR2 are calculated and shown in Figure 2B. As revealed in Figure 2B, the residues near the catalytic D25/D25′ present a high degree of rigidity in PR1/PR2, which is expected, as the catalytic function of these residues presumably requires a well-defined stable three dimensional structure. However, the regions around the residues 38(38′), 50(50′) and 84(84′) in PR2 produce bigger flexibility relative to the corresponding regions of PR1. Previous studies have proved that the above regions in PR2 have three key mutations V32I, I47V and V82I11,53. These mutations may induce the flexibility changes in PR2 and the difference in binding abilities of inhibitors to PR2 relative to PR1, and this result basically agrees with the study from Kar et al.26.
Cross-correlation analysis
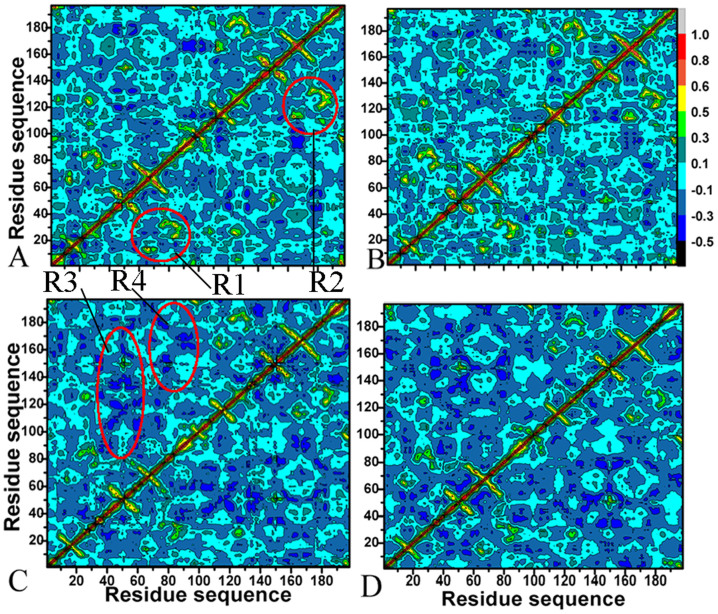
To further probe the difference in internal dynamics of PR1/PR2 induced by inhibitor bindings, cross-correlation matrices of the Cα atom fluctuations after equilibrium of MD simulations were calculated using the Ptraj program in Amber 12 and plotted in Figure 3. Highly positive regions (red and yellow) and negative ones (dark blue) represent strong correlated motion and anti-correlated movement, respectively. Overall, inhibitor binding induce obvious anti-correlated motions in PR1/PR2, but very few highly correlated movements are observed except for the diagonal regions, which describes the correlation of a residue relative to itself.
Figure 3. Cross-correlation matrices of the fluctuations of the coordinates for Cα atoms around their mean positions after the equilibrium of MD simulation.
The extent of correlated motions and anticorrelated motions are color-coded. (A) DRV-PR1, (B) APV-PR1, (C) DRV-PR2 and (D) APV-PR2.
In the case of the DRV-PR1 and APV-PR1 complexes, inhibitor binding produce similar correlated motion in PR1. Except for the diagonal parts, obvious correlated motions (red and yellow) are found in the regions R1 and R2 (Figure 3A and B). The region R1 reflects the correlated motion of the residues 60–90 relative to the residues 10–30, while the region R2 indicates the one of the residues 60′–90′ relative to 10′–30′. Compared to the DRV-PR1 and APV-PR1 complexes, inhibitor bindings induce different dynamics behavior in PR2. Firstly, inhibitor binding not only lead to the decrease in correlated motions of the diagonal regions in PR2 relative to PR1, but also the disappearance of the correlated motions in the region R1 and R2 of PR2. Secondly, the anti-correlated motions of the regions R3 and R4 from PR2 are obviously strengthened by two inhibitor bindings. For the region R3, the anti-correlated motion occurs between the residues 30–60 of chain A and the residues 5′–90′ of chain B, while the region R4 reflects the anti-correlated motion of residues 78–95 relative to 40′–80′. Based on the C2 symmetry of PR2, the analysis of chain B is similar. The difference in motion modes induced by inhibitor bindings may owe to the one in sequence of PR1 and PR2, which involve three key mutations V32I, I47V and V82I. The above analyses agree well with the previous RMSF fluctuations.
Principal component analysis
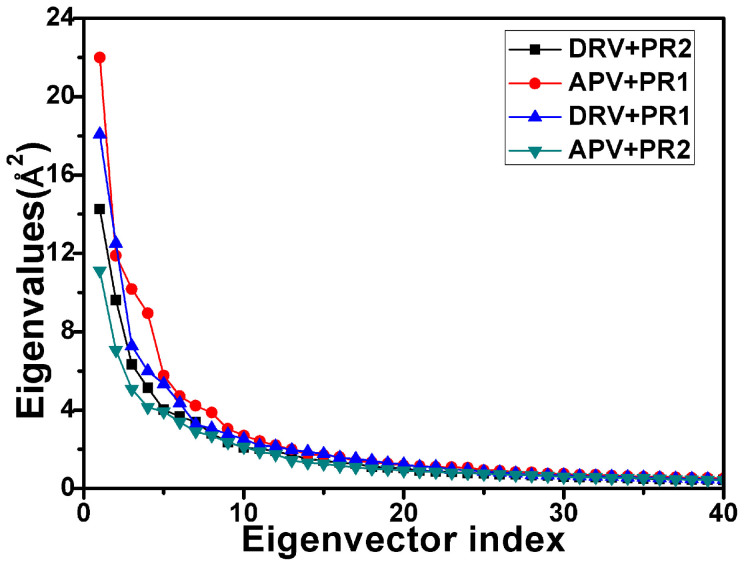
In this work, concerted motions in PR1/PR2 were investigated by performing PC analysis on MD trajectory. Figure 4 shows a plot of eigenvalues obtained from the diagonalization of the covariance matrix of atomic fluctuations, plotted in decreasing order versus the corresponding eigenvector indices for PR1/PR2. The first few eigenvalues correspond to concerted motions that quickly reduce in amplitude to reach a large number of constrained, more localized fluctuations. The first six principal components account for 57.9%, 55.6%, 53.4% and 49.6% of the motions observed after the last 40 ns of the trajectories for the APV-PR1, DRV-PR1, DRV-PR2 and APV-PR2 complexes, respectively.
Figure 4. Comparison of the eigenvalues plotted against the corresponding eigenvector indices obtained from the Cα covariance matrix conducted from the equilibrium phase of MD simulations.
Comparing the four studied systems, one can see that the first few eigenvalues of PR2 complexed with two inhibitors are lower than the ones of PR1. This result indicates that the properties of the motions described by the first few principal components are not the same for PR1 and PR2.
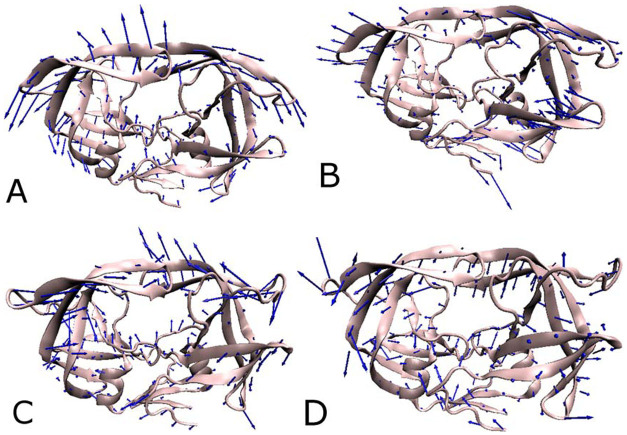
To qualitatively understand the effect of inhibitor bindings on the dominant motion of each residue in every system studied here, the dominant movements defined by the first eigenvector are obtained by performing the PC analysis on the MD trajectory and depicted in Figure 5. As seen in Figure 5, inhibitor bindings produce the most significant effect on the flap region and β strands in the top of PR1/PR2. An interesting phenomenon can be noted that the flap regions and β strands in PR1 move away from each other (Figure 5A and B), which tends to make the flaps open. However for the PR2, different dynamics behavior occurs in the flaps and β strands. In the case of the DRV-PR2 complex, the flaps and β strands run close to each other, and for the APV-PR2 complex, the flaps and β strands move towards to the active sites. Both of the above two motion modes in PR2 tend to make the flaps close. The previous studies proved that one key mutation (I47V) harbors in the flaps and β strands of PR211,53, which may be responsible for the difference in the motion modes of the flaps between PR1 and PR2.
Figure 5. Collective motions corresponding to PC1 obtained by performing principal component analysis on MD simulation trajectory after the equilibrium.
(A) the DRV-PR1 complex, (B) the APV-PR1 complex, (C) the DRV-PR2 complex, (D) the APV-PR2 complex.
Flaps dynamics of PR1 and PR2
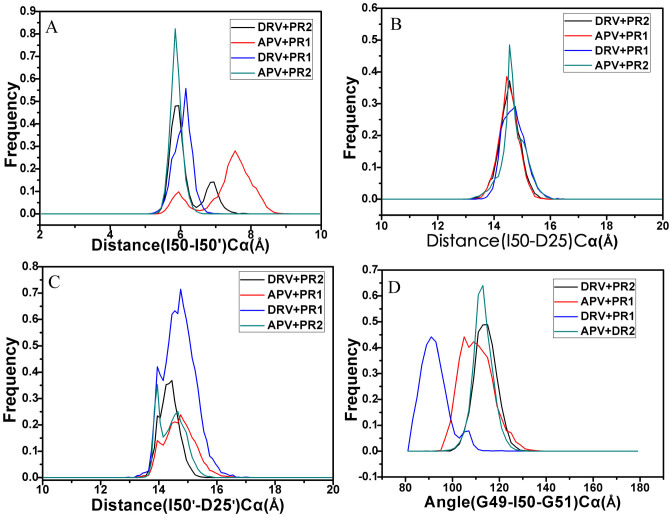
Based on the significant effect of inhibitor binding on the flap regions of PR1/PR2, the flap dynamics are further studied by using the Ptraj module in Amber and the results were displayed in Figure 6. The distance between the two Cα atoms of I50 and I50′ measures the distance between flap tips in both chains. Figure 6A shows the frequency distribution for the tip-tip distance of the flaps. Higher peak values are located in 5.8, 5.9, 6.2 and 7.6 Å for the APV-PR2, DRV-PR2, DRV-PR1 and APV-PR1 complexes, respectively. The tip-tip distances of PR1 are larger than that of PR2, which suggests that there is an open movement of flaps in PR1 compared to PR2 and probably makes the active site volume bigger. This result is in agreement with the previous PC analysis.
Figure 6.
(A) Histogram distribution of Ile50-Ile50′ distance, (B) histogram distribution of Ile50-Asp25 distance, (C) histogram distribution of Ile50′-Asp25′, (D) histogram distribution of Gly49-Ile50-Gly51 TriCα angles.
The distances between the flap tips (I50Cα and I50′Cα) and the catalytic aspartates (D25Cα and D25′Cα) are also measured from the MD trajectory and their frequency distributions are shown in Figure 6B and C. According to Figure 6B, one can see that the higher peak values of four systems are distributed in 14.6, 14.6, 14.7 and 14.4 Å for the APV-PR2, DRV-PR2, DRV-PR1 and APV-PR1 complexes, respectively, which suggests that inhibitor bindings hardly produce obvious effect on the distance between I50Cα and D25Cα. Figure 6C gives the frequency distribution of the distance between I50′Cα and D25′Cα. Higher peak values of the APV-PR2 and DRV-PR2 complexes are located in 13.9 and 14.4 Å, respectively, while the higher peak values of the DRV-PR1 and the APV-PR1 complexes are in 14.7 Å. This result shows that the distance between I50′Cα and D25′Cα in PR2 is lower than that in PR1, which suggests that the active site volume of PR2 become smaller. The study from Meher et al. also proves that the mutation I50V of PR1 results in the decrease of the distance between I50′Cα and D25′Cα21, which basically agrees with our studies here.
To explain the flap dynamics behavior of proteins, Schiffer et al. introduced the term flap curling of the TriCα angles involving the residues in the flap tip or nearby region to study the opened and closed states of PR154. In this work, the TriCα angle of the residues G49-I50-G51 is used to probe the flap curling. Figure 6D depicts the frequency distribution of the TriCα angle (G49-I50-G51). Analyzing this frequency distribution plot, it is found that the distribution of the angle for PR1 and PR2 overlaps partly. However, the PR2 distribution shows a difference compared to PR1. The peak values of the TriCα angle distribution for the APV-PR2 and DRV-PR2 complexes are in 131.1° and 115.5°, respectively, while the ones for the APV-PR1 and DRV-PR1 locate in 105.2° and 91.0°, respectively. This result indicates that the flap region in PR2 has a higher mobility than in PR1, which basically agrees with the previous RMSF and cross-correlation analyses. The reason led to this result may be the conformation change induced by the mutation V47I in PR2.
Analysis of binding free energy
To clarify the origin of decrease in potency of inhibitor bindings to PR2 relative to PR2 from viewpoint of energy, binding free energies were calculated using MM-PBSA method based on 200 snapshots extracted from the last 40 ns of MD trajectory at an interval of 200 ps. Table 1 gives the binding free energies of DRV and APV to PR1/PR2. The corresponding binding free energies are −15.8 and −14.2 kcal·mol−1 for PR1, and −14.6 and −12.5 kcal·mol−1 for PR2, respectively. It is observed that the rank of our predicted binding free energies is in agreement with the experimentally determined one. Also, each inhibitor binds less strongly to PR2 than PR1, again in accordance with the experimental data. The above results suggest that the current energy analysis performed by MM-PBSA method is reliable.
Table 1. Energy analysis for inhibitor-PR1/PR2 binding as obtained by MM-PBSA method.
| aEnergy(kcal·mol−1) | DRV-PR1 | DRV-PR2 | APV-PR1 | APV-PR2 |
|---|---|---|---|---|
| ΔEele | −45.1 ± 0.3 | −38.8 ± 0.2 | −39.5 ± 0.3 | −40.1 ± 0.2 |
| ΔEvdw | −65.9 ± 0.1 | −63.8 ± 0.1 | −63.3 ± 0.1 | −57.6 ± 0.1 |
| ΔGpol | 74.3 ± 0.4 | 68.2 ± 0.5 | 68.6 ± 0.5 | 66.8 ± 0.4 |
| ΔGnopol | −6.9 ± 0.01 | −7.0 ± 0.01 | −6.9 ± 0.01 | −6.8 ± 0.01 |
| bΔGele+pol | 29.2 ± 0.3 | 29.4 ± 0.3 | 27.1 ± 0.3 | 26.7 ± 0.2 |
| −TΔS | 27.8 ± 0.3 | 26.8 ± 0.3 | 26.9 ± 0.2 | 25.2 ± 0.3 |
| cΔGbind | −15.8 | −14.6 | −14.2 | −12.5 |
| dΔGexp | −15.1 | −13.4 | −13.2 | −11.6 |
aErrors in parentheses represent standard errors of mean:
bΔGele+pol = ΔEele + ΔGpol.
cΔGbind = ΔEele + ΔEvdw + ΔGpol + ΔGnopol − TΔS.
dThe experimental values were derived from the experimental ki values in Reference using the equation ΔGexp = −RTlnki.
As seen in Table 1, the contributions favoring inhibitor bindings are those from the van der Waals interaction (ΔEvdw) and nonpolar interaction (ΔGnopol) of inhibitors with PR1/PR2. Although the electrostatic interaction (ΔEele) between inhibitors and PR1/PR2 is also favorable for inhibitor bindings, this favorable force is completely screened by the stronger polar solvation energies (ΔGpol) unfavoring inhibitor bindings. Additionally, the entropy changes (−TΔS) depending on inhibitor associations also weaken the bindings.
According to Table 1, the polar interactions (ΔGele+pol) of two inhibitors with PR2, including the electrostatic interactions and polar solvation energies, hardly change compared to the one of inhibitors with PR1. The nonpolar interactions of inhibitors with PR1/PR2 range from −6.8 to −7.0 kcal·mol−1. Also, Table 1 indicates that the binding free energies of PR2 to DRV and APV are decreased by 2.1 and 5.7 kcal·mol−1 relative to the one of PR1 to DRV and APV, respectively. Furthermore, the entropy changes of PR2 induced by inhibitor bindings are lower than the values for PR1. Thus, the origin of decrease in potency of two inhibitors against PR2 compared to PR1 arises from the decrease in the van der Waals interactions of DRV and APV with PR2. This result basically agrees with the experimental studies from Kovalesky and Tie et al11,53.
Analysis of van der Waals interactions
To further probe the origin of the decrease in van der Waals interactions, the van der Waals interactions between two inhibitors and each residue in PR1/PR2 were calculated by using the following equation in Amber force field:
 |
the parameters Aij and Bij come from the Amber ff99SB force field. Ding et al. have used this equation and quantum mechanics calculation to probe the interaction mechanism of p53 with MDM2 and got impressive results55.
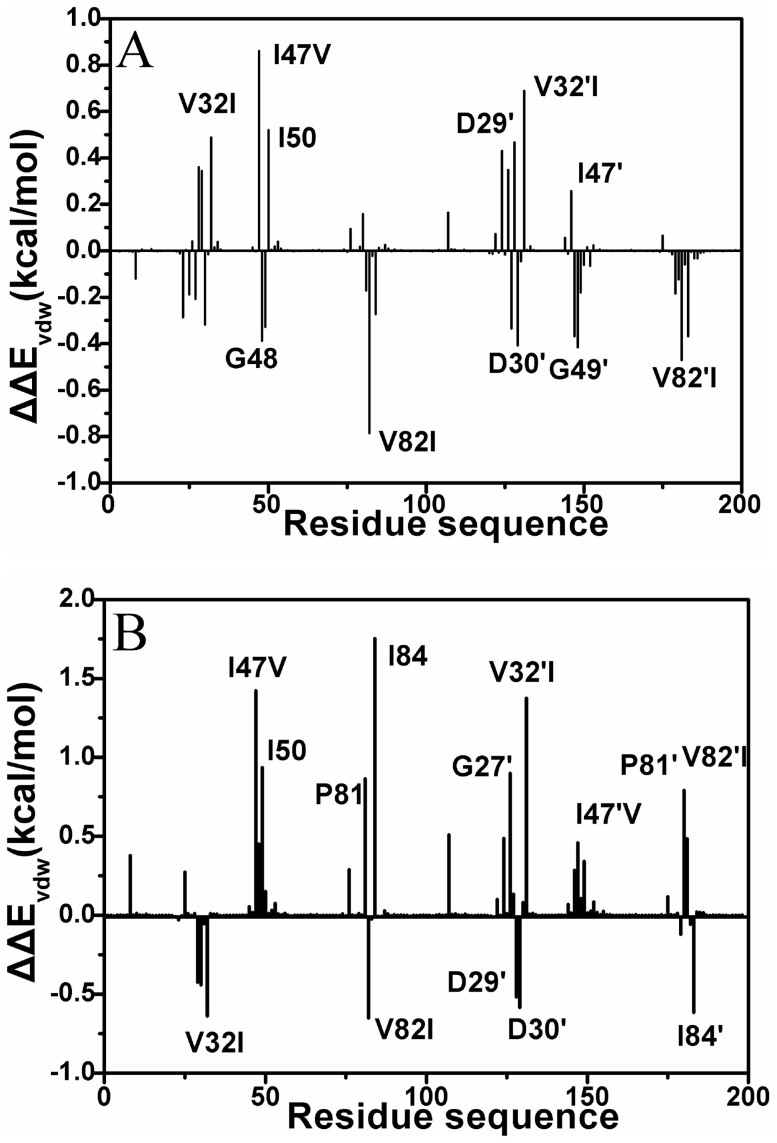
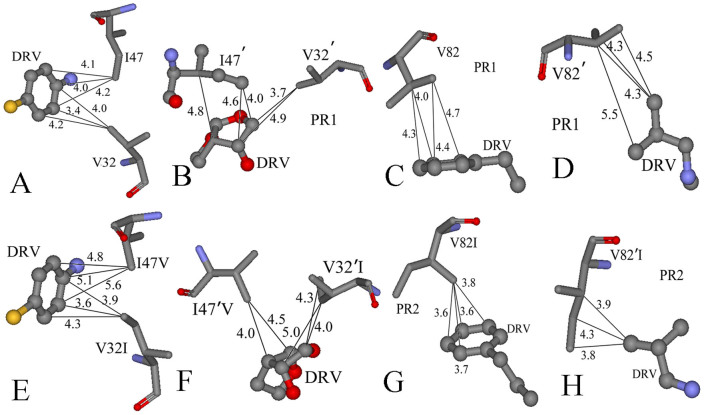
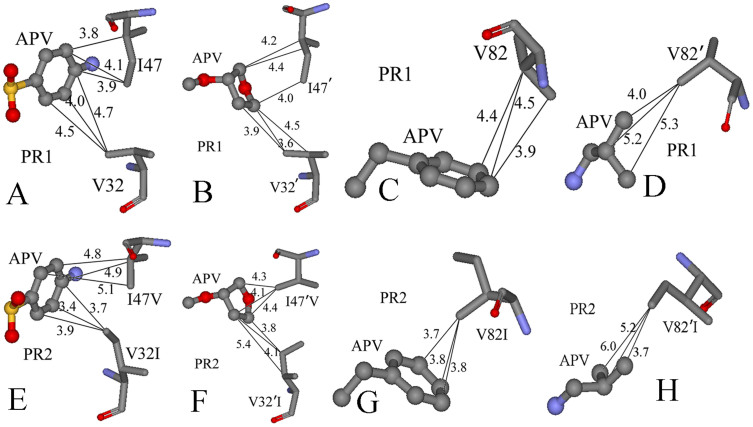
Figure 7 gives the difference between the van der Waals interactions of two inhibitors with each residue in PR2 and in PR1. Figure 8 and 9 depict the geometrical positions of three mutated residues relative to the key hydrophobic groups of two inhibitors based on the lowest-energy structure from MD trajectory. As shown in Figure 7A, the van der Waals interactions of the mutated residues V32I, I47V, V32′I and I47′V in PR2 with DRV are decreased by 0.49, 0.86, 0.69 and 0.26 kcal·mol−1 compared to PR1, respectively. This result agrees well with the structural descriptions in Figure 8A, B, E and F. By comparisons of Figure 8E and F with Figure 8A and B, it is found that the distances of the key carbon atoms between these four mutated residues in PR2 and the aniline and bis-THF of DRV are increased, which in turn weaken the CH-π interactions of the alkyls in four mutated residues with the aniline and bis-THF. Additionally, the van der Waals interactions of the residues I50 and D29′ in PR2 with DRV are also reduced relative to PR1. Figure 7A suggests that the mutation V82I strengthens the van der Walls interaction with DRV, which is in agreement with the shortened distance between the carbon atoms in phenyl of DRV and the alkyl of V82I in PR2 (Figure 8C and G). By comparing Figure 8H to D, one can see that the distances between the carbon atoms of the alkyls in V82′I of PR2 and DRV are reduced, which correspondingly produces an increase of 0.47 kcal·mol−1 in the van der Waals interactions. In addition, the van der Waals interactions of the residues G48, D30′ and G49′ in PR2 with DRV are also strengthened compared to PR1 (Figure 7A).
Figure 7.
(A) Difference between the van der Waals interaction of DRV with each residue in PR2 and in PR1, (B) Difference between the van der Waals interaction of APV with each residue in PR2 and in PR1.
Figure 8. Comparison of PR1 and PR2 interactions with DRV.
The structure is colored by atom type, the groups of DRV are shown in ball and stick mode, and the residues shown in stick mode. (A)–(D) represent the interactions between the hydrophobic groups of DRV and key residues of PR1, (E)–(H) show the interactions between the hydrophobic groups of DRV and key residues of PR2.
Figure 9. Comparison of PR1 and PR2 interactions with APV.
The structure is colored by atom type, the groups of APV are shown in ball and stick mode, and the residues shown in stick mode. (A)–(D) represent the interactions between the hydrophobic groups of APPV and key residues of PR1, (E)–(H) show the interactions between the hydrophobic groups of APV and key residues of PR2.
According to Figure 7B, it is observed that the van der Waals interactions of I47V, V32′I and V82′I in PR2 with APV are decreased by 1.42, 1.37 and 0.49 kcal·mol−1 relative to PR1, respectively. This result agrees well with the increase in the distances of the carbon atoms between the alkyls of I47V, V32′I and V82′I in PR2 and the hydrophobic groups in APV (Figure 9). At the same time, the van der Waals interactions of the residues I50, P81, I83, G27′ and P81′ in PR2 with APV are also weakened relative to PR1 (Figure 7B). As shown from Figure 7B, the residues involving the increase of the van der Waals interaction in PR2 are V32I, V82I, D29′, D30′ and I84′ compared to PR1. By comparing Figure 9E and G to Figure 9A and C, it is found that the distance of the carbon atoms between the alkyls of V32I and V82I in PR2 and the hydrophobic groups (the aniline and Phenyl) of APV are obviously shortened, which correspondingly strengthens the van der Waals interactions of V32I and V82I with APV. The above studies are in accordance with the experimental results from Kovalevsky and Tie et al.11,53.
Hydrogen bonding interactions
In order to further investigate the effect of three mutated residues on the interaction net near them, hydrogen bonding (HB) interactions are analyzed by using the Ptraj module in Amber and the results are listed in Table 2 and 3. Table 2 lists the inter-residue hydrogen bonds (only chain A) and Table 3 gives the hydrogen binding interactions between inhibitors and residues. According to Table 2, the mutated proteases (PR2) present less frequent HB interactions between residues. It is also observed that the hydrogen bond interactions located in the flaps are mostly affected due to the mutation. This result indicates that the mobility of the flap tips in PR1/PR2 is significantly affected via the changes of interflap hydrogen bonds. As seen from the occupancy in Table 2, those interactions in PR2 are highly reduced upon mutations relative to PR1 with an exception of the hydrogen bond Gly49′N-H…Ile50O. The previous RMSF and cross-correlation analyses prove that these hydrogen bonding interaction play an important role in the changes of structural flexibility and motion modes.
Table 2. Main hydrogen bond interactions involving three mutations in PR1/PR2.
| Hydrogen bondsa | occupancyb | |||
|---|---|---|---|---|
| Acceptor…donor | DRV + PR1 | DRV + PR2 | APV + PR1 | APV + PR2 |
| Leu23N-H…Asn83O | 99.9 | 92.1 | 99.6 | 92.3 |
| Glu34N-H…Asn83OD1 | 99.7 | 90.4 | 99.9 | 90.6 |
| Gly86N-H…Thr31OG1 | 90.9 | 0 | 92.8 | 72.5 |
| Thr31N-H…Asn88OD1 | 84.9 | 13.5 | 87.2 | 41.3 |
| Gly52N-H…Gly49O | 84.5 | 16.3 | 86.8 | 35.7 |
| Gly52N-H…Ile50O | 82.1 | 24.4 | 73.4 | 25.1 |
| Gly49′N-H…Ile50O | 21.5 | 68.6 | 19.6 | 45.7 |
aThe hydrogen bonds are determined by the acceptor…donor distance of <3.5 Å and acceptor…H-donor angle of >120°.
bOccupancy is defined as the percentage of simulation time that a specific hydrogen bond exists, the hydrogen bonds occurring less than 10% of the simulation are not shown.
Table 3. Main hydrogen bond interactions between inhibitors and PR1/PR2.
| Hydrogen bonds | Occupancy | |||
|---|---|---|---|---|
| PR1/PR2 residuesa | DRV + PR1 | DRV + PR2 | APV + PR1 | APV + PR2 |
| Asp25OD2 | 100 | 27.2 | 99.3 | 90.6 |
| Asp25OD1 | 0 | 63.3 | 43.2 | 30.7 |
| Asp30′N-H | 90.6 | 22.4 | 73.4 | 60.3 |
| Asp25OD2-HD2 | 0 | 0 | 93 | 90 |
| Asp30′O | 89.3 | 58.6 | 41.2 | 45.6 |
| Asp29N-H | 84.2 | 15.7 | 43.6 | 31.4 |
| Gly27′O | 0 | 0 | 40.5 | 32.3 |
aThe residues formed hydrogen bonds with inhibitors are listed.
The HB analysis between two inhibitors and binding-cavity residues of PR1/PR2 (Table 3) reveals that multiple hydrogen bonds stabilize the inhibitor-PR structure. In particular, both DRV and APV are involved in several HBs with the PR's catalytic site, mostly with residues D25, D29 and D30′. Another hydrogen bonding interaction with the backbone G27′ appears in the APV-PR1/PR2 complexes. In general, it is noticed that the occupancy of HB interactions are diminished upon mutations in PR2 with two exceptions of the hydrogen bonds Asp25OD1(PR2)-inhibitor and Asp30′O(PR2)-inhibitor. These results reflect that the conformation changes induced by mutations in PR2 may result in the alternation of HB interactions. Mutations that confer major resistance in PR1, such as G48V, L63P and I84V weaken or do not present these interactions46, which basically agrees with our studies here.
Discussion
Table 1 shows that DRV and APV can produce weaker binding free energies to PR2 than to PR1. By comparing the components of binding free energies, it is observed that the reduction of the van der Waal interactions between inhibitors and PR2 provides a significant contribution to the decrease in potency of DRV and APV against PR2 compared to PR1.
The previous studies suggest that the wild-type PR2 sequence harbors multiple substitutions such as V32I, I47V and V82I11,56. Structurally, the mutations V32I and V82I increase the size of these two residues, and the mutation I47V decrease that of this mutated residue. The changes in the size of residues certainly induce the alternation of conformations and interaction nets near mutated residues (Figure 7,8,9). For the DRV-PR1 and DRV-PR2 complexes, the mutations V32I, I47V, V32′I and I47′V in PR2 not only weaken their van der Waals interactions with DRV relative to PR1, but also induce the decrease in the van der Waals interactions of I50 and D29′ in PR2 with DRV. Similarly, in the case of the APV-PR1 and APV-PR2 complexes, the mutations I47V, V32′I and V82′I in PR2 result in the decrease of their van der Walls interactions with APV compared to PR1, moreover induce the reduction in the van der Waals interactions of the residues I50, P81, I83, G27′ and P81′ in PR2 with APV. Overall, the structural adjustment of the triple mutant induce the total decrease of the van der Waals interactions, which provides significant contributions to the reduction in binding free energies and is responsible for the decrease in potency of DRV and APV against PR2 relative to PR1.
The structural changes caused by the three mutations certainly produce important effect on the hydrogen bonding interaction near them. Table 2 and 3 show that the triple mutant lead to the decrease in occupancy of most hydrogen bonds. Overall, the changes of the above van der Waals and hydrogen bonding interactions certainly affect the internal dynamics of PR1 and PR2. This result has been proved by our previous RMSF, cross-correlation and PC analyses.
In conclusion, the structural adjustment of the three mutated residues induces the decrease in the van der Waals interactions and occupancy of most hydrogen bonds. Moreover, the decrease in the van der Waals interactions drives the reductions in potency of DRV and APV against PR2 relative to PR1. The changes of interaction nets caused by the mutations strengthen the anticorrelated motions of mutated regions relative to the other parts in PR2 compared to PR1. Additionally, PC analysis suggests that inhibitor bindings tend to make the flaps of PR2 close, while let the flaps of PR1 open. This study can theoretically provide significant guidance and dynamics information for the design of potent dual inhibitors targeting HIV-1 and HIV-2 proteases.
Methods
System setups
The crystal structures of the PR1/PR2 complexed with two inhibitors DRV and APV were obtained from the protein data bank (PDB): 3QOZ for the DRV-PR1 complex11, 3EBZ for the DRV-PR2 complex11, 3NU3 for the APV-PR1 complex53 and 3S45 for the APV-PR2 complex53. There are alternate conformations in four crystal structures: conformation A and B, owing to the inconspicuous electron density of few residues in the inhibitor-PR1/PR2 complex, only the conformation A was selected as the initial model. Because of the importance of the protonation of D25/D25′ in the PR1/PR2, the monoprotonated state was assigned to the oxygen atom OD2 of Asp25′ in chain B using the program PROPKA57,58. All crystal water molecules in the crystal structure of the inhibitor-PR complex were kept in the initial model. All missing hydrogen atoms were added using the Leap module in Amber 1259. The proteins and water molecules were described by ff99SB force field60. The inhibitors were assigned generalized amber force field (GAFF) atom types61 and AM1-BCC62 atomic charges calculated using the antechamber module of Amber63. The AM1-BCC charge for atom was obtained by adding the bond charge correction (BCC) to a semiempirical quantum calculation of the molecular electron structure according to the Austin model 1 (AM1) population atomic charge64. Each system was solvated in a truncated octahedron box of TIP3P water molecules with a 12.0 Å buffer along each dimension65. An appropriate number of chloride ions were added to produce a neutral charge on the system.
Molecular dynamics simulations
For each system, energy minimizations and MD simulations were carried out using the Sander module in Amber12 program. To remove bad contacts between atoms, each system was subject to energy minimizations in two stages. Firstly, the water molecules and counterions were minimized by restraining the complex using a harmonic constraint of a strength of 100 kcal·mol−1·Å−2. Secondly, all atoms were energy-minimized without restriction. And each stage was performed using the steepest descent minimization of 1000 steps followed by a conjugate gradient minimization of 2000 steps. Then, the system was heated from 0 to 300 K in 500 ps and equilibrated at 300 K for another 500 ps. Finally, 80-ns MD simulation without restriction was conducted at constant pressure and 300 K, and the coordinates were saved every 2 ps. During MD simulations, the SHAKE method was applied to constraint the covalent bonds involving hydrogen atom66. The Particle Mesh Ewald (PME) method was adopted to treat the long-range electrostatic interactions67,68. The cutoff distances for the long-range electrostatic and van der Waals interactions were set to 10.0 Å.
Principal component analysis
PC analysis is an important tool for probing conformation change of proteins. In this paper, the Ptraj module69 of the Amber software tool was used for PC analysis. Correlated motions were studied by the cross-correlation calculations based on dynamics trajectory, and the cross-correlation coefficient cij for each pair of Cα atoms i and j were obtained by the following equation.
 |
where Δri is the displacement from the mean position of the ith atom, and the angle bracket represents the time average over the equilibrated trajectory. Furthermore, the collective motions of PR1/PR2 were also studied by using the positional covariance matrix C constructed based on atomic coordinates and its eigenvectors70. The elements of the positional covariance matrix C were determined by the equation as following.
 |
in which qi is the Cartesian coordinate of the ith Cα atom, and N is the number of Cα atom considered. The average is calculated over the equilibrated trajectory after superimposition on a reference structure to remove overall translations and rotations by using a least-square fit procedure71,72,73. The matrix C is symmetric and can be diagonalized by an orthogonal coordinate transformation matrix T, which transforms the matrix C into a diagonal matrix Λ of eigenvalues λi:
 |
in which the columns represent the eigenvectors corresponding to the direction of motion relative to <qi>, and each eigenvector associated with an eigenvalue that describes the total mean-square fluctuation of the system along the corresponding eigenvector.
MM-PBSA method
Binding free energies of inhibitors to PR1/PR2 were calculated using MM-PBSA program in Amber 1251,52,74. For each complex, 200 snapshots were taken from the last 40 ns of MD trajectory with an interval of 200 ps. In this method, the binding free energy (ΔG) can be represented as:
 |
where ΔEele and ΔEvdw are the contributions from the electrostatic and van der Waals interactions in gas phase, respectively, which are calculated by using molecular mechanics. The term ΔGpol represents the polar solvation free energy, and computed by using the mm-pbsa program in Amber. The term ΔGnonpol is the non-polar solvation energy, and can be obtained by using the experiential equation ΔGnonpol = γ × (SAS) + β, in which the values of γ and β were set to 0.00542 kcal·mol−1·Å−2 and 0.92 kcal·mol−1, respectively50. The contribution of entropy (−TΔS) to the binding free energy arises from changes in the translational, rotational and vibrational degrees of freedom, and calculated by using classical statistical thermodynamics and normal-mode analysis75.
Author Contributions
J.C. and Q.Z. wrote the manuscript, J.C., Z.L., W.W. and C.Y. carried out molecular dynamics simulations, J.C. and S.Z. analyzed data, J.C. and Q.Z. designed the experiments, and all authors reviewed the manuscript.
Acknowledgments
This work is supported by the National Natural Science Foundation of China (11104164 and 11274206), Shandong province university science and technology project (J14LJ07), and Dr. Start-up Foundation of Shandong Jiaotong University.
References
- UNAIDS. AIDS epidemic update: December 2009: WHO Regional Office Europe. [Google Scholar]
- Bock P. J. & Markovitz D. M. Infection with HIV-2. AIDS 15, S35–S45 (2001). [DOI] [PubMed] [Google Scholar]
- Kanki P. & De Cock K. Epidemiology and natural history of HIV-2. AIDS 8, S85–S85 (1994). [Google Scholar]
- Humphrey J. et al. HIV-1 and HIV-2 prevalence and associated risk factors among postnatal women in Harare, Zimbabwe. Epidemiol. Infect. 135, 933–942 (2007). [DOI] [PMC free article] [PubMed] [Google Scholar]
- Soriano V. et al. Human immunodeficiency virus type 2 (HIV-2) in Portugal: Clinical spectrum, circulating subtypes, virus isolation, and plasma viral load. J. Med. Virol. 61, 111–116 (2000). [PubMed] [Google Scholar]
- Barin F. et al. Prevalence of HIV-2 and HIV-1 group O infections among new HIV diagnoses in France: 2003–2006. AIDS 21, 2351–2353 (2007). [DOI] [PubMed] [Google Scholar]
- Sarr A. D. et al. Genetic analysis of HIV type 2 in monotypic and dual HIV infections. AIDSV Res. Hum. Retroviruses 16, 295–298 (2000). [DOI] [PubMed] [Google Scholar]
- Gustchina A. & Weber I. T. Comparative analysis of the sequences and structures of HIV-1 and HIV-2 proteases. Proteins 10, 325–339 (1991). [DOI] [PubMed] [Google Scholar]
- Menéndez-Arias L. & Tözsér J. HIV-1 protease inhibitors: effects on HIV-2 replication and resistance. Trends Pharmacol. Sci. 29, 42–49 (2008). [DOI] [PubMed] [Google Scholar]
- Chen Z. et al. Crystal structure at 1.9-A resolution of human immunodeficiency virus (HIV) II protease complexed with L-735, 524, an orally bioavailable inhibitor of the HIV proteases. J. Biol. Chem. 269, 26344–26348 (1994). [PubMed] [Google Scholar]
- Kovalevsky A. Y., Louis J. M., Aniana A., Ghosh A. K. & Weber I. T. Structural evidence for effectiveness of darunavir and two related antiviral inhibitors against HIV-2 protease. J. Mol. Biol. 384, 178–192 (2008). [DOI] [PMC free article] [PubMed] [Google Scholar]
- Huang Y. m. M., Kang M. & Chang C. e. A. Switches of hydrogen bonds during ligand–protein association processes determine binding kinetics. J. Mol. Recognit. 27, 537–548 (2014). [DOI] [PMC free article] [PubMed] [Google Scholar]
- Desbois D. et al. In vitro phenotypic susceptibility of human immunodeficiency virus type 2 clinical isolates to protease inhibitors. Antimicrob Agents Chemother 52, 1545–1548 (2008). [DOI] [PMC free article] [PubMed] [Google Scholar]
- Smith N. et al. Antiretroviral therapy for HIV-2 infected patients. J. Infect. 42, 126–133 (2001). [DOI] [PubMed] [Google Scholar]
- Rodés B. et al. Emergence of drug resistance mutations in human immunodeficiency virus type 2-infected subjects undergoing antiretroviral therapy. J. Clin. Microbiol. 38, 1370–1374 (2000). [DOI] [PMC free article] [PubMed] [Google Scholar]
- Damond F. et al. Polymorphism of the human immunodeficiency virus type 2 (HIV-2) protease gene and selection of drug resistance mutations in HIV-2-infected patients treated with protease inhibitors. J. Clin. Microbiol. 43, 484–487 (2005). [DOI] [PMC free article] [PubMed] [Google Scholar]
- Rodés B. et al. Susceptibility to protease inhibitors in HIV-2 primary isolates from patients failing antiretroviral therapy. J. Antimicrob. Chemother. 57, 709–713 (2006). [DOI] [PubMed] [Google Scholar]
- Ntemgwa M., Brenner B. G., Oliveira M., Moisi D. & Wainberg M. A. Natural polymorphisms in the human immunodeficiency virus type 2 protease can accelerate time to development of resistance to protease inhibitors. Antimicrob. Agents Chemother. 51, 604–610 (2007). [DOI] [PMC free article] [PubMed] [Google Scholar]
- Johnson V. A. et al. Update of the drug resistance mutations in HIV-1: Fall 2006. Top HIV. Med. 14, 125–130 (2006). [PubMed] [Google Scholar]
- Hou T., McLaughlin W. A. & Wang W. Evaluating the potency of HIV-1 protease drugs to combat resistance. Proteins 71, 1163–1174 (2007). [DOI] [PMC free article] [PubMed] [Google Scholar]
- Meher B. R. & Wang Y. Interaction of I50V mutant and I50L/A71V double mutant HIV-protease with inhibitor TMC114 (Darunavir): molecular dynamics simulation and binding free energy studies. J. Phys. Chem. B. 116, 1884–1900 (2012). [DOI] [PMC free article] [PubMed] [Google Scholar]
- Hou T. & Yu R. Molecular dynamics and free energy studies on the wild-type and double mutant HIV-1 protease complexed with amprenavir and two amprenavir-related inhibitors: mechanism for binding and drug resistance. J. Med. Chem. 50, 1177–1188 (2007). [DOI] [PubMed] [Google Scholar]
- Hu G.-D., Zhu T., Zhang S.-L., Wang D. & Zhang Q.-G. Some insights into mechanism for binding and drug resistance of wild type and I50V V82A and I84V mutations in HIV-1 protease with GRL-98065 inhibitor from molecular dynamic simulations. Eur. J. Med. Chem. 45, 227–235 (2010). [DOI] [PubMed] [Google Scholar]
- Kar P. & Knecht V. Energetic basis for drug resistance of HIV-1 protease mutants against amprenavir. J. Comput. Aided. Mol. Des. 26, 215–232 (2012). [DOI] [PubMed] [Google Scholar]
- Tie Y. et al. Critical differences in HIV-1 and HIV-2 protease specificity for clinical inhibitors. Protein Sci. 21, 339–350 (2012). [DOI] [PMC free article] [PubMed] [Google Scholar]
- Kar P. & Knecht V. Origin of decrease in potency of darunavir and two related antiviral inhibitors against HIV-2 compared to HIV-1 protease. J. Phys. Chem. B. 116, 2605–2614 (2012). [DOI] [PubMed] [Google Scholar]
- Brower E. T., Bacha U. M., Kawasaki Y. & Freire E. Inhibition of HIV-2 protease by HIV-1 protease inhibitors in clinical use. Chem. Biol. Drug Des. 71, 298–305 (2008). [DOI] [PubMed] [Google Scholar]
- Ghosh A. K., Chapsal B. D., Weber I. T. & Mitsuya H. Design of HIV protease inhibitors targeting protein backbone: an effective strategy for combating drug resistance. Acc. Chem. Res. 41, 78–86 (2007). [DOI] [PubMed] [Google Scholar]
- Ghosh A. K., Dawson Z. L. & Mitsuya H. Darunavir, a conceptually new HIV-1 protease inhibitor for the treatment of drug-resistant HIV. Bioorg. Med. Chem. 15, 7576–7580 (2007). [DOI] [PMC free article] [PubMed] [Google Scholar]
- Wu E. L., Han K. L. & Zhang J. Z. H. Selectivity of neutral/weakly basic P1 group inhibitors of thrombin and trypsin by a molecular dynamics study. Chemistry - A European Journal 14, 8704–8714 (2008). [DOI] [PubMed] [Google Scholar]
- Chen J., Wang J., Zhu W. & Li G. A computational analysis of binding modes and conformation changes of MDM2 induced by p53 and inhibitor bindings. J. Comput. Aided Mol. Des. 27, 965–974 (2013). [DOI] [PubMed] [Google Scholar]
- Xu Y. & Wang R. A computational analysis of the binding affinities of FKBP12 inhibitors using the MM PB/SA method. Proteins 64, 1058–1068 (2006). [DOI] [PubMed] [Google Scholar]
- Gao Y., Lu X., Duan L. L., Zhang J. Z. & Mei Y. Polarization of intraprotein hydrogen bond is critical to thermal stability of short helix. J. Phys. Chem. B 116, 549–554 (2011). [DOI] [PubMed] [Google Scholar]
- Zhu T., Zhang J. Z. & He X. Automated Fragmentation QM/MM Calculation of Amide Proton Chemical Shifts in Proteins with Explicit Solvent Model. J. Chem. Theo. Comput. 9, 2104–2114 (2013). [DOI] [PubMed] [Google Scholar]
- Hu G. & Wang J. Ligand selectivity of estrogen receptors by a molecular dynamics study. Eur. J. Med. Chem. 74, 726–735 (2014). [DOI] [PubMed] [Google Scholar]
- Duan L. L., Mei Y., Zhang D., Zhang Q. G. & Zhang J. Z. Folding of a helix at room temperature is critically aided by electrostatic polarization of intraprotein hydrogen bonds. J. AM. Chem. Soc. 132, 11159–11164 (2010). [DOI] [PubMed] [Google Scholar]
- Liu M., Wang L., Sun X. & Zhao X. Investigating the Impact of Asp181 Point Mutations on Interactions between PTP1B and Phosphotyrosine Substrate. Sci. Rep. 4, 5095 5010.1038/srep05095 (2014). [DOI] [PMC free article] [PubMed] [Google Scholar]
- Zhu T., Xiao X., Ji C. & Zhang J. Z. A New Quantum Calibrated Force Field for Zinc–Protein Complex. J. Chem. Theo. Comput. 9, 1788–1798 (2013). [DOI] [PubMed] [Google Scholar]
- Tong C., Lin X., Yang Y. & Hou Z. L (2, 1)-labeling of flower snark and related graphs. Ars Combinatoria 110, 505–512 (2013). [Google Scholar]
- Zhang Q., Xu Z., Liang J., Pei J. & Sun H. Structural and magnetic properties of Sr2FeMoO6 film prepared by electrophoresis technique. J. Magn. Magn. Mater. 354, 231–234 (2014). [Google Scholar]
- Zhang Q. et al. Eu doping effects on structural and magnetic properties of (Sr2−xEux) FeMoO6 compounds. J. Solid State Chem. 183, 2432–2437 (2010). [Google Scholar]
- Tong C., Lin X., Yang Y. & Hou Z. (d, 1)-Total labellings of regular nonbipartite graphs and an application to flower snarks. Ars Combinatoria 96, 33–40 (2010). [Google Scholar]
- Duan L. L., Mei Y., Zhang Q. G. & Zhang J. Z. Intra-protein hydrogen bonding is dynamically stabilized by electronic polarization. J. Chem. Phys. 130, 115102 (2009). [DOI] [PubMed] [Google Scholar]
- Leonis G., Steinbrecher T. & Papadopoulos M. G. A contribution to the drug resistance mechanism of Darunavir, Amprenavir, Indinavir, and Saquinavir complexes with HIV-1 protease due to flap mutation I50V: A systematic MM–PBSA and thermodynamic integration study. J. Chem. Inf. Model. 53, 2141–2153 (2013). [DOI] [PubMed] [Google Scholar]
- Genheden S., Nilsson I. & Ryde U. Binding affinities of factor Xa inhibitors estimated by thermodynamic integration and MM/GBSA. J. Chem. Inf. Model. 51, 947–958 (2011). [DOI] [PubMed] [Google Scholar]
- Tzoupis H., Leonis G., Mavromoustakos T. & Papadopoulos M. G. A comparative molecular dynamics, MM–PBSA and thermodynamic integration study of saquinavir complexes with wild-type HIV-1 PR and L10I, G48V, L63P, A71V, G73S, V82A and I84V single mutants. J. Chem. Theo. Comput. 9, 1754–1764 (2013). [DOI] [PubMed] [Google Scholar]
- Zhu T., He X. & Zhang J. Z. Fragment density functional theory calculation of NMR chemical shifts for proteins with implicit solvation. Phys. Chem. Chem. Phys. 14, 7837–7845 (2012). [DOI] [PubMed] [Google Scholar]
- Wang J. et al. Exploring Transition Pathway and Free-Energy Profile of Large-Scale Protein Conformational Change by Combining Normal Mode Analysis and Umbrella Sampling Molecular Dynamics. J. Phys. Chem. B 118, 134–143 (2013). [DOI] [PubMed] [Google Scholar]
- Wang J. et al. Molecular Dynamics Simulations on the Mechanism of Transporting Methylamine and Ammonia by Ammonium Transporter AmtB. J. Phys. Chem. B. 114, 15172–15179 (2010). [DOI] [PubMed] [Google Scholar]
- Gohlke H., Kiel C. & Case D. A. Insights into protein-protein binding by binding free energy calculation and free energy decomposition for the Ras-Raf and Ras-RalGDS complexes. J. Mol. Biol. 330, 891–913 (2003). [DOI] [PubMed] [Google Scholar]
- Wang W. et al. An analysis of the interactions between the Sem-5 SH3 domain and its ligands using molecular dynamics, free energy calculations, and sequence analysis. J. Am. Chem. Soc. 123, 3986–3994 (2001). [DOI] [PubMed] [Google Scholar]
- Wang J., Morin P., Wang W. & Kollman P. A. Use of MM-PBSA in reproducing the binding free energies to HIV-1 RT of TIBO derivatives and predicting the binding mode to HIV-1 RT of efavirenz by docking and MM-PBSA. J. Am. Chem. Soc. 123, 5221–5230 (2001). [DOI] [PubMed] [Google Scholar]
- Tie Y. et al. Critical differences in HIV-1 and HIV-2 protease specificity for clinical inhibitors. Protein Science 21, 339–350 (2012). [DOI] [PMC free article] [PubMed] [Google Scholar]
- Scott W. R. & Schiffer C. A. Curling of flap tips in HIV-1 protease as a mechanism for substrate entry and tolerance of drug resistance. Structure 8, 1259–1265 (2000). [DOI] [PubMed] [Google Scholar]
- Ding Y., Mei Y. & Zhang J. Z. H. Quantum Mechanical Studies of Residue-Specific Hydrophobic Interactions in p53- MDM2 Binding. J. Phys. Chem. B. 112, 11396–11401 (2008). [DOI] [PubMed] [Google Scholar]
- Pieniazek D. et al. HIV-2 protease sequences of subtypes A and B harbor multiple mutations associated with protease inhibitor resistance in HIV-1. Aids 18, 495–502 (2004). [DOI] [PubMed] [Google Scholar]
- Li H., Robertson A. D. & Jensen J. H. Very fast empirical prediction and rationalization of protein pKa values. Proteins 61, 704–721 (2005). [DOI] [PubMed] [Google Scholar]
- Bas D. C., Rogers D. M. & Jensen J. H. Very fast prediction and rationalization of pKa values for protein–ligand complexes. Proteins 73, 765–783 (2008). [DOI] [PubMed] [Google Scholar]
- Salomon-Ferrer R., Case D. A. & Walker R. C. An overview of the Amber biomolecular simulation package. WIREs. Comput. Mol. Sci. 3, 198–210 (2013). [Google Scholar]
- Hornak V. et al. Comparison of multiple Amber force fields and development of improved protein backbone parameters. Proteins 65, 712–725 (2006). [DOI] [PMC free article] [PubMed] [Google Scholar]
- Wang J., Wolf R. M., Caldwell J. W., Kollman P. A. & Case D. A. Development and testing of a general amber force field. J. Comput. Chem. 25, 1157–1174 (2004). [DOI] [PubMed] [Google Scholar]
- Jakalian A., Jack D. B. & Bayly C. I. Fast, efficient generation of high-quality atomic charges. AM1-BCC model: II. Parameterization and validation. J. Comput. Chem. 23, 1623–1641 (2002). [DOI] [PubMed] [Google Scholar]
- Wang J., Wang W., Kollman P. A. & Case D. A. Automatic atom type and bond type perception in molecular mechanical calculations. J. Mol. Graph. Model. 25, 247–260 (2006). [DOI] [PubMed] [Google Scholar]
- Dewar M. J., Zoebisch E. G., Healy E. F. & Stewart J. J. Development and use of quantum mechanical molecular models. 76. AM1: a new general purpose quantum mechanical molecular model. J. Am. Chem. Soc. 107, 3902–3909 (1985). [Google Scholar]
- Jorgensen W. L., Chandrasekhar J., Madura J. D., Impey R. W. & Klein M. L. Comparison of simple potential functions for simulating liquid water. J. Chem. Phys. 79, 926–930 (1983). [Google Scholar]
- Coleman T. G., Mesick H. C. & Darby R. L. Numerical integration. Ann. Biomed. Eng. 5, 322–328 (1977). [DOI] [PubMed] [Google Scholar]
- Darden T., York D. & Pedersen L. Particle mesh Ewald: An N log (N) method for Ewald sums in large systems. J. Chem. Phys. 98, 10089–10092 (1993). [Google Scholar]
- Essmann U. et al. A smooth particle mesh Ewald method. J. Chem. Phys. 103, 8577–8593 (1995). [Google Scholar]
- Case D. A. et al. The Amber biomolecular simulation programs. J. Comp. Chem. 26, 1668–1688 (2005). [DOI] [PMC free article] [PubMed] [Google Scholar]
- Levy R., Srinivasan A., Olson W. & McCammon J. Quasi-harmonic method for studying very low frequency modes in proteins. Biopolymers 23, 1099–1112 (2004). [DOI] [PubMed] [Google Scholar]
- Laberge M. & Yonetani T. Molecular dynamics simulations of hemoglobin A in different states and bound to DPG: effector-linked perturbation of tertiary conformations and HbA concerted dynamics. Biophys. J. 94, 2737–2751 (2008). [DOI] [PMC free article] [PubMed] [Google Scholar]
- Ichiye T. & Karplus M. Collective motions in proteins: a covariance analysis of atomic fluctuations in molecular dynamics and normal mode simulations. Proteins 11, 205–217 (1991). [DOI] [PubMed] [Google Scholar]
- Chen J., Wang J. & Zhu W. Binding Modes of Three Inhibitors 8CA, F8A and I4A to A-FABP Studied Based on Molecular Dynamics Simulation. PloS one 9, e99862. 99810.91371/journal.pone.0099862 (2014). [DOI] [PMC free article] [PubMed] [Google Scholar]
- Wang W. & Kollman P. A. Free energy calculations on dimer stability of the HIV protease using molecular dynamics and a continuum solvent model1. J. Mol. Biol. 303, 567–582 (2000). [DOI] [PubMed] [Google Scholar]
- Xu B., Shen H., Zhu X. & Li G. Fast and accurate computation schemes for evaluating vibrational entropy of proteins. J. Comput. Chem. 32, 3188–3193 (2011). [DOI] [PubMed] [Google Scholar]


