Abstract
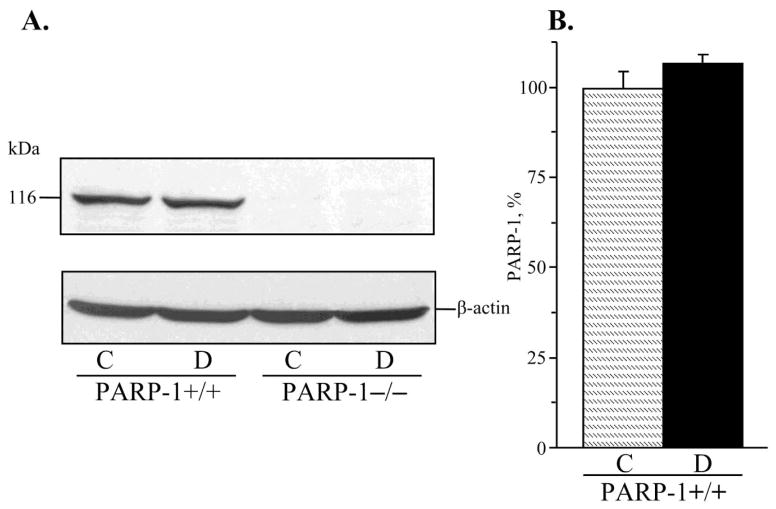
Poly(ADP-ribose)polymerase (PARP) inhibitors prevent or alleviate diabetic nephropathy. This study evaluated the role for PARP-1 in diabetic kidney disease using the PARP-1-deficient mouse. PARP-1−/− and the wild-type (129S1/SvImJ) mice were made diabetic with streptozotocin, and were maintained for 12 weeks. Final blood glucose concentrations were increased ~3.7-fold in both diabetic groups. PARP-1 protein expression (Western blot analysis) in the renal cortex was similar in non-diabetic and diabetic wild-type mice (100% and 107%) whereas all knockouts were PARP-1-negative. PARP-1 gene deficiency reduced urinary albumin (ELISA) and protein excretion, prevented diabetes-induced kidney hypertrophy, and decreased mesangial expansion and collagen deposition (both assessed by histochemistry) as well as fibronectin expression. Renal podocyte loss (immunohistochemistry) and nitrotyrosine and transforming growth factor-β1 accumulations (both by ELISA) were slightly lower in diabetic PARP-1−/− mice, but the differences with diabetic wild-type group did not achieve statistical significance. In conclusion, PARP-1−/− gene deficiency alleviates although does not completely prevent diabetic kidney disease.
Keywords: Albuminuria, collagen, diabetic nephropathy, mesangial expansion, poly(ADP-ribose) polymerase-1, poly(ADP-ribose)polymerase-1 deficient mouse, renal podocyte
1. INTRODUCTION
Diabetic nephropathy is one of the most severe complications of diabetes mellitus which develops in 30% to 40% of patients with both Type 1 and Type 2 diabetes mellitus [1,2], and is responsible for at least ~35% of all new cases of end-stage renal disease in the United States [3]. Despite a significant breakthrough in prevention and treatment of diabetic kidney disease in the last decade, due to development of angiotensin-converting enzyme inhibitors and angiotensin receptor blockers, there is still a vital need to discover and target novel pathophysiologic pathways. Recent studies in animal models identified NAD(P)H-oxidase [4], 12/15-lipoxygenase [5], AMP-activated protein kinase [6], fatty acid imbalances [7], and a number of other compelling drug targets for prevention and treatment of diabetic nephropathy.
Poly(ADP-ribose) polymerase-1 (PARP-1) a highly conserved protein of 116 kDa, catalyzes the cleavage of NAD+ into nicotinamide and ADP-ribose [8]. PARP-1 belongs to a 18 member superfamily of PARP enzymes synthesizing poly(ADP-ribose) polymer which covalently attaches to acceptor proteins i.e., histones, DNA repair enzymes, transcription factors and PARPs themselves [8,9]. PARP-1 has been localized in cell nucleus [8] and mitochondria [10], whereas poly(ADP-ribosyl)ated proteins can also be found in other cell compartments because poly(ADP-ribosyl)ation occurs during protein (e.g., glyceraldehyde 3-phosphate dehydrogenase [11]) trafficking through the nucleus. PARP-1 activation is triggered by reactive oxygen and nitrogen-induced DNA single-strand breakage [8,9,12,13], and by several other factors [14,15], and affects multiple metabolic pathways, transcriptional regulation, and gene expression [8,9,16]. The list of PARP-1-regulated genes includes interleukin (IL)-6, IL-1β, intercellular adhesion molecule-1, vesicular adhesion molecule-1, c-myc, P- and E-selectins, granulocyte-macrophage colony-stimulating factor, NF-κB1, NF-κB2, c-rel, Ikk-α, Ikk-β, Ikk-γ, Ikk-i, I-κBα, inducible nitric oxide synthase, interferon regulatory factor 1, interferon-β, MIF, Gro-1, IL-1α, IL-2, IL-4, IL-5, IL-10, IL-12A, IL-12B, IL-16, IL-17, IL-18, LT-β, transforming growth factor (TGF)-α, TGF-β1, TGF-β2, TGF-β3, tumor necrosis factor (TNF)-α, TNF-β, monocyte chemoattractant protein-1, NIK, endothelin-1 and endothelin receptors [16,17]. PARP-1 activation participates in apoptosis by stabilizing p53, by mediating the translocation of apoptosis-inducing factor from mitochondria to the nucleus, or by inhibiting early activation of DNases [8,9,18,19]. Evidence for the important role for PARP and, in particular, the PARP-1 isoform, activations in many major diseases has been obtained in experimental studies with PARP inhibitors and PARP-1-deficient mice and clinical studies and trials (reviewed in [8–10,20–22]). Recently, the PARP-1 isoform has been implicated in the pathogenesis of diabetes mellitus [8,9,23] and diabetic complications including endothelial dysfuncftion [24] and peripheral neuropathy [25,26]. The present study evaluated the role for PARP-1 in diabetic kidney disease using the PARP-1-deficient mouse and the multiple-dose streptozotocin model of diabetes.
2. MATERIALS AND METHODS
2.1. Reagents
Unless otherwise stated, all chemicals were of reagent-grade quality, and were purchased from Sigma Chemical Co., St. Louis, MO. Rabbit polyclonal anti-PARP-1 antibody was obtained from Enzo Life Sciences International, Inc., Plymouth Meeting, PA. Mouse monoclonal anti-poly(ADP-ribose) antibody was purchased from Trevigen, Inc., Gaithersburg, MD, rabbit polyclonal anti-Wilms tumor gene product-1 (WT1) antibody from Santa Cruz Biotechnology, Inc., Santa Cruz, CA, and mouse monoclonal anti-fibronectin antibody from BD Transduction Laboratories, Lexington, KY. Other reagents for immunohistochemistry have been purchased from Vector Laboratories, Inc., Burlingame, CA.
2.2. Animals
The experiments were performed in accordance with regulations specified by the National Institutes of Health “Principles of Laboratory Animal Care, 1985 Revised Version” and Pennington Biomedical Research Center Protocol for Animal Studies. Male PARP−/− (129S-Parp1tm1Zqw/J) and the corresponding wild-type (129S1/SvImJ) mice were fed a standard rat chow (PMI Nutrition Int., Brentwood, MO) and had access to water ad libitum. The multiple low-dose streptozotocin (STZ)-diabetes was induced as described [25]. Blood samples for glucose measurements were taken from the tail vein ~48 h after the STZ injection and the day prior to the study termination. All mice with blood glucose levels ≥13.8 mM were considered diabetic. The duration of experiment was 12 weeks. At the end of the study, mice were placed in individual metabolic cages (Lab Products, Inc., Seaford, DE) and urine collected for 48 h. Urine specimen were centrifuged at 12,000 g (4°C, 10 min) and frozen for subsequent assessment of albumin by ELISA.
2.3. Anesthesia, euthanasia, and tissue sampling
The animals were sedated by CO2, and immediately sacrificed by cervical dislocation. Kidneys were weighed. One kidney was immediately frozen in liquid nitrogen for subsequent Western blot analyses of PARP-1, poly(ADP-ribosyl)ated proteins, and fibronectin, and ELISA measurements of transforming growth factor--β1(TGF-β1), and nitrotyrosine (NT). The second kidney was fixed in normal buffered 4% formalin for further assessment of collagen deposition, podocyte counts, and periodic acid-Schiff (PAS)-positive substance accumulation.
2.4. Specific methods
2.4.1. Urinary albumin, protein, creatinine, and renal TGF-β1, and NT
Urinary albumin was assessed by ELISA (AssayMax mouse albumin ELISA kit, Assaypro, St. Charles, MO). Urinary protein was measured with the bicinchoninic acid protein assay (Pierce Biotechnology, Rockford, IL). Urinary creatinine was measured spectrophotometrically, using Creatinine Parameter assay kit (R&D Systems, Minneapolis, MN). For measurements of TGF-β1 and NT concentrations, renal cortex samples were homogenized on ice in RIPA buffer (1:10 w/v) containing 50 mM Tris-HCl, pH 7.2; 150 mM NaCl; 0.1% sodium dodecyl sulfate; 1% NP-40; 5 mM EDTA; 1 mM EGTA; 1% sodium deoxycholate and the protease/phosphatase inhibitors leupeptin (10 μg/ml), aprotinin (20 μg/ml), benzamidine (10 mM), phenylmethylsulfonyl fluoride (1 mM), sodium orthovanadate (1 mM). Homogenates were sonicated (3 × 5 s) and centrifuged at 14,000g (4°C, 20 min). TGF-β1 and NT concentrations were measured with the Quantikine mouse/rat/porcine/canine TGF-β1 kit (R&D Systems, Minneapolis, MN) and the OxiSelect Nitrotyrosine ELISA kit (Cell Biolabs, San Diego, CA). All the assays were performed in accordance with the manufacturers’ instructions. Protein was measured with the bicinchoninic acid protein assay (Pierce Biotechnology, Rockford, IL).
2.4.2. Western blot analysis
Western blot analyses of PARP-1, poly(ADP-ribosyl)ated proteins, and fibronectin were performed as described previously [27,28]. Protein bands were visualized with the Amersham ECL Western blotting detection reagents and analysis system (GE Healthcare, Buckinghampshire, UK). Membranes were then stripped and reprobed with β-actin antibody to verify equal protein loading. All poly(ADP-ribosyl)ated protein bands were used for calculations. The data were quantified by densitometry (Quantity One 4.5.0 software, Bio-Rad Laboratories, Richmond, CA), and the density of non-specific bands (obtained without primary antibody) subtracted from the results.
2.4.3. Immunohistochemical studies
All renal sections were processed by a single investigator and evaluated blindly. Collagen and PAS-positive substance stainings were performed by conventional histochemical methods. At least, ten fields of each section (~50 glomeruli) were examined to select one representative image. Color intensity of renal sections stained for PAS-positive substances was calculated using the ImageJ 1.43q software (National Institutes of Health, Bethesda, MD). 25–40 glomeruli were evaluated in a blinded fashion for each animal. 4-μm renal sections were stained for collagen with Masson’s trichrome as described [29], after which the percentage of areas positively stained for collagen was quantified in 10 randomly taken microphotographs of each section using the Threshold Colour plug-in of ImageJ 1.43q program, and the average per mouse was calculated. Podocyte nuclei were detected in 3-μm sections with an anti-WT1 antibody and the ABC staining kit, and visualized with the DAB detection kit (both kits from Vector Laboratories Inc., Burlingame, CA). Podocyte numbers were counted per glomerular section, and 20–25 glomeruli were examined for each animal. Low power observations of renal sections were made using a Olympus BX41 microscope. Color images were captured with a MiniVID digital camera (LW Scientific, Inc, Lawrenceville, GA) at 1280 × 1024 resolution.
2.5. Statistical analysis
The results are expressed as Mean ± SEM. Data were subjected to equality of variance F test, and then to log transformation, if necessary, before one-way analysis of variance. Where overall significance (p<0.05) was attained, individual between group comparisons were made using the Student-Newman-Keuls multiple range test. Significance was defined at p ≤ 0.05. When between-group variance differences could not be normalized by log transformation (datasets for body weights and plasma glucose), the data were analyzed by the nonparametric Kruskal-Wallis one-way analysis of variance, followed by the Bonferroni/Dunn or Fisher’s PLSD tests for multiple comparisons.
3. RESULTS
3.1. Effect of PARP-1 gene deficiency on body weights and glycemia
The initial (prior to STZ administration) body weights were similar in both groups of wild-type mice as well as in both groups of PARP-1−/− mice (Table 1). Weight gain was reduced in non-diabetic and diabetic PARP-1−/− mice (19% and − 16% vs 29% and 6% in non-diabetic and diabetic wild-type mice, respectively). PARP-1 gene deficiency did not affect the development of diabetes induced by multiple low-dose STZ administration. Initial blood glucose concentrations were 118% and 109% higher in diabetic wild-type and diabetic PARP-1−/− mice, respectively, than in the non-diabetic controls. The progression of diabetic hyperglycemia was also similar in the two diabetic groups. Final blood glucose concentrations were increased by 269% and by 267% in diabetic wild-type and diabetic PARP-1−/− mice compared with the corresponding controls. PARP-1 gene deficiency did not affect glycemia in non-diabetic mice.
Table 1.
Initial and final body weights and blood glucose concentrations in control and diabetic wild-type and poly(ADP-ribose) polymerase-1-deficient mice.
| Variable Group | Body weight (g) | Blood glucose (mmol/l) | ||
|---|---|---|---|---|
|
| ||||
| Initial | Final | Initial | Final | |
| PARP-1+/+, C | 24.2 ± 0.4 | 31.2 ± 1.0 | 6.7 ± 0.1 | 7.1 ± 0.3 |
| PARP-1+/+, D | 24.3 ± 0.5 | 25.6 ± 0.5** | 14.6 ± 0.6** | 26.2 ± 0.9** |
| PARP-1−/−, C | 29.9 ± 1.0 | 35.5 ± 2.0 | 6.6 ± 0.2 | 7.3 ± 0.3 |
| PARP-1−/−, D | 30.6 ± 1.1 | 25.8 ± 0.7** | 13.8 ± 0.6** | 26.8 ± 1.7** |
Initial and final blood glucose concentrations were measured after confirmation of diabetes (after 7–8 daily consecutive streptozotocin injections [33]) and at the 12-wk time point, respectively. Data are expressed as Means SEM. n = 10–15 per group. C – control mice; D–diabetic mice; PARP-1 – poly(ADP-ribose) polymerase-1.
p < 0.01 vs corresponding non-diabetic groups.
3.2. Effect of PARP-1 gene deficiency on renal cortex poly(ADP-ribosyl)ation
PARP-1 expression in renal cortex was 7% higher in diabetic wild-type mice, but the difference with the corresponding non-diabetic group did not achieve statistical significance (p = 0.20, Fig. 1, A and B). Poly(ADP-ribosyl)ated proteins were clearly identifiable in all experimental groups (Fig. 2, A and B). Renal cortex poly(ADP-ribosyl)ation was increased in both diabetic wild-type and diabetic PARP-1−/− mice, compared with the corresponding controls (by 18% and by 14%, p < 0.01 and < 0.05, respectively). No statistically significant differences in poly(ADP-ribosyl)ated protein abundance were found between diabetic wild-type and diabetic PARP-1−/− mice (p = 0.133). Poly(ADP-ribosyl)ated protein level was 5% lower in non-diabetic PARP-1−/− mice than in the corresponding wild-type mice, but the difference between the two groups did not achieve statistical significance (p = 0.41).
Fig. 1.
A) Representative Western blot analysis of renal cortex poly(ADP-ribose) polymerase-1 and B) poly(ADP-ribose)polymerase-1 content (densitometry), in control and diabetic wild-type and poly(ADP-ribose) polymerase-1-deficient mice. C – control; D – diabetic, PARP-1 – poly(ADP-ribose) polymerase-1. Mean ± SEM, n = 8–10 per group.
Fig. 2.
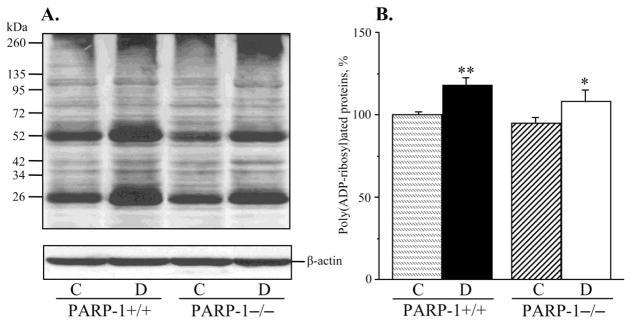
A) Representative Western blot analysis of renal cortex poly(ADP-ribosyl)ated proteins and B) poly(ADP-ribosyl)ated protein content (densitometry), in control and diabetic wild-type and poly(ADP-ribose)polymerase-1-deficient mice. C – control; D – diabetic, PARP-1 – poly(ADP-ribose) polymerase-1. Mean ± SEM, n = 9–12 per group. *, ** - p < 0.05 and < 0.01 vs corresponding non-diabetic groups.
3.3. Effect of PARP-1 gene deficiency on water consumption, urination volume, and urinary albumin, protein, and creatinine excretions
No statistically significant differences in either water consumption or urination volumes were found between non-diabetic wild-type and PARP-1−/− mice (Table 2). Diabetes was associated with 6.2-fold and 40-fold increases in water consumption and urination volumes in wild-type mice. Interestingly and surprisingly, despite similar levels of hyperglycemia in diabetic wild-type and diabetic PARP−/− mice, the latter displayed less dramatic elevation in both variables (2.7-fold and 8.5-fold increases compared with the corresponding non-diabetic group, p < 0.01 for both comparisons). Urinary albumin, protein, and creatinine excretions were increased 21-, 14-, and 12.5–fold, and 13-, 7-, and 12- fold, respectively, in diabetic wild-type and diabetic PARP-1−/− mice, compared with the corresponding non-diabetic groups. Urinary albumin/creatinine and protein/creatinine ratios were increased 1.78- and 3-fold in diabetic wild-type mice, and 1.33- and 1.38-fold in diabetic PARP−/− mice. The differences between the two diabetic groups for all the variables, except creatinine excretion, were of statistical significance (p < 0.05). PARP-1 gene deficiency did not affect urinary albumin, creatinine, and protein excretions, or urinary albumin/creatinine and protein/creatinine ratios in non-diabetic mice.
Table 2.
Water intake, urination volume, urinary albumin, total protein and creatinine excretions, albumin-to-creatinine and protein-to-creatinine ratios in control and diabetic wild-type and poly(ADP-ribose) polymerase-1-deficient mice.
| Variable Group | PARP-1+/+, C | PARP-1+/+, D | PARP-1−/−, C | PARP-1−/−, D |
|---|---|---|---|---|
| Water intake (ml) | 4.6 ± 1.5 | 28.5 ± 5.2** | 6.1 ± 1.7 | 16.3 ± 6.0**, ## |
| Urination volume (ml) | 0.53 ± 0.14 | 20.8 ± 4.4** | 1.26 ± 0.40 | 10.7 ± 3.2**, ## |
| Albuminuria (μg 48 h−1) | 14.8 ± 4.2 | 314 ± 45** | 15.5 ± 6.9 | 200 ± 53**, # |
| Proteinuria (mg 48 h−1) | 22.0 ± 5.0 | 317 ± 41** | 28.5 ± 7.1 | 203 ± 51**,# |
| Creatinine excretion (mg/48 h−1) | 255 ± 44 | 3,187 ± 473** | 287 ± 38 | 3,517 ± 570** |
| UA/CR (μg/mg) | 0.09 ± 0.01 | 0.16 ± 0.02** | 0.09 ± 0.01 | 0.12 ± 0.01**,# |
| UP/CR (mg/mg) | 0.05 ± 0.01 | 0.15 ± 0.02** | 0.08 ± 0.01 | 0.11 ± 0.01**,# |
Data are expressed as Means ± SEM. n = 7–15 per group. C – control mice; D – diabetic mice; PARP-1 poly(ADP-ribose) polymerase-1; UA/CR – urinary albumin-to-creatinine ratio; UP/CR – urinary protein-to-creatinine ratio.
p < 0.01 vs corresponding non-diabetic groups;
p < 0.05 and < 0.01 vs diabetic wild-type mice.
3.4. Effect of PARP-1 gene deficiency on diabetes-associated kidney hypertrophy, mesangial expansion, fibronectin expression, and podocyte loss
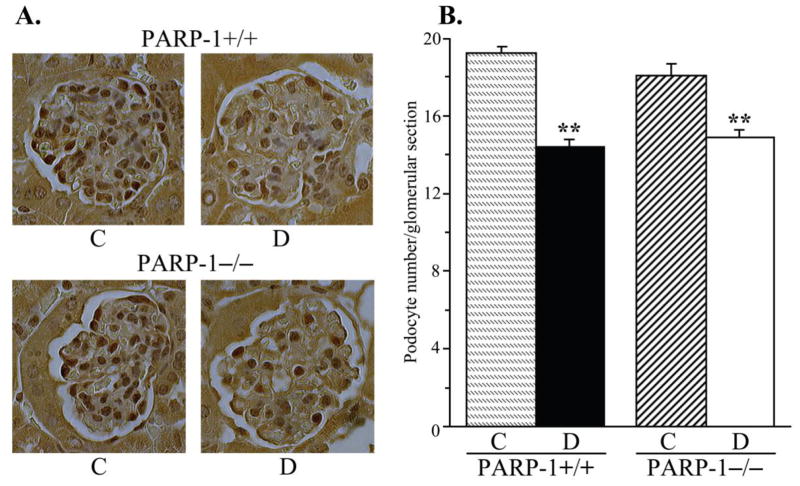
PARP-1 gene deficiency did not affect kidney weight in non-diabetic mice (Fig. 3, A). Whereas diabetic wild-type mice displayed clearly manifest kidney hypertrophy (22% increase in kidney weight, compared with the non-diabetic group, p < 0.01), diabetic PARP-1−/− mice maintained the kidney weights indistinguishable from those in the corresponding non-diabetic controls. Because of a reduced weight gain, kidney-to-body weight ratios were increased in both diabetic groups; however, this increase was ~10% greater in diabetic wild-type than in diabetic PARP-1−/− mice (p < 0.01, Fig. 3, B). PAS-positive substance staining intensity was increased by 52% in diabetic wild-type mice compared with the non-diabetic controls (Fig. 4, A and B), indicative of a mesangial expansion, and this increase was blunted in diabetic PARP−/− mice (23%, p < 0.01 vs non-diabetic PARP-1−/− mice, and < 0.05 vs diabetic wild-type group). PARP-1 gene deficiency did not affect PAS-positive substance staining intensity in non-diabetic mice. Renal fibronectin expression was increased by 42% in diabetic wild-type mice, and by 20% in diabetic PARP−/− mice, compared with the corresponding non-diabetic groups (p < 0.01 for all comparisons, Fig. 5, A and B). Both diabetic wild-type and diabetic PARP-1−/− mice displayed the loss of glomerular podocytes (to 75% and 83% vs corresponding non-diabetic groups, p < 0.01 for both comparisons, Fig. 6, A and B). Although podocyte loss was 8% smaller in diabetic PARP-1−/− mice than in the diabetic wild-type group, the difference did not achieve statistical significance (p = 0.36). Non-diabetic PARP-1−/− mice contained 6% less podocytes in their glomeruli than non-diabetic wild-type mice (p = 0.068).
Fig. 3.
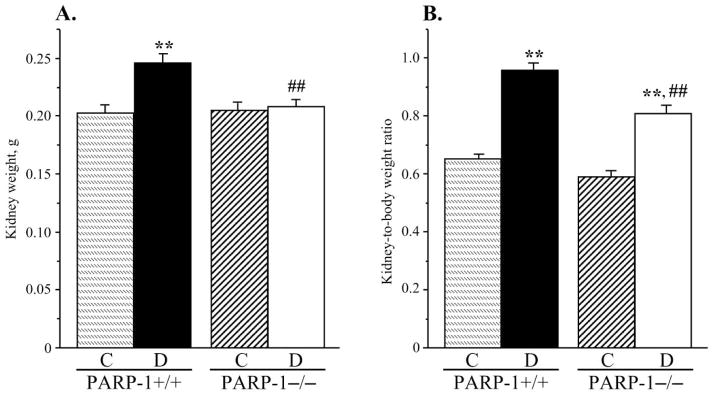
A) Kidney weights and B) kidney weight-to-body weight ratios, in control and diabetic wild-type and poly(ADP-ribose)polymerase-1-deficient mice. C – control; D – diabetic, PARP-1 – poly(ADP-ribose) polymerase-1. Mean ± SEM, n = 10–15 per group. ** - p < 0.01 vs corresponding non-diabetic groups; ## - p < 0.01 vs diabetic wild-type mice.
Fig. 4.
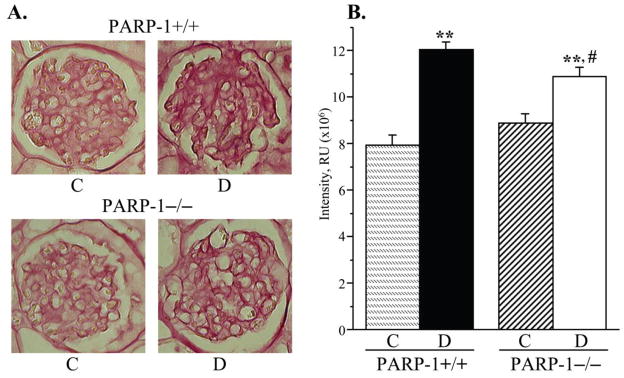
A) Representative microphotographs and B) color intensities of PAS-positive substance stainings in the renal cortex in control and diabetic wild-type and poly(ADP-ribose)polymerase-1-deficient mice. C – control; D – diabetic, PARP-1 – poly(ADP-ribose) polymerase-1. Magnification x 400. Mean ± SEM, n = 10 per group. ** - p < 0.01 vs corresponding non-diabetic groups; # - p < 0.05 vs diabetic wild-type mice.
Fig. 5.
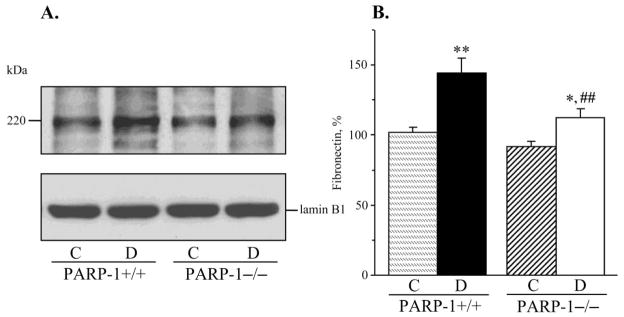
A) Representative Western blot analysis of renal cortex fibronectin and B) fibronectin content (densitometry), in control and diabetic wild-type and poly(ADP-ribose)polymerase-1-deficient mice. C – control; D – diabetic, PARP-1 – poly(ADP-ribose) polymerase-1. Mean ± SEM, n = 10–13 per group. *, ** - p < 0.05 and < 0.01 vs corresponding non-diabetic groups; ## - p < 0.01 vs diabetic wild-type mice.
Fig. 6.
A) Representative microphotographs of glomerular podocyte immunostaining and B) podocyte counts, in control and diabetic wild-type and poly(ADP-ribose)polymerase-1-deficient mice. C – control; D – diabetic, PARP-1 – poly(ADP-ribose) polymerase-1. Magnification x 400. Mean ± SEM, n = 10 per group. ** - p < 0.01 vs corresponding non-diabetic groups.
3.5 Effect of PARP-1 gene deficiency on diabetes-induced renal TGF-β accumulation, nitrosative stress, and glomerular collagen deposition
Both diabetic wild-type and diabetic PARP−/− mice displayed clearly manifest renal TGF-β accumulation (to 160% and 141% vs corresponding non-diabetic groups, p < 0.01 for both comparisons, Fig. 7, A). PARP-1 gene deficiency was associated with an ~15% reduction in TGF-β concentration in non-diabetic mice, but the differences between the two non-diabetic and two diabetic groups did not achieve statistical significance (p = 0.44 and p = 0.27, respectively). Renal cortex NT concentrations were dramatically increased in both diabetic wild-type and diabetic PARP-1−/− mice (to 282% and 258% compared with the corresponding non-diabetic groups, p < 0.01 for both comparisons, Fig. 7, B). Collagen deposition in renal glomeruli was increased by 243 % and 137 % in diabetic wild-type and diabetic PARP-1−/− mice vs corresponding non-diabetic groups (p < 0.01 for both comparisons, Fig. 8, A and B). PARP-1−/− gene deficiency was associated with a 26% reduction in diabetes-induced collagen deposition (p < 0.01 vs diabetic wild-type group), but did not affect this variable in the non-diabetic mice.
Fig. 7.
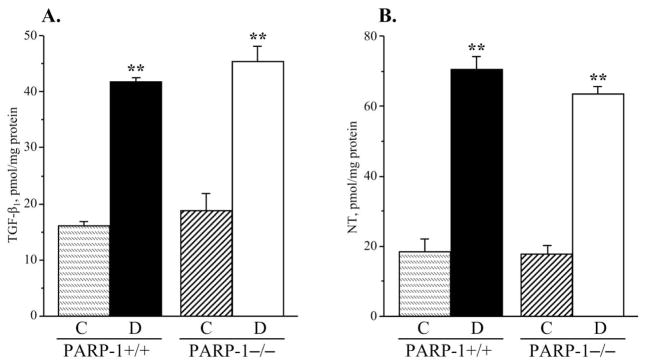
A) Transforming growth factor-β and B) nitrotyrosine concentrations, in the renal cortex in control and diabetic wild-type and poly(ADP-ribose)polymerase-1-deficient mice. C – control; D – diabetic, PARP-1 – poly(ADP-ribose) polymerase-1. Mean ± SEM, n = 9–14 per group. ** - p < 0.01 vs corresponding non-diabetic groups.
Fig. 8.
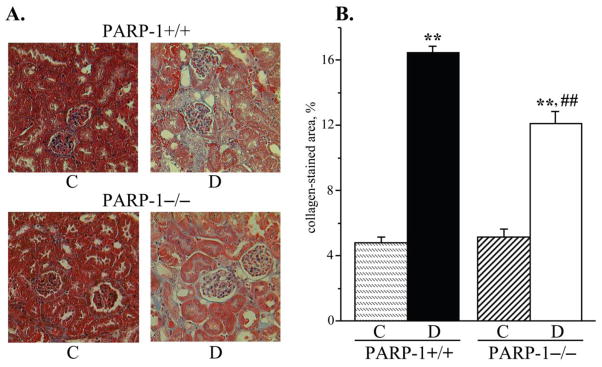
A) Representative microphotographs and B) percentage of positively stained for collagen area in the renal cortex in control and diabetic wild-type and poly(ADP-ribose)polymerase-1-deficient mice. C – control; D – diabetic, PARP-1 – poly(ADP-ribose) polymerase-1. Magnification x 200. Mean ± SEM, n = 8–10 per group. ** - p < 0.01 vs corresponding non-diabetic groups; ## - p < 0.01 vs diabetic wild-type mice.
4. DISCUSSION
The present study revealed that PARP-1 gene deficiency was associated with alleviation of several manifestations of diabetic kidney disease i.e., albuminuria and proteinuria, kidney hypertrophy, glomerular mesangial expansion, fibronectin overexpression, and collagen deposition.
The effects of PARP-1 inhibitors (INO-1001, PJ34, 1,5-isoquinolinediol, and GPI-15,427) in previous reports [27,30,31] and PARP-1 gene deficiency in the present study on diabetic nephropathy are unidirectional, i.e., both PARP inhibition and PARP-1 gene deficiency are nephroprotective. However, whereas PARP inhibitors completely or essentially prevented albuminuria, renal mesangial expansion, and renal collagen deposition in STZ-diabetic rats [27], PARP-1 gene deficiency reduced, but did not completely abrogate, these changes in the STZ-diabetic mouse model. Furthermore, whereas PARP inhibition attenuated podocyte loss, TGF-β accumulation, and nitrosative stress [27], the effects of PARP-1 gene deficiency on those variables were non-significant. Both PARP in general and the PARP-1 isoform activations are known to contribute to multiple pathological conditions via two mechanisms. One of them, NAD+ depletion, affects the rate of the NAD-dependent glyceraldehyde 3-phosphate dehydrogenase reaction, which slows down glycolysis, electron transport, and ATP formation, eventually leading to functional impairment or cell death [8,9,20,21]. Another one, poly(ADP-ribosyl)ation, leads to changes in transcriptional regulation and gene expression [8,9]. In the present study, renal cortex poly(ADP-ribosyl)ation was clearly identifiable in both non-diabetic and diabetic PARP-1-deficient mice. Furthermore, poly(ADP-ribosyl)ation was increased in both groups of diabetic mice with a small and statistically non-significant differences between diabetic wild-type and diabetic PARP-1−/− mice. The latter suggests that not only PARP-1, but also other PARPs, provide an important contribution to diabetes-induced poly(ADP-ribosyl)ation in the renal cortex. It is quite plausible that activation of PARP isoforms other than PARP-1 also contributes to NAD+ depletion and concomitant metabolic changes. A much more profound nephroprotective effect of PARP inhibition compared with PARP-1 gene deficiency may be related to the lack of isoform specificity of existing PARP inhibitors. GPI-15,427, employed in our kidney studies in STZ-diabetic rats [27], as well as several other PARP inhibitors inhibit not only PARP-1, but also PARP-2 [32–34, and W.Xu, personal communication]. Other PARP inhibitors i.e., INO-1001, PJ34, and 1,5-isoquinolinediol, employed for diabetic nephropathy-related studies [27,30], have never been tested for their ability to inhibit PARP enzymes other than PARP-1. Thus, the present findings put forward the possibility of a contribution of other PARPs to diabetic nephropathy. Recently, selective PARP-2 inhibitors and PARP-2 deficient mice became available for exploring human disease [35–37]. Activation of PARP-2 was identified as an important player in colitis [38], post-ischemic brain injury [39] and cancer [40]. The roles for PARP-2 and other, different from PARP-1, PARP isoforms in diabetic complications have never been elucidated.
Another possible explanation for different efficacies of PARP inhibition (STZ-rat study [27]) and PARP-1−/− gene deficiency in preventing biochemical and morphological manifestations of diabetic nephropathy lies in diverse susceptibility of rats and mice to toxic effects of STZ. STZ-diabetic rat is considered a good model for diabetic nephropathy-related studies because all manifestations of both early (albuminuria, mesangial expansion, podocyte loss) and advanced (glomerulosclerosis, tubulo-interstitial fibrosis) kidney disease are amenable to a variety of pharmacological interventions [7,27,41–44], which means that they do not develop because of STZ nephrotoxicity. In contrast, no good STZ-diabetic mouse model for diabetic nephropathy-related studies has been identified so far [45,46]. In the present study, diabetic 129S1/SvImJ mice developed robust albuminuria, kidney hypertrophy, and mesangial expansion, and modest podocyte loss. Further studies in this model are needed to determine its susceptibility to STZ nephrotoxicity, and suitability for drug discovery in diabetic nephropathy.
In conclusion, PARP-1 activation is responsible for kidney hypertrophy and contributes to albuminuria, proteinuria, mesangial expansion, and collagen deposition in Type 1 diabetic kidney disease. However, the nephroprotective effect of PARP-1 gene deficiency was less pronouced than that of non-selective PARP inhibitors in previous studies. The current findings provide rationale for 1) development and further studies of PARP inhibitors and PARP inhibitor-containing combination therapies, for prevention and treatment of diabetic nephropathy; and 2) evaluation of the role of PARP isoforms, other than PARP-1, in the pathogenesis of this devastating complications of diabetes mellitus.
Research highlights.
PARP-1 activation is responsible for kidney hypertrophy and contributes to albuminuria, proteinuria, renal mesangial expansion, fibronectin overexpression, and collagen deposition in Type 1 diabetic kidney disease
The nephroprotective effect of PARP-1 gene deficiency was less pronouced than that of non-selective PARP inhibitors in previous studies which suggests that the PARP isoform other than PARP-1 are also involved in the pathogenesis of diabetic nephropathy
The findings provide rationale for development and further studies of PARP inhibitors and PARP inhibitor-containing combination therapies, for prevention and treatment of diabetic kidney disease
Acknowledgments
The study was supported by the Juvenile Diabetes Research Foundation International Grant 1-2005-223, National Institutes of Health Grants DK070720, DK074517, and DK077141, and American Diabetes Association Grant (all to I.G.O.).
Footnotes
Publisher's Disclaimer: This is a PDF file of an unedited manuscript that has been accepted for publication. As a service to our customers we are providing this early version of the manuscript. The manuscript will undergo copyediting, typesetting, and review of the resulting proof before it is published in its final citable form. Please note that during the production process errors may be discovered which could affect the content, and all legal disclaimers that apply to the journal pertain.
REFRENCES
- 1.Molitch ME, DeFronzo RA, Franz MJ, Keane WF, Mogensen CE, Parving HH, Steffes MW American Diabetes Association. Nephropathy in diabetes. Diabetes Care. 2004;27:S79–S83. doi: 10.2337/diacare.27.2007.s79. [DOI] [PubMed] [Google Scholar]
- 2.Strippoli GF, Craig M, Deeks JJ, Schena FP, Craig JC. Effects of angiotensin converting enzyme inhibitors and angiotensin II receptor antagonists on mortality and renal outcomes in diabetic nephropathy: systematic review. BMJ. 2004;329:828. doi: 10.1136/bmj.38237.585000.7C. [DOI] [PMC free article] [PubMed] [Google Scholar]
- 3.Nelson R, Knowler W, Pettitt D, Bennett P. National Institutes of Diabetes and Digestive and Kidney Diseases, editor. Diabetes in America, NIH Publication No.95–1468. Bethesda, MD: 1995. Kidney diseases in diabetes; pp. 349–385. [Google Scholar]
- 4.Eid AA, Gorin Y, Fagg BM, Maalouf R, Barnes JL, Block K, Abboud HE. Mechanisms of podocyte injury in diabetes: role of cytochrome P450 and NADPH oxidases. Diabetes. 2009;58:1201–1211. doi: 10.2337/db08-1536. [DOI] [PMC free article] [PubMed] [Google Scholar]
- 5.Yuan H, Lanting L, Xu ZG, Li SL, Swiderski P, Putta S, Jonnalagadda M, Kato M, Natarajan R. Effects of cholesterol-tagged small interfering RNAs targeting 12/15-lipoxygenase on parameters of diabetic nephropathy in a mouse model of type 1 diabetes. Am J Physiol Renal Physiol. 2008;295:F605–F617. doi: 10.1152/ajprenal.90268.2008. [DOI] [PMC free article] [PubMed] [Google Scholar]
- 6.Lee MJ, Feliers D, Mariappan MM, Sataranatarajan K, Mahimainathan L, Musi N, Foretz M, Viollet B, Weinberg JM, Choudhury GG, Kasinath BS. A role for AMP-activated protein kinase in diabetes-induced renal hypertrophy. Am J Physiol Renal Physiol. 2007;292:F617–F627. doi: 10.1152/ajprenal.00278.2006. [DOI] [PubMed] [Google Scholar]
- 7.Garman JH, Mulroney S, Manigrasso M, Flynn E, Maric C. Omega-3 fatty acid rich diet prevents diabetic renal disease. Am J Physiol Renal Physiol. 2009;296:F306–F316. doi: 10.1152/ajprenal.90326.2008. [DOI] [PubMed] [Google Scholar]
- 8.Jagtap P, Szabó C. Poly(ADP-ribose) polymerase and the therapeutic effects of its inhibitors. Nat Rev Drug Discov. 2005;4:421–440. doi: 10.1038/nrd1718. [DOI] [PubMed] [Google Scholar]
- 9.Virág L. Structure and function of poly(ADP-ribose) polymerase-1: role in oxidative stress-related pathologies. Curr Vasc Pharmacol. 2005;3:209–214. doi: 10.2174/1570161054368625. [DOI] [PubMed] [Google Scholar]
- 10.Rossi MN, Carbone M, Mostocotto C, Mancone C, Tripodi M, Maione R, Amati P. Mitochondrial localization of PARP-1 requires interaction with mitofilin and is involved in the maintenance of mitochondrial DNA integrity. J Biol Chem. 2009;284:31616–31624. doi: 10.1074/jbc.M109.025882. [DOI] [PMC free article] [PubMed] [Google Scholar]
- 11.Du X, Matsumura T, Edelstein D, Rossetti L, Zsengellér Z, Szabó C, Brownlee M. Inhibition of GAPDH activity by poly(ADP-ribose) polymerase activates three major pathways of hyperglycemic damage in endothelial cells. J Clin Invest. 2003;112:1049–1057. doi: 10.1172/JCI18127. [DOI] [PMC free article] [PubMed] [Google Scholar]
- 12.Pacher P, Beckman JS, Liaudet L. Nitric oxide and peroxynitrite in health and disease. Physiol Rev. 2007;87:315–424. doi: 10.1152/physrev.00029.2006. [DOI] [PMC free article] [PubMed] [Google Scholar]
- 13.Szabó C, Ischiropoulos H, Radi R. Peroxynitrite: biochemistry, pathophysiology and development of therapeutics. Nat Rev Drug Discov. 2007;6:662–680. doi: 10.1038/nrd2222. [DOI] [PubMed] [Google Scholar]
- 14.Kauppinen TM, Chan WY, Suh SW, Wiggins AK, Huang EJ, Swanson RA. Direct phosphorylation and regulation of poly(ADP-ribose) polymerase-1 by extracellular signal-regulated kinases 1/2. Proc Natl Acad Sci U S A. 2006;103:7136–1741. doi: 10.1073/pnas.0508606103. [DOI] [PMC free article] [PubMed] [Google Scholar]
- 15.Homburg S, Visochek L, Moran N, Dantzer F, Priel E, Asculai E, Schwartz D, Rotter V, Dekel N, Cohen-Armon M. A fast signal-induced activation of poly(ADP-ribose) polymerase: a novel downstream target of phospholipase C. J Cell Biol. 2000;150:293–307. doi: 10.1083/jcb.150.2.293. [DOI] [PMC free article] [PubMed] [Google Scholar]
- 16.Ha HC, Hester LD, Snyder SH. Poly(ADP-ribose) polymerase-1 dependence of stress-induced transcription factors and associated gene expression in glia. Proc Natl Acad Sci U S A. 2002;99:3270–3275. doi: 10.1073/pnas.052712399. [DOI] [PMC free article] [PubMed] [Google Scholar]
- 17.Minchenko AG, Stevens MJ, White L, Abatan OI, Komjáti K, Pacher P, Szabó C, Obrosova IG. Diabetes-induced overexpression of endothelin-1 and endothelin receptors in the rat renal cortex is mediated via poly(ADP-ribose) polymerase activation. FASEB J. 2003;17:1514–1516. doi: 10.1096/fj.03-0013fje. [DOI] [PubMed] [Google Scholar]
- 18.Yu SW, Wang H, Poitras MF, Coombs C, Bowers WJ, Federoff HJ, Poirier GG, Dawson TM, Dawson VL. Mediation of poly(ADP-ribose) polymerase-1-dependent cell death by apoptosis-inducing factor. Science. 2002;297:259–263. doi: 10.1126/science.1072221. [DOI] [PubMed] [Google Scholar]
- 19.Yu SW, Andrabi SA, Wang H, Kim NS, Poirier GG, Dawson TM, Dawson VL. Apoptosis-inducing factor mediates poly(ADP-ribose) (PAR) polymer-induced cell death. Proc Natl Acad Sci U S A. 2006;103:18314–18319. doi: 10.1073/pnas.0606528103. [DOI] [PMC free article] [PubMed] [Google Scholar]
- 20.Pacher P, Szabó C. Role of the peroxynitrite-poly(ADP-ribose) polymerase pathway in human disease. Am J Pathol. 2008;173:2–13. doi: 10.2353/ajpath.2008.080019. [DOI] [PMC free article] [PubMed] [Google Scholar]
- 21.Pacher P, Szabó C. Role of poly(ADP-ribose) polymerase 1 (PARP-1) in cardiovascular diseases: the therapeutic potential of PARP inhibitors. Cardiovasc Drug Rev. 2007;25:235–260. doi: 10.1111/j.1527-3466.2007.00018.x. [DOI] [PMC free article] [PubMed] [Google Scholar]
- 22.Love S, Barber R, Wilcock GK. Neuronal death in brain infarcts in man. Neuropathol Appl Neurobiol. 2000;26:55–66. doi: 10.1046/j.1365-2990.2000.00218.x. [DOI] [PubMed] [Google Scholar]
- 23.Burkart V, Wang ZQ, Radons J, Heller B, Herceg Z, Stingl L, Wagner EF, Kolb H. Mice lacking the poly(ADP-ribose) polymerase gene are resistant to pancreatic beta-cell destruction and diabetes development induced by streptozocin. Nat Med. 1999;5:314–319. doi: 10.1038/6535. [DOI] [PubMed] [Google Scholar]
- 24.Garcia Soriano F, Virág L, Jagtap P, Szabó E, Mabley JG, Liaudet L, Marton A, Hoyt DG, Murthy KG, Salzman AL, Southan GJ, Szabó C. Diabetic endothelial dysfunction: the role of poly(ADP-ribose) polymerase activation. Nat Med. 2001;7:108–113. doi: 10.1038/83241. [DOI] [PubMed] [Google Scholar]
- 25.Obrosova IG, Li F, Abatan OI, Forsell MA, Komjáti K, Pacher P, Szabó C, Stevens MJ. Role of poly(ADP-ribose) polymerase activation in diabetic neuropathy. Diabetes. 2004;53:711–720. doi: 10.2337/diabetes.53.3.711. [DOI] [PubMed] [Google Scholar]
- 26.Obrosova IG, Xu W, Lyzogubov VV, Ilnytska O, Mashtalir N, Vareniuk I, Pavlov IA, Zhang J, Slusher B, Drel VR. PARP inhibition or gene deficiency counteracts intraepidermal nerve fiber loss and neuropathic pain in advanced diabetic neuropathy. Free Radic Biol Med. 2008;44:972–981. doi: 10.1016/j.freeradbiomed.2007.09.013. [DOI] [PMC free article] [PubMed] [Google Scholar]
- 27.Drel VR, Xu W, Zhang J, Pavlov IA, Shevalye H, Slusher B, Obrosova IG. Poly(Adenosine 5′-diphosphate-ribose) polymerase inhibition counteracts multiple manifestations of experimental type 1 diabetic nephropathy. Endocrinology. 2009;150:5273–5283. doi: 10.1210/en.2009-0628. [DOI] [PMC free article] [PubMed] [Google Scholar]
- 28.Drel VR, Xu W, Zhang J, Kador PF, Ali TK, Shin J, Julius U, Slusher B, El-Remessy AB, Obrosova IG. Poly(ADP-ribose)polymerase inhibition counteracts cataract formation and early retinal changes in streptozotocin-diabetic rats. Invest Ophthalmol Vis Sci. 2009;50:1778–1790. doi: 10.1167/iovs.08-2191. [DOI] [PubMed] [Google Scholar]
- 29.Figarola JL, Loera S, Weng Y, Shanmugam N, Natarajan R, Rahbar S. LR-90 prevents dyslipidaemia and diabetic nephropathy in the Zucker diabetic fatty rat. Diabetologia. 2008;51:882–891. doi: 10.1007/s00125-008-0935-x. [DOI] [PubMed] [Google Scholar]
- 30.Szabó C, Biser A, Benko R, Böttinger E, Suszták K. Poly(ADP-ribose) polymerase inhibitors ameliorate nephropathy of type 2 diabetic Leprdb/db mice. Diabetes. 2006;55:3004–3012. doi: 10.2337/db06-0147. [DOI] [PubMed] [Google Scholar]
- 31.Shevalye H, Stavniichuk R, Xu W, Zhang J, Lupachyk S, Maksimchyk Y, Drel VR, Floyd EZ, Slusher B, Obrosova IG. Poly(ADP-ribose) polymerase (PARP) inhibition counteracts multiple manifestations of kidney disease in long-term streptozotocin-diabetic rat model. Biochem Pharmacol. 2010;79:1007–1014. doi: 10.1016/j.bcp.2009.11.018. [DOI] [PMC free article] [PubMed] [Google Scholar]
- 32.Penning TD, Zhu GD, Gandhi VB, Gong J, Liu X, Shi Y, Klinghofer V, Johnson EF, Donawho CK, Frost DJ, Bontcheva-Diaz V, Bouska JJ, Osterling DJ, Olson AM, Marsh KC, Luo Y, Giranda VL. Discovery of the Poly(ADP-ribose) polymerase (PARP) inhibitor 2-[(R)-2-methylpyrrolidin-2-yl]-1H-benzimidazole-4-carboxamide (ABT-888) for the treatment of cancer. J Med Chem. 2009;52:514–523. doi: 10.1021/jm801171j. [DOI] [PubMed] [Google Scholar]
- 33.Eltze T, Boer R, Wagner T, Weinbrenner S, McDonald MC, Thiemermann C, Bürkle A, Klein T. Imidazoquinolinone, imidazopyridine, and isoquinolindione derivatives as novel and potent inhibitors of the poly(ADP-ribose) polymerase (PARP): a comparison with standard PARP inhibitors. Mol Pharmacol. 2008;74:1587–1598. doi: 10.1124/mol.108.048751. [DOI] [PubMed] [Google Scholar]
- 34.Menear KA, Adcock C, Boulter R, Cockcroft XL, Copsey L, Cranston A, Dillon KJ, Drzewiecki J, Garman S, Gomez S, Javaid H, Kerrigan F, Knights C, Lau A, Loh VM, Jr, Matthews IT, Moore S, O’Connor MJ, Smith GC, Martin NM. 4-[3-(4-cyclopropanecarbonylpiperazine-1-carbonyl)-4-fluorobenzyl]-2H-phthalazin-1-one: a novel bioavailable inhibitor of poly(ADP-ribose) polymerase-1. J Med Chem. 2008;51:6581–6591. doi: 10.1021/jm8001263. [DOI] [PubMed] [Google Scholar]
- 35.Moroni F, Formentini L, Gerace E, Camaioni E, Pellegrini-Giampietro DE, Chiarugi A, Pellicciari R. Selective PARP-2 inhibitors increase apoptosis in hippocampal slices but protect cortical cells in models of post-ischaemic brain damage. Br J Pharmacol. 2009;157:854–862. doi: 10.1111/j.1476-5381.2009.00232.x. [DOI] [PMC free article] [PubMed] [Google Scholar]
- 36.Pellicciari R, Camaioni E, Costantino G, Formentini L, Sabbatini P, Venturoni F, Eren G, Bellocchi D, Chiarugi A, Moroni F. On the way to selective PARP-2 inhibitors. Design, synthesis, and preliminary evaluation of a series of isoquinolinone derivatives. ChemMedChem. 2008;3:914–923. doi: 10.1002/cmdc.200800010. [DOI] [PubMed] [Google Scholar]
- 37.Huber A, Bai P, de Murcia JM, de Murcia G. PARP-1, PARP-2 and ATM in the DNA damage response: functional synergy in mouse development. DNA Repair (Amst) 2004;3:1103–1108. doi: 10.1016/j.dnarep.2004.06.002. [DOI] [PubMed] [Google Scholar]
- 38.Popoff I, Jijon H, Monia B, Tavernini M, Ma M, McKay R, Madsen K. Antisense oligonucleotides to poly(ADP-ribose) polymerase-2 ameliorate colitis in interleukin-10-deficient mice. J Pharmacol Exp Ther. 2002;303:1145–1154. doi: 10.1124/jpet.102.039768. [DOI] [PubMed] [Google Scholar]
- 39.Kofler J, Otsuka T, Zhang Z, Noppens R, Grafe MR, Koh DW, Dawson VL, de Murcia JM, Hurn PD, Traystman RJ. Differential effect of PARP-2 deletion on brain injury after focal and global cerebral ischemia. J Cereb Blood Flow Metab. 2006;26:135–141. doi: 10.1038/sj.jcbfm.9600173. [DOI] [PubMed] [Google Scholar]
- 40.Yélamos J, Schreiber V, Dantzer F. Toward specific functions of poly(ADP-ribose) polymerase-2. Trends Mol Med. 2008;14:169–178. doi: 10.1016/j.molmed.2008.02.003. [DOI] [PubMed] [Google Scholar]
- 41.Trachtman H, Futterweit S, Maesaka J, Ma C, Valderrama E, Fuchs A, Tarectecan AA, Rao PS, Sturman JA, Boles TH, Fu M-X, Baynes J. Taurine ameliorates chronic streptozocin-induced diabetic nephropathy in rats. Am J Physiol. 1995;269:F429–F438. doi: 10.1152/ajprenal.1995.269.3.F429. [DOI] [PubMed] [Google Scholar]
- 42.Melhem MF, Craven PA, Liachenko J, DeRubertis FR. Alpha-lipoic acid attenuates hyperglycemia and prevents glomerular mesangial matrix expansion in diabetes. J Am Soc Nephrol. 2002;13:108–116. doi: 10.1681/ASN.V131108. [DOI] [PubMed] [Google Scholar]
- 43.Forbes JM, Thallas V, Thomas MC, Founds HW, Burns WC, Jerums G, Cooper ME. The breakdown of preexisting advanced glycation end products is associated with reduced renal fibrosis in experimental diabetes. FASEB J. 2003;17:1762–1764. doi: 10.1096/fj.02-1102fje. [DOI] [PubMed] [Google Scholar]
- 44.Wang JJ, Zhang SX, Mott R, Knapp RR, Cao W, Lau K, Ma JX. Salutary effect of pigment epithelium-derived factor in diabetic nephropathy: evidence for antifibrogenic activities. Diabetes. 2006;55:1678–1685. doi: 10.2337/db05-1448. [DOI] [PubMed] [Google Scholar]
- 45.Breyer MD, Böttinger E, Brosius FC, 3rd, Coffman TM, Harris RC, Heilig CW, Sharma K. AMDCC, Mouse models of diabetic nephropathy. J Am Soc Nephrol. 2005;16:27–45. doi: 10.1681/ASN.2004080648. [DOI] [PubMed] [Google Scholar]
- 46.Brosius FC, 3rd, Alpers CE, Bottinger EP, Breyer MD, Coffman TM, Gurley SB, Harris RC, Kakoki M, Kretzler M, Leiter EH, Levi M, McIndoe RA, Sharma K, Smithies O, Susztak K, Takahashi N, Takahashi T. Animal Models of Diabetic Complications Consortium, Mouse models of diabetic nephropathy. J Am Soc Nephrol. 2009;20:2503–2512. doi: 10.1681/ASN.2009070721. [DOI] [PMC free article] [PubMed] [Google Scholar]


