Abstract
OBJECTIVES
To evaluate readmission rates and associated factors in order to identify potentially preventable readmissions.
SUMMARY BACKGROUND DATA
The decision to penalize hospitals for readmissions is compelling healthcare systems to develop processes to minimize readmissions. Research to identify preventable readmissions is critical to achieve these goals.
METHODS
We performed a retrospective review of University HealthSystem Consortium database for cancer patients hospitalized from 1/2010–9/2013. Outcome measures were 7-, 14-, and 30-day readmission rates and readmission diagnoses. Hospital and disease characteristics were evaluated to evaluate relationships with readmission.
RESULTS
2,517,886 patients were hospitalized for cancer treatment. Readmission rates at 7, 14, and 30 days were 2.2%, 3.7%, and 5.6%. Despite concern that premature hospital discharge may be associated with increased readmissions, a shorter initial length of stay predicted lower readmission rates. Furthermore, high volume centers and designated cancer centers had higher readmission rates. Evaluating institutional data (N=2517 patients) demonstrated that factors associated with higher readmission rates include: discharge from a medical service, site of malignancy, emergent primary admission. When examining readmission within 7 days for surgical services, the most common readmission diagnoses were infectious causes (46.3%), nausea/vomiting/dehydration (26.8%), and pain (6.1%).
CONCLUSIONS
A minority of patients following hospitalization for cancer-related therapy are readmitted with potentially preventable conditions such as nausea, vomiting, dehydration and pain. However, most factors associated with readmission cannot be modified. Additionally, high volume centers and designated cancer centers have higher readmission rates, which may indicate that readmission rates may not be an appropriate marker for quality improvement.
INTRODUCTION
Readmission rates have emerged as a new quality metric with financially important ramifications. The cost of rehospitalization is significant, both in terms of financial impact on the healthcare system and increased patient morbidity. Medicare estimated the annual cost of readmission to be $17 billion, and the same study showed that over half of patients discharged after surgery were rehospitalized or died within a year of discharge.1 With the United States Readmissions Reduction Program set to reduce hospital payments for higher than expected readmission rates within 30 days of surgery for Medicare patients,2 research to characterize risk factors for readmission is essential.
Given the increased focus on readmission, numerous studies have attempted to identify clear predictors of increased risk for rehospitalization. Several studies have found that patient factors such as age and pre-existing comorbidities are important predictors of readmission.3–5 Also, the association between post-operative complications and increased risk for readmission as well as increased costs to the healthcare system is well established.1, 3, 4, 6–12 Finally, some have suggested that efforts to reduce costs by decreasing hospital length of stay (LOS) may reflexively cause an increase in rehospitalization rates4, 5, 13; however, the impact of shortened LOS on hospital readmission rates is uncertain.
Currently, the majority of research on readmissions is largely procedure-specific, and may not be widely applicable to other surgical treatments. It is unclear which factors associated with readmission are modifiable and the effects of hospital factors on readmission. The objective of this study is to characterize readmissions for a large group of patients at risk for rehospitalization, cancer patients. In particular, we examine potentially preventable readmissions and the impact of hospital factors on readmission rates.
METHODS
We performed a retrospective review of data from the University Health System Consortium (UHC) database, an alliance of 120 academic medical centers and 302 of their affiliated hospitals representing the nation's leading academic medical centers. It is an administrative database of inpatient and outpatient encounters submitted by 240 of the hospitals and derived from billing data with the purpose of bringing about performance improvement through collaboration. Analysis included all cancer patients hospitalized from January 2010 until September 2013. Our main outcome measures were 7, 14, and 30 day readmission rates and adjusted LOS (LOSa; defined as the ratio of observed: expected LOS based on patient factors) for both initial and readmission hospitalizations. Only patients considered inpatient admissions were evaluated; those admitted to the hospital for outpatient observation (ie, < 24 hours of hospitalization) were excluded. Additional factors such as hospital volume (defined as number of cancer-specific hospital admissions during the study period; limited to surgical admissions for surgical subset analysis), whether or not the admitting hospital was a National Cancer Institute (NCI)-designated comprehensive cancer center, and specialty of discharging physician were also measured. Readmission data focused on related readmissions (defined as readmission diagnosis related to initial admission); planned readmissions for chemotherapy, radiation therapy or rehabilitation were excluded.
We then narrowed our search to institutional data from the UHC database for all cancer patients hospitalized at University of California Davis Medical Center (UCDMC) over the same time period (1/2010–9/2013). Main outcome measures were 7-, 14-, and 30-day readmission rates and readmission diagnoses. Variables studied included site of malignancy, specialty of discharging physician, category of initial admission (emergency, urgent, elective) as identified by all patient refined diagnosis-related group (APR DRG), and individual physician volume. Readmission diagnoses were studied for surgical patients treated by General Surgery, Surgical Oncology, Gynecological Oncology, Thoracic Surgery, and Urology services based on the top four ICD-9 diagnosis codes listed for the readmission hospitalization.
Univariate analysis was performed using the χ2 test, Fisher’s exact test, Wilcoxon rank-sum test, and Kruskal-Wallis test when appropriate. For non-parametric testing of the relationship between readmission rates with LOSa, LOS was dichotomized by lower than expected LOS (<1.0) and higher than expected LOS (≥1.0); hospital and physician volume independent predictors were separated into quartiles for analysis. Analysis was performed for the entire UHC cohort and the UHC surgical cohort separately. Additional analyses comparing NCI-designated cancer centers versus non-designated centers and for institutional data were also performed.
Fitted robust linear regression was used to analyze the relationship between readmission rates and LOSa, hospital volume, and physician volume.14 Multivariable robust regression analysis was performed to assess the relationship between 30-day readmission rate and the four predictive variables: LOSa (based on <1.0 and ≥1.0), hospital volume (divided by quartile), discharge by medical or surgical service, and NCI-designated comprehensive cancer center status. A P value less than 0.05 was considered significant. All analyses were performed with SAS Version 9.2 (SAS Institute Inc., Cary, NC, USA).
RESULTS
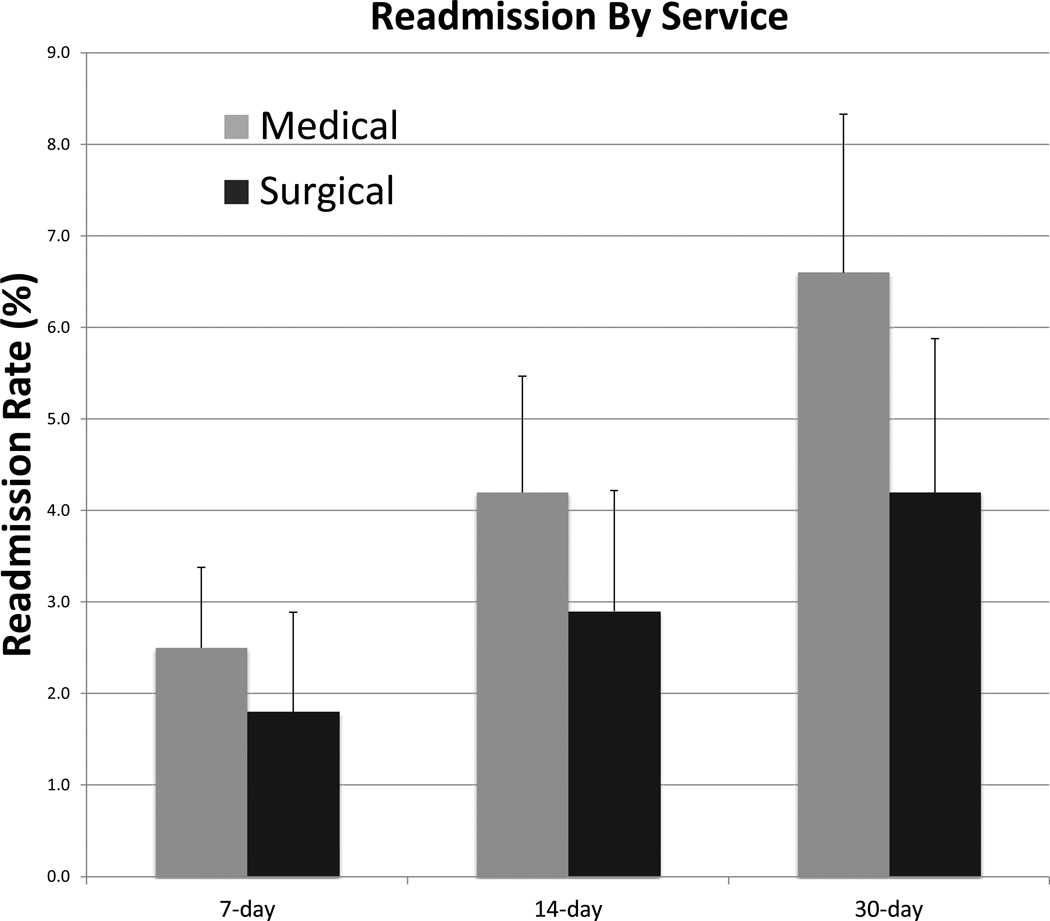
A total of 2,517,886 patients were hospitalized for cancer treatment at 235 UHC hospitals between January 2010 and September 2013. Of these, 1,108,999 were surgical patients, and 1,408,887 were medical patients. Overall mean readmission rates at 7, 14, and 30 days post-discharge were 2.2%, 3.7%, and 5.6%. Comparing readmission rates for medical and surgical services, medical services had higher rates of readmission at 7-, 14-, and 30-days (2.51%, 4.20%, and 6.55%) than surgical services (1.84%, 2.88%, and 4.17%) (p<0.0001 for all time points) (Fig. 1).
Figure 1. Readmission by service.
Within the UHC system, discharge from a medical service was associated with higher average rates of readmission at 7, 14, and 30-days (2.51%, 4.20%, and 6.55%) when compared to discharge from a surgical service (1.84% 2.88%, and 4.17%) (p<0.001 for all by two-sided Wilcoxon rank-sum test). Error bars represent one standard deviation.
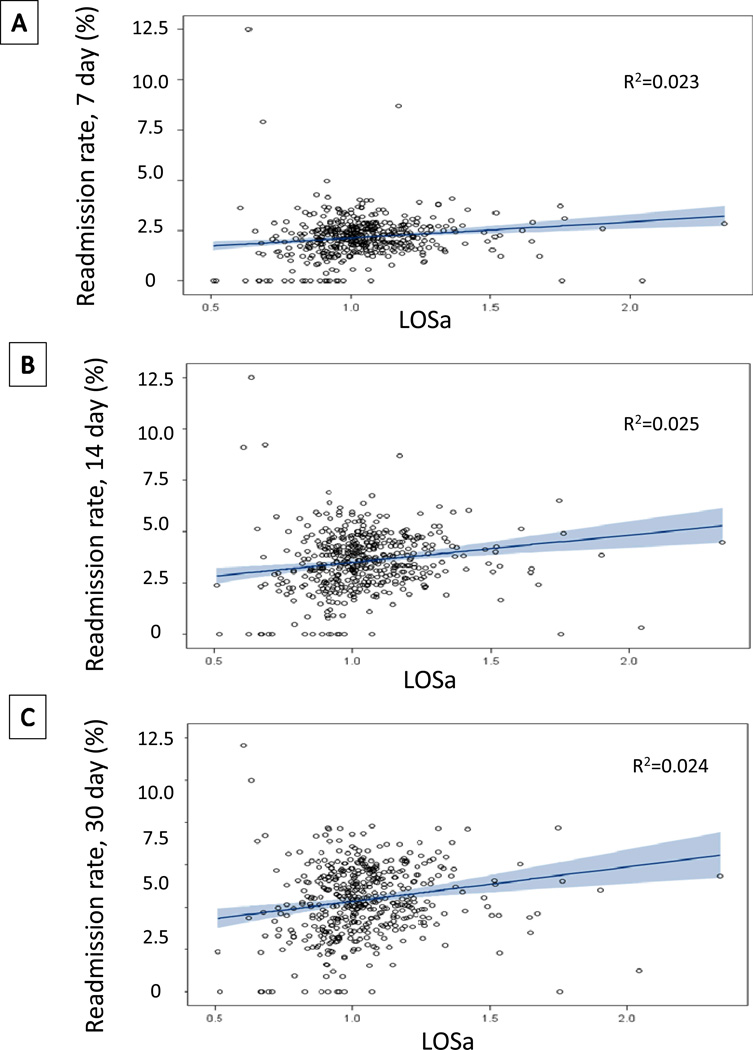
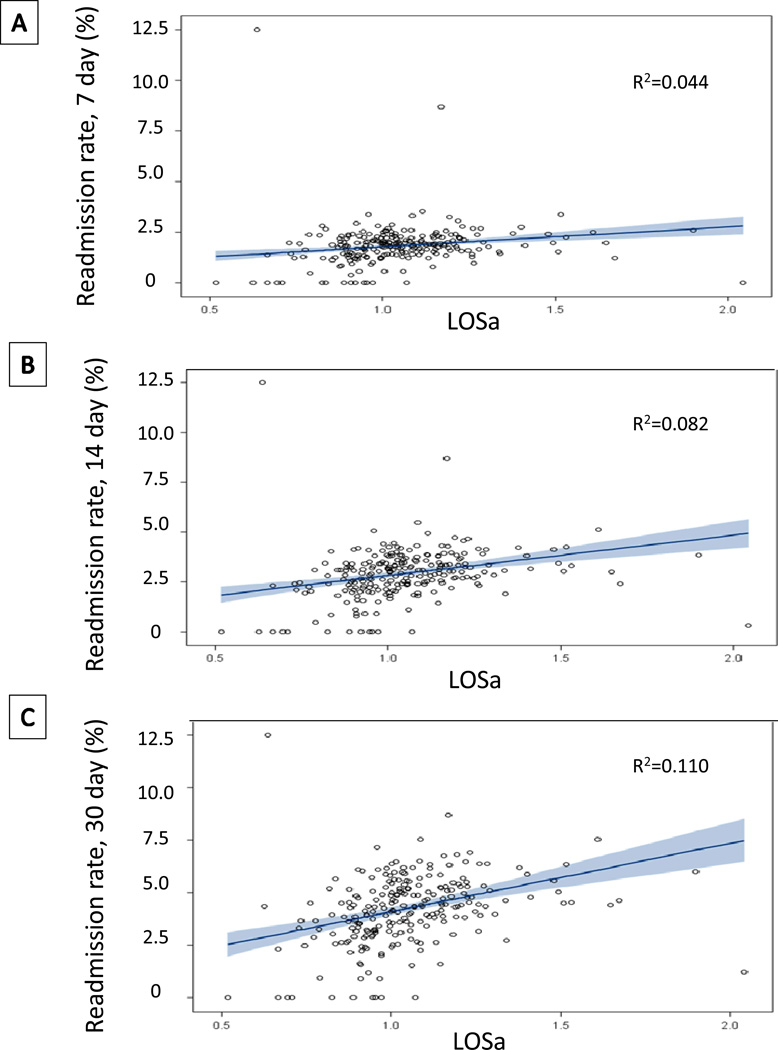
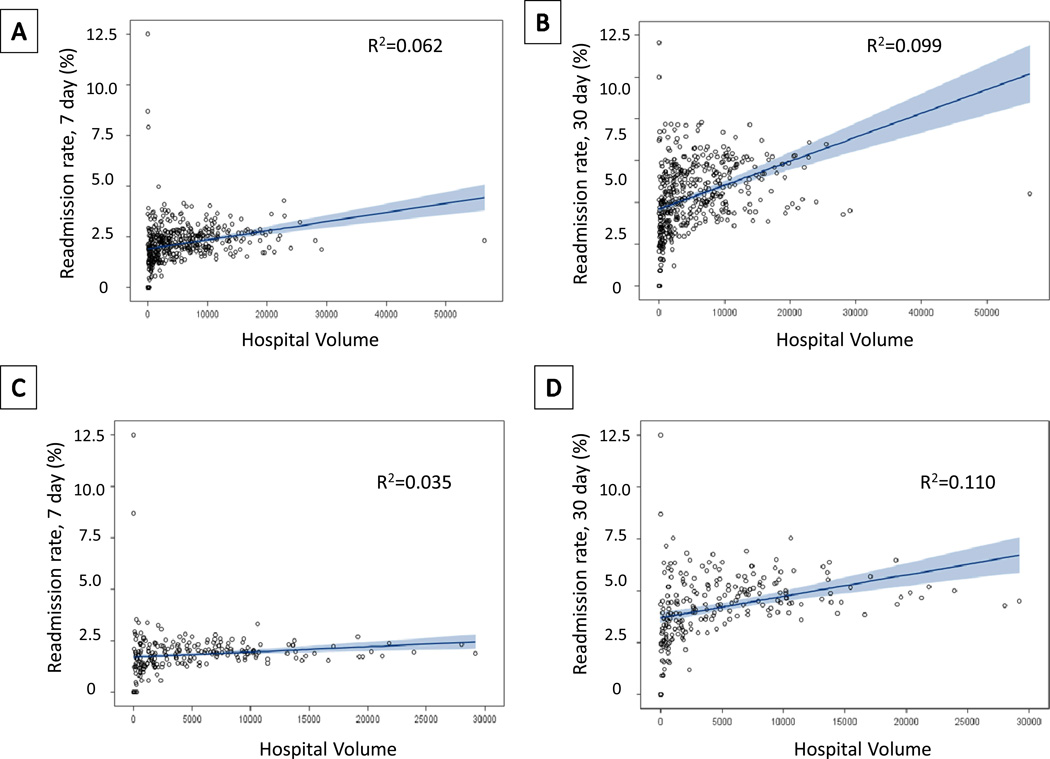
We next examined the impact of LOSa from the initial hospitalization on readmission rates. This line of investigation examined whether patients with a shorter LOSa may have a higher readmission rate due to potential premature discharge. First examining the entire cohort, a longer LOSa, from the primary hospitalization demonstrated slightly higher readmission rates at 7, 14, and 30 days (Fig. 2). Non-parametric testing demonstrated that the relationship was statistically significant at all timepoints (p=0.0001, p=0.0006, p=0.0006, respectively); however, regression analysis revealed that the relationship was only weakly related between LOSa and readmission rate (R2=0.023, R2=0.025, R2=0.024, respectively). When analyzing this relationship for just surgical patients, we again saw a statistically significant (p=0.0001, p<0.0001, p<0.0001), but weak linear relationship between increased LOSa from the index hospitalization and increased readmission rates at 7, 14, and 30 days (R2=0.044, R2=0.082, R2=0.110, respectively) (Fig. 3). We then analyzed the effect of hospital volume on readmission rates. There was a statistically significant association between high volume centers and higher readmission rates at 7, 14, and 30 days for both the entire cohort (p<0.0001 for all) and the surgical services (p=0.0006, p<0.0001, p<0.0001). Again, regression analysis revealed that the relationship was not linear nor very strong for either the entire group (R2=0.062 at 7 days, R2=0.099 at 30 days) or surgical patients (R2=0.035 at 7 days, R2=0.110 at 30 days) (Fig. 4).
Figure 2. Readmission by LOSa.
Relationship between LOSa from initial hospitalization and readmission rate at (A) 7 days (p<0.0001), (B) 14 days (p<0.0001) and (C) 30 days (p<0.0001) with associated fitted robust linear regression and R2 correlation value.
Figure 3. Readmission by LOSa for surgical patients.
Relationship between LOSa from initial hospitalization for patients discharged from a surgical service and readmission rate at (A) 7 days (p<0.0001), (B) 14 days (p<0.0001) and (C) 30 days (p<0.0001) with associated fitted robust linear regression and R2 correlation value.
Figure 4. Readmission by hospital volume.
Relationship between LOSa from initial hospitalization and readmission rate at (A) 7 days (p<0.0001) and (B) 30 days (p<0.0001) for the entire cohort, or for just those patients discharged from a surgical service (C, D). The associated fitted robust linear regression is shown as is the R2 correlation value for each relationship.
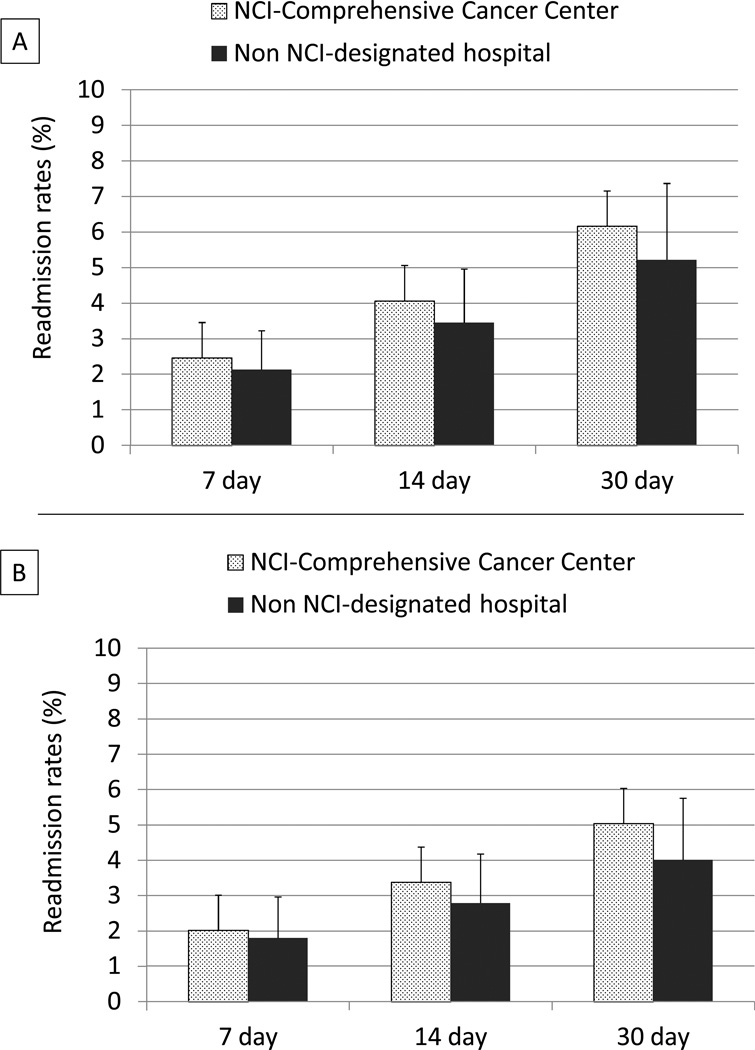
NCI-designated comprehensive cancer centers are a small component of the nation’s academic medical centers recognized by the federal government. To determine whether these centers provided care that led to differences in readmission rates, NCI-designated comprehensive cancer centers (n=35) were compared to the remainder of the UHC cohort (n=199). Although NCI-designated comprehensive cancer centers may treat patients with more co-morbidities and have a significantly larger volume of cancer-specific hospital admissions, there was no difference in LOSa for the initial hospitalization for the entire group (p=0.21) or surgical patients (p=0.37) (data not shown). Interestingly, readmission rates at 7, 14, and 30 days were higher at NCI-designated cancers centers compared to non-designated centers (2.5%, 4.1%, and 6.2% versus 2.2%, 3.5%, and 5.2%, respectively; p<0.0001 for all) (Fig. 5A). These differences persisted when just the surgical patients were similarly analyzed for 7-, 14-, and 30-day readmissions (2.0%, 3.38%, and 5.0% versus 1.8%, 2.8%, and 4.0%, respectively; p=0.02, p=0.0002, p<0.0001) (Fig. 5B). Multivariable analysis revealed that both hospital case volume and discharging physician specialty (medical vs. surgical) were statistically significant predictors of readmission rates within 30 days (p-value < 0.0001 for both); however neither LOSa of the initial admission nor NCI designation was associated with 30 day readmission rate. (Table 1).
Figure 5. Readmission by NCI-Comprehensive Cancer Center Status.
(A) Higher median rates of readmission at 7, 14, and 30-days (2.03%, 3.38%, and 5.05%) were observed for cancer patients treated at NCI-designated comprehensive cancer centers compared to non-designated centers (1.80% 2.79%, and 4.01%) (p<0.0001 for all time points by two-sided Wilcoxon rank-sum test). These findings persisted following evaluation of patients discharged from a surgical service (B) (p=0.02, p=0.0002, p<0.0001 by two-sided Wilcoxon rank-sum test). Error bars represent one standard deviation.
Table 1.
Result of multivariable robust regression analysis for the relationship between readmission rate within 30 days, and the 4 predictors: adjusted LOS (based on < 1, ≥1), hospital case volume (broken into quartiles with 1st quartile reflecting the lowest volume [971 cases/year] and 4th quartile reflecting the highest volume [8227 cases/year), medical vs. surgical service of index hospitalization, and NCI-cancer center (Yes/No).
| Parameter | Variable | Estimate | 95% Confidence Limits | P-value |
|---|---|---|---|---|
| Adjusted LOS | ≥ 1 vs. 1 | 0.0020 | −0.0005–0.0045 | 0.1236 |
| Hospital Case Volume | <0.0001 | |||
| 1st vs. 2nd quartile | 0.0136 | 0.0102–0.0170 | ||
| 1st vs. 3rd quartile | 0.0201 | 0.0166–0.0237 | ||
| 1st vs. 4th quartile | 0.0205 | 0.0166–0.0245 | ||
| Service Specialty | Medical vs. Surgical | 0.0225 | 0.0202–0.0248 | < 0.0001 |
| NCI-designation | Yes vs. No | 0.0026 | −0.0009–0.0061 | 0.1441 |
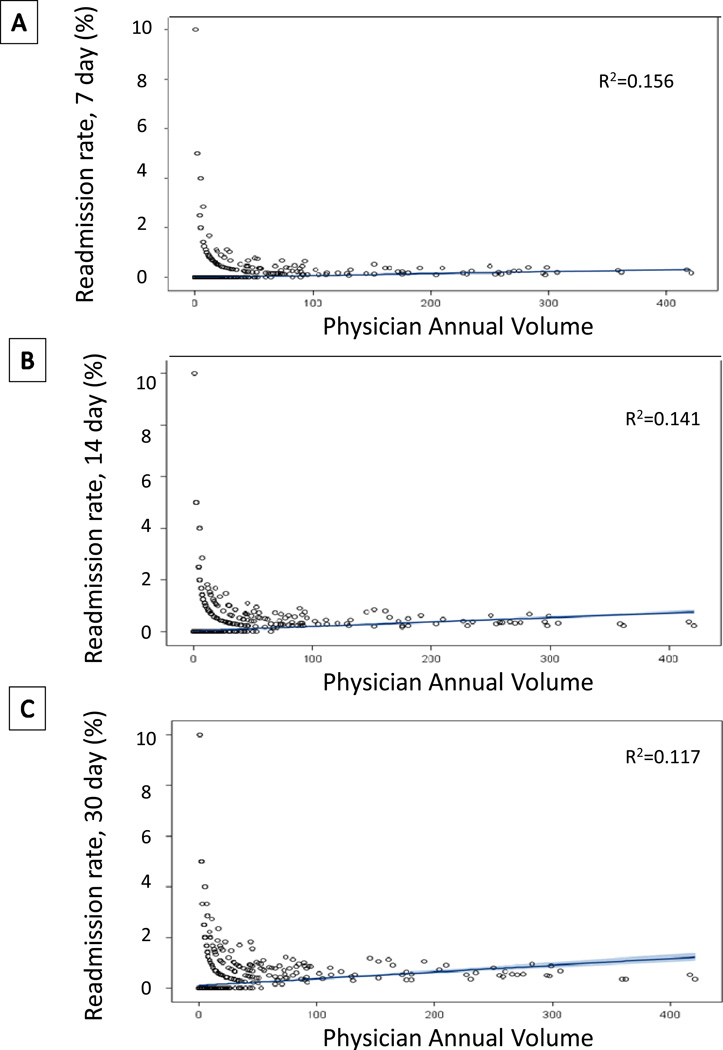
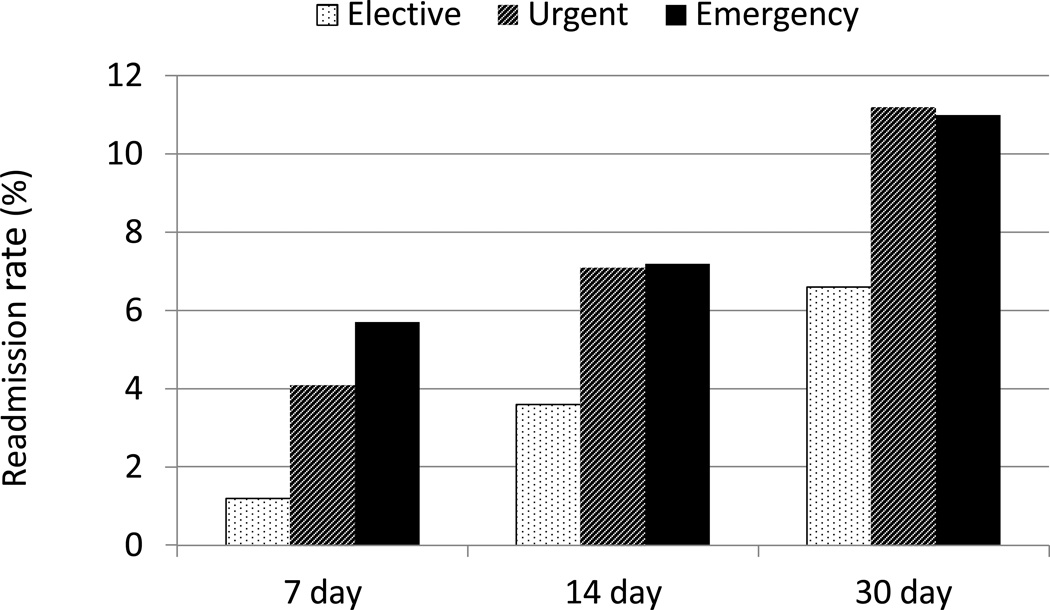
To try to identify more detailed variables that are related to cancer readmissions, we examined our UCDMC institutional data; and a total of 2,517 cancer patients were hospitalized between January 2010 and September 2013. Seven-, fourteeen-, and thirty-day readmission rates were 3.4%, 5.8%, 9.4%. The relationship between the annual admitting volume of each physician (n=488) and readmission rates was examined; contrary to our belief, increased physician volume was statistically associated with higher readmission rates (p<0.0001 at 7, 14, and 30 days). However, the relationship poorly correlated at any timepoint of readmission (R2=0.156, R2=0.141, R2=0.117) (Fig. 6). Additional patient-related variables were examined for any potential relationship with readmission. Of the 2,505 index cancer patients admissions to UCDMC (12 excluded due to uncertain admission status), 917 (36.6%) were elective admissions, 612 (24.3%) were urgent, and 977 (38.8%) were emergency admissions. Readmission rates at 7, 14, and 30 days were lowest when the initial hospital admission was elective (1.2%, 3.6%, and 6.7%). Both urgent and emergency admissions had higher rates of readmission than patients admitted electively at 7, 14, and 30 days (p<0.0001, p=0.001, and p=0.001, respectively) (Fig. 7). Site of malignancy was another important variable associated with readmission rates. Highest rates of readmission at all timepoints were seen for hepatobiliary, musculoskeletal, and otolaryngology/ENT (p=0.0003 at 7 days, p<0.0001 at 14 and 30 days). The lowest readmission rates were seen for breast, genitourinary, and gynecologic malignancies (Table 2). Interestingly, gastrointestinal malignancies had one of the lowest 7 day readmission rates (1.4%), but the highest 30 day readmission rate (19.3%) due to the development of postoperative infectious complications more than 7 days after discharge. Also interesting to note is that approximately half of the 30 day readmissions for musculoskeletal and hepatic/pancreatic/biliary occurred within 7 days of discharge from the initial hospitalization.
Figure 6. Readmission by physician volume.
Relationship between individual physician volume and (A) 7 day, (B) 14 day, and (C) 30day readmission rates at UCDMC. The associated fitted robust linear regression is shown as is the R2 correlation value for each relationship.
Figure 7. Readmission by type of admission for index hospitalization.
Readmission rate at 7 days, 14 days, and 30 days following index hospitalization classified as elective, urgent, or emergency among the 2505 patients hospitalized at UCMDC.
Table 1.
Comparison of readmission rates among 11 APR-DRG diagnoses of index hospitalization among 2517 cancer patients admitted to UCDMC.
| Readmission rate | ||||
|---|---|---|---|---|
| Discharge Diagnosis | No. | 7-day | 14-day | 30-day |
| Gynecologic | 228 | 0.9% | 1.3% | 4.8% |
| CNS neoplasms | 168 | 1.2% | 4.2% | 7.1% |
| GI | 218 | 1.4% | 12.4% | 19.3% |
| Breast | 308 | 1.6% | 2.9% | 7.1% |
| GU | 301 | 1.7% | 3.0% | 4.0% |
| Respiratory | 166 | 1.8% | 4.2% | 9.0% |
| ENT | 55 | 1.8% | 9.1% | 16.4% |
| Hematologic | 767 | 4.2% | 6.8% | 9.8% |
| MSK | 116 | 6.0% | 9.5% | 12.9% |
| HPB | 190 | 6.8% | 8.4% | 12.6% |
CNS - Central nervous system; GI – gastrointestinal; GU – genitourinary; ENT – ear, nose and throat; MSK – musculoskeletal; HPB – hepatic, pancreatic, biliary.
We then focused on readmissions within 7 days of discharge for surgical patients in order to determine potentially preventable readmissions within this group as these patients were re-admitted quickly. The most common readmission diagnoses at 7 days were infectious causes (46.3%), nausea/vomiting/dehydration (26.8%), pain (6.1%), and thromboembolism (4.9%). At 30 days, these were again the most common reasons for related readmissions, although percentages varied slightly at 51.2% for infectious causes, 14.7% for nausea/vomiting/dehydration, 3.3% for pain, and 2.8% for thromboembolism.
DISCUSSION
With potentially huge financial consequences associated with higher-than-expected readmission rates, the identification of clear, modifiable risk factors is critical. Cancer patients are at increased risk for readmission,3, 15 and the present study investigates readmission in this group at an institutional and national level in order to better elucidate potential areas for quality improvement. We identified a minority of patients re-admitted with potentially preventable conditions such as nausea, vomiting, dehydration, and pain. However, the majority of factors associated with readmission identified in this study cannot be modified. Most importantly, several traditional markers of quality care were actually associated with increased readmission rates.
Almost one third of patients readmitted in our study were rehospitalized within 7 days of discharge. When looking at the reasons for readmission, 33% of these were due to potentially preventable problems such as nausea, vomiting, dehydration, and post-operative pain. We deemed this group to be potentially preventable based on a suspected need for improved patient care coordination as a means to provide care to these patients in the absence of readmission. It is possible that closer discharge follow-up, establishment of observational units for administration of fluids, or enhanced palliative care programs may have prevented these readmissions. While we focused on these diagnoses as potentially preventable at our institution, the need for standardized definitions in this field of study is critical. Efforts to enhance coordinated care will be critical at both an institutional and national level in order to provide quality care in the absence of readmission.
We saw no relationship between a shorter index hospitalization LOS and increased readmission rates in our study, but actually saw an increased risk for readmission with longer LOS. This relationship has been previously seen7, 12, 16, 17 and is likely due to the complex relationship between post-operative complications, LOS, and readmission. While clinical care pathways have proven as an effective means to reduce costs and LOS,18, 19 an essential component of these pathways needs to be a focus on addressing complications and patients at risk for readmission.11, 20 Evaluation of such interventions has yet to be shown. These questions are essential to address with further research, as the financial impact of reducing even a small proportion of these readmissions would be significant.
While we identified several factors associated with higher readmission rates, the vast majority of these were non-modifiable. Discharge from a medical service was associated with high risk for readmission. Additionally, both emergency surgery and complex procedures have been demonstrated to be associated with increased complications as well as readmissions, but these are simply not factors that can be adjusted.3, 12, 21 The decision to readmit patients suffering from such a complication should not be penalized if it is the best option for appropriate care. Brown, et al discusses the notion of failed discharge versus early rescue with a review of regional data that revealed that the surgeon with the lowest mortality rate after colon resection also had the highest readmission rate.22 This observation was born out in a larger study of Medicare pancreaticoduodenectomy patients showing that hospitals with the lowest readmission rates also had the highest mortality rates; interestingly, these were the low volume hospitals.23
The concept of readmission as a “rescue” is important. Perhaps the decision to rehospitalize patients reflects good judgment rather than poor care, and other authors have acknowledged that perhaps readmission after surgery is unavoidable.24 Our analysis revealed that markers of quality care such as higher physician volume and hospital volumes are associated with increased readmission rates. Furthermore, NCI-designated comprehensive cancer centers, centers ranking in the top 4 percent of the cancer centers in the United States and known as leaders in quality care for cancer patients, also demonstrated increased readmission rates. Perhaps focusing on readmission rates as a quality metric is misguided. While the financial and patient costs of readmission are clear, it is not obvious that readmission is an indicator of poor care; in fact, it may be just the opposite.
The study is limited by the retrospective nature as well as the known pitfalls of using an administrative database.25, 26 Administrative databases have been criticized as an inaccurate source of capturing events related to quality due to the abstracting derived from billing records.27 Since hospital readmission is a patient care event that is not dependent on interpretation due to medical abstracting, the UHC database is appropriate for analyses evaluating such quality metrics as readmission. However, the inability of the UHC to capture readmissions to outside facilities is a significant limitation of this study, and it is likely to disproportionately affect those communities with higher market competition and some high volume centers. Given that high volume centers already had the highest rates of readmission, it is possible that the differences demonstrated in this study are even more drastic than we appreciated. Second, the UHC database represents only university-based hospitals with an inherent bias towards education and quality improvement; therefore, these findings may not be generalizable to all hospitals. However, the foundation of this database is to provide benchmark data for member hospitals in order to improve quality care, and we were attempting to show nationwide trends for readmission in a complex group of patients. The study includes both medical and surgical cancer patients, and also separately analyzes all surgical patients recognizing that surgical patients are, indeed, a very different subgroup of patients. All findings were consistent across the entire group and for surgical patients alone. Finally, we chose to focus on related readmissions. These rates are significantly lower than all-cause readmissions, but represent those readmissions most likely to be influenced by interventions to reduce readmissions. The all-cause readmission rates from this analysis were similar to those seen in other studies.
In conclusion, readmission is a complex issue with a myriad of interacting variables. In a large review of readmission rates for cancer patients, we identified only a small percentage of potentially preventable readmission diagnoses; however, given the exorbitant costs of readmission, even slight reductions in rehospitalization rates will have a significant impact on patient quality of life as well as reductions in healthcare costs. The majority of variables associated with higher readmission rates (emergency status, site of malignancy, readmission for care of post-operative complications) were not modifiable. Most importantly, care at high volume centers and NCI-designated cancer centers were not associated with decreased readmissions. These findings lead us to conclude that perhaps readmission is not an appropriate measure of quality care.
Acknowledgments
The project was supported by the National Center for Advancing Translational Sciences, National Institutes of Health, through grant number UL1 TR000002. The content is solely the responsibility of the authors and does not necessarily represent the official views of the NIH.
Footnotes
Presented at the 134thAmerican Surgical Association Annual Meeting in Boston, MA on April 11, 2014.
The authors declare no conflicts of interest.
References
- 1.Jencks S, Williams MV, Coleman EA. Rehospitalizations among patients in the medicare fee-for-service program. New Engl J Med. 2009;360:1418–1428. doi: 10.1056/NEJMsa0803563. [DOI] [PubMed] [Google Scholar]
- 2.Centers for Medicare and Medicaid Services. Readmissions reduction program. [Accessed March 25, 2014]; Available at: http://www.cms.gov/Medicare/Medicare-Fee-for-Service-Payment/AcuteInpatientPPS/Readmissions-Reduction-Program.html#.
- 3.Kassin M, Owen RM, Perez SD, et al. Risk factors for 30-day hospital readmission among general surgery patients. J Am Coll Surg. 2012;215:322–330. doi: 10.1016/j.jamcollsurg.2012.05.024. [DOI] [PMC free article] [PubMed] [Google Scholar]
- 4.Greenblatt DY, Weber SM, O'Connor ES, et al. Readmission after colectomy for cancer predicts one-year mortality. Ann Surg. 2010;251:659–669. doi: 10.1097/SLA.0b013e3181d3d27c. [DOI] [PMC free article] [PubMed] [Google Scholar]
- 5.Kohlnhofer BM, Tevis SE, Weber SM, et al. Multiple complications and short length of stay are associated with postoperative readmissions. Am J Surg. 2014;207:449–456. doi: 10.1016/j.amjsurg.2013.10.022. [DOI] [PMC free article] [PubMed] [Google Scholar]
- 6.Ahmad SA, Edwards MJ, Sutton JM, et al. Factors influencing readmission after pancreaticoduodenectomy: a multi-institutional study of 1302 patients. Ann Surg. 2012;256:529–537. doi: 10.1097/SLA.0b013e318265ef0b. [DOI] [PubMed] [Google Scholar]
- 7.Emick DM, Riall TS, Cameron JL, et al. Hospital readmission after pancreaticoduodenectomy. J Gastrointest Surg. 2006;10:1243–1252. doi: 10.1016/j.gassur.2006.08.016. discussion 1252–1253. [DOI] [PubMed] [Google Scholar]
- 8.Enestvedt CK, Diggs BS, Cassera MA, et al. Complications nearly double the cost of care after pancreaticoduodenectomy. Am J Surg. 2012;204:332–338. doi: 10.1016/j.amjsurg.2011.10.019. [DOI] [PubMed] [Google Scholar]
- 9.Handy JR, Jr, Denniston K, Grunkemeier GL, et al. What is the inpatient cost of hospital complications or death after lobectomy or pneumonectomy? Ann Thorac Surg. 2011;91:234–238. doi: 10.1016/j.athoracsur.2010.08.043. [DOI] [PubMed] [Google Scholar]
- 10.Hemmila MR, Jakubus JL, Maggio PM, et al. Real money: complications and hospital costs in trauma patients. Surgery. 2008;144:307–316. doi: 10.1016/j.surg.2008.05.003. [DOI] [PMC free article] [PubMed] [Google Scholar]
- 11.Brown E, Yang A, Canter R, et al. Outcomes of pancreaticoduodenectomy: Where should we focus our efforts to improve outcomes? JAMA Surg. 2014 doi: 10.1001/jamasurg.2014.151. Accepted for publication August 2013. [DOI] [PubMed] [Google Scholar]
- 12.Reddy DM, Townsend CM, Jr, Kuo YF, et al. Readmission after pancreatectomy for pancreatic cancer in Medicare patients. J Gastrointest Surg. 2009;13:1963–1974. doi: 10.1007/s11605-009-1006-4. discussion 1974–1975. [DOI] [PMC free article] [PubMed] [Google Scholar]
- 13.McAleese P, Odling-Smee W. The effect of complications on length of stay. Ann Surg. 1994;220:740–744. doi: 10.1097/00000658-199412000-00006. [DOI] [PMC free article] [PubMed] [Google Scholar]
- 14.Yohai VJ. High breakdown-point and high efficiency robus estimates for regression. Ann Stat. 1987;15:642–656. [Google Scholar]
- 15.Ji H, Abushomar H, Chen XK, et al. All-cause readmission to acute care for cancer patients. Healthc Q. 2012;15:14–16. doi: 10.12927/hcq.2013.23044. [DOI] [PubMed] [Google Scholar]
- 16.Gawlas I, Sethi M, Winner M, et al. Readmission after pancreatic resection is not an appropriate measure of quality. Ann Surg Oncol. 2013;20:1781–1787. doi: 10.1245/s10434-012-2763-y. [DOI] [PubMed] [Google Scholar]
- 17.Martin RCG, Brown R, Puffer L, et al. Readmission rates after abdominal surgery. Ann Surg. 2011;254:591–597. doi: 10.1097/sla.0b013e3182300a38. [DOI] [PubMed] [Google Scholar]
- 18.Porter G, Pisters PWT, Mansyur C, et al. Cost and utilization impact of a clinical pathway for patients undergoing pancreaticoduodenectomy. Ann Surg Oncol. 2000;7:484–489. doi: 10.1007/s10434-000-0484-0. [DOI] [PubMed] [Google Scholar]
- 19.Vanounou T, Pratt W, Fischer JE, et al. Deviation-based cost modeling: a novel model to evaluate the clinical and economic impact of clinical pathways. J Am Coll Surg. 2007;204:570–579. doi: 10.1016/j.jamcollsurg.2007.01.025. [DOI] [PubMed] [Google Scholar]
- 20.Keller DS, Swendseid B, Khorgami Z, et al. Predicting the unpredictable: comparing readmitted versus non-readmitted colorectal surgery patients. Am J Surg. 2014;207:346–351. doi: 10.1016/j.amjsurg.2013.09.008. [DOI] [PubMed] [Google Scholar]
- 21.Schneider EB, Hyder O, Wolfgang CL, et al. Patient readmission and mortality after surgery for hepato-pancreato-biliary malignancies. J Am Coll Surg. 2012;215:607–615. doi: 10.1016/j.jamcollsurg.2012.07.007. [DOI] [PMC free article] [PubMed] [Google Scholar]
- 22.Brown RE, Qadan M, Martin RC, 2nd, et al. The evolving importance of readmission data to the practicing surgeon. J Am Coll Surg. 2010;211:558–560. doi: 10.1016/j.jamcollsurg.2010.06.006. [DOI] [PubMed] [Google Scholar]
- 23.Hyder O, Dodson RM, Nathan H, et al. Influence of patient, physician, and hospital factors on 30-day readmission following pancreatoduodenectomy in the United States. JAMA Surg. 2013;148:1095–1102. doi: 10.1001/jamasurg.2013.2509. [DOI] [PMC free article] [PubMed] [Google Scholar]
- 24.Kent T, Sachs TE, Callery MP, et al. Readmission after major pancreatic resection: a necessary evil? J Am Coll Surg. 2011;213:515–523. doi: 10.1016/j.jamcollsurg.2011.07.009. [DOI] [PubMed] [Google Scholar]
- 25.Dibrito S, Makary MA. Forecasting hospital readmission after surgery: data and the hard-to-measure role of culture. JAMA Surg. 2014 Mar 5; doi: 10.1001/jamasurg.2014.10. [Epub ahead of print]. [DOI] [PubMed] [Google Scholar]
- 26.Hechenbleikner EM, Makary MA, Samarov DV, et al. Hospital readmission by method of data collection. J Am Coll Surg. 2013;216:1150–1158. doi: 10.1016/j.jamcollsurg.2013.01.057. [DOI] [PubMed] [Google Scholar]
- 27.Lawson EH, Louie R, Zingmond DS, et al. A comparison of clinical registry versus administrative claims data for reporting of 30-day surgical complications. Ann Surg. 2012;256:973–981. doi: 10.1097/SLA.0b013e31826b4c4f. [DOI] [PubMed] [Google Scholar]


