

SUMMARY
Eradication of the latent HIV reservoir remains a major barrier to curing AIDS. However, the mechanisms that direct viral persistence in the host are not well understood. Studying a model system of post-integration latency, we found that proviral integration into the actively transcribed host genes led to transcriptional interference caused by the elongating RNA polymerase II transcribing through the viral promoter. As a result, physical exclusion of the pre-initiation complex formation on the 5’LTR promoted the silencing of HIV transcription. Furthermore, we demonstrated that this block could be counteracted through inhibiting the upstream transcription or cooperatively activating transcription initiation and elongation from the 5’LTR. Importantly, using a novel PCR-based method, we detected significant levels of host transcription through the 5’LTR in HIV-infected primary CD4+ T cells. Collectively, our findings suggest that transcriptional interference contributes greatly to HIV latency and has to be considered when attempting to purge the latent reservoir.
INTRODUCTION
The latent HIV reservoir, which represents only a small pool of infected cells, is a key obstacle to curing AIDS (Finzi et al., 1999). Replication-competent viruses persist mostly in resting CD4+ T lymphocytes, where they fail to be recognized and eliminated by the immune system (Chun et al., 1995). To eradicate this reservoir, several studies have attempted to reactivate viral replication and thus render previously latent HIV susceptible to highly active antiretroviral therapy (HAART). However, the eradication of the latent reservoir has not been accomplished to date. Thus, it is of great importance to understand the mechanisms underlying viral persistence in the host.
One of the major contributors to the latent reservoir is a post-integration form of latency occurring when CD4+ T cells revert to a resting memory state after the integration of the viral genome into the host genome (Finzi et al., 1999). This latency is achieved and maintained by several mechanisms (Lassen et al., 2004; Contreras et al., 2006) with predominant ones operating at the level of transcription. A key obstacle to efficient transcription initiation and elongation is establishment of a repressive chromatin environment in the form of two nucleosomes occupying the position in the 5’ long terminal repeat (LTR) and adjacent sequence (Verdin et al., 1993). This repressive chromatin is maintained in part by the recruitment of histone deacetylases (HDACs) via a variety of DNA-bound transcription factors such as p50:p50 homodimers (Williams et al., 2006). However, reversion to a permissive chromatin by HDAC inhibitors is not sufficient for productive transcription. Indeed, the latter requires the recruitment of activators such as NF-κB, Sp1 and NFAT, which promote various steps of HIV transcription. Among them, the role of NF-κB has been studied extensively. Upon stimulation with different agents such as TNF-α and PMA, NF-κB binds with a strong affinity to B sites on the 5’LTR in its active heterodimeric form (RelA:p50), displaces p50:p50-HDAC1 complexes and governs the pre-initiation complex (PIC) formation and successful transcription initiation (Williams et al., 2006). At this stage, an initiating RNA polymerase II (RNAPII) is phosphorylated on the Serine 5 in the heptapeptide repeats of its C-terminal domain (CTD), but does not elongate into the gene effectively. Notably, inefficient elongation occurs despite the modest recruitment of the positive transcription elongation factor b (P-TEFb) that phosphorylates Serine 2 in the heptapeptide repeats of CTD (Peterlin and Price, 2006). Nevertheless, a sustained activation of NF-κB leads to the synthesis of viral transactivator of transcription (Tat), which effectively recruits P-TEFb to the close proximity of CTD, resulting in increased phosphorylation of the CTD and productive transcription elongation. Thus, repressive chromatin environment, lack of host transcription factors (TFs) and/or of viral Tat could contribute to post-integration latency.
In addition to the well-recognized mechanisms directing HIV latency, it has been reported that the HIV genome is preferentially integrated into the actively transcribed host genes (Han et al., 2004; Lewinski et al., 2005; Schroder et al., 2002). These integrations could lead to occurrences of a phenomenon called transcriptional interference (TI), where an ongoing transcription from a host promoter would prevent PIC assembly on the 5’LTR, thus interfering with the viral transcription. A similar situation has been demonstrated in the case of HIV LTRs, where active transcription originating from the 5’LTR interferes with transcription from the 3’LTR (Cullen et al., 1984; Greger et al., 1998). Notably, the finding that HIV-based genome frequently integrated into highly expressed genes in the infected Jurkat T cells led investigators to propose that TI could play an important role in silencing viral transcription (Lewinski et al., 2005). In support of this hypothesis is analysis of viral integration sites in resting CD4+ T cells from patients on HAART. Strikingly, 93% of proviruses resided within transcription units in these cells (Han et al., 2004). Thus, TI might be the major contributor in the establishment of HIV latency. Nevertheless, a direct demonstration for the role of TI in antagonizing HIV transcription has not been provided.
In this study, we employed an established Jurkat CD4+ T-cell model (J-Lat cells) of post-integration latency (Jordan et al., 2003) to directly assess the importance of TI in silencing of the HIV provirus. Our results indicate that active transcription from the upstream host gene interferes with transcription from the 5’LTR in two cell lines investigated. Moreover, a detailed analysis of these host transcripts enabled us to devise a strategy for detecting TI independently of viral integration sites. Using this method, we demonstrate significant levels of active host transcription at the 5’LTR in infected primary CD4+ T cells. Finally, we established approaches towards counteracting TI to eliminate the latent viral reservoir. Thus, we provide evidence for an essential role of TI in HIV latency.
RESULTS
HIV genome is integrated into an actively transcribed gene in J-Lat 9.2 and 15.4 cells
To explore the role of TI in promoting a post-integration form of HIV latency, we took advantage of J-Lat cells, which exhibit very low to undetectable levels of viral gene expression (Jordan et al., 2003). These cells contain a full-length HIV provirus in which the nef gene has been replaced with the GFP gene to allow detection of active transcription from the 5’LTR by measuring levels of GFP epifluorescence (Jordan et al., 2003). First, our sequence analyses revealed the sites of integration of the HIV genome in three cell lines, J-Lat 9.2, 15.4 and 8.4. In the first one, the provirus resides in the protein phosphatase 5 (PP5) gene and in the second one in the SUMO-activating enzyme subunit 2 (UBA2) gene. In the J-Lat 8.4 cells, the provirus is integrated in the DNA helicase V gene. All three genes are constitutively transcribed, suggesting that their expression may interfere with the viral transcription. However, only in J-Lat 9.2 and 15.4 cell lines, transcription from the host promoter has the same directionality as the one from the viral 5’LTR. Although TI between two promoters occurs independently of their orientation, it can be monitored more easily when transcriptional directionalities are the same. Hence, we focused on the J-Lat 9.2 and 15.4 cell lines, and used the J-Lat 8.4 cell line as a control throughout our study.
In J-Lat 9.2 cells, the provirus resides in intron 4 of the PP5 gene (PP5* allele) and in J-Lat 15.4 cells in intron 6 of the UBA2 gene (UBA* allele). Thus, both cell lines contain one allele that corresponds to the wild type gene (PP5 or UBA2) and the other allele that contains the provirus (PP5* or UBA2*) (Figures 1A and 1C). Next, we determined transcriptional activities originating from the PP5 or UBA2 promoter. To detect transcription originating from the wild type and provirus-containing alleles, we performed Northern blotting using the total RNA from J-Lat 9.2 or 15.4 cells and a DNA probe complementary to the PP5 or UBA2 mRNA upstream of the viral integration site (Figures 1B and 1D). As expected, we detected two bands with the RNA from both cell lines (Figures 1B and 1D, lane 1). Whereas the longer band represents the full-length wild type mRNA, the shorter one represents the truncated mRNA (*mRNA) transcribed from the PP5* or UBA2* promoter. In contrast, only the full-length PP5 or UBA2 mRNA was detected in the control J-Lat 8.4 cell line (Figures 1B and 1D, lane 2). We conclude that transcription originating from the PP5 or UBA2 promoter in J-Lat 9.2 and 15.4 cells, respectively, results in a full-length and a truncated transcript, owing to the integration of the HIV provirus into the actively transcribed PP5 or UBA2 gene.
Figure 1. Transcription of a gene with the integrated viral genome in J-Lat 9.2 and 15.4 cells yields two different forms of mRNA.
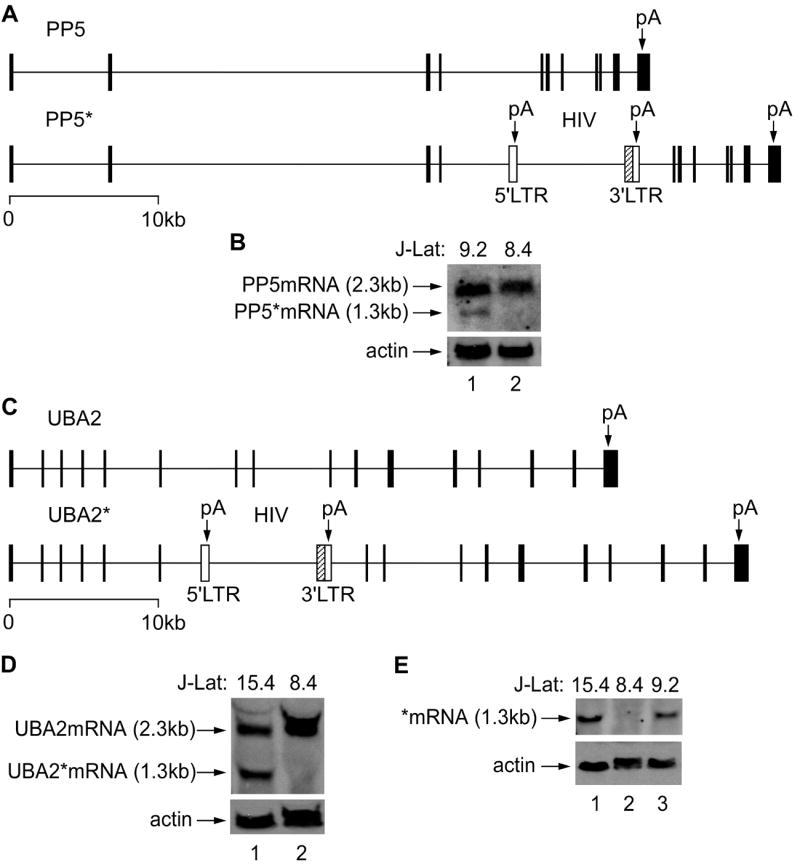
(A and C) Schematic representations of the PP5 and UBA2 genes on the two homologous chromosomes in J-Lat 9.2 or 15.4 cells. The provirus is integrated into the intron 4 of the PP5 gene (PP5* allele) or the intron 6 of the UBA2 gene (UBA2* allele) as indicated. Black rectangles depict exons and white rectangles depict the 5’ and 3’LTRs. In the HIV genome, the nef gene was replaced by the GFP gene as indicated by the hatched rectangle. Vertical arrows mark pA sites in the PP5 or UBA2 gene and the two viral LTRs. (B and D) Northern blotting was used to detect PP5 transcripts from exon 1 to 3 and UBA2 transcripts from exon 2 to 6. PP5mRNA and UBA2mRNA represent the full length mRNA, whereas PP5*mRNA and UBA2*mRNA correspond to the truncated mRNA transcribed from the PP5* and UBA2* alleles, respectively. (E) Northern blotting was used to detect transcripts containing the LTR (-281 to +3) in J-Lat 9.2 and 15.4 cells. Actin levels were used for loading controls in Northern blotting and J-Lat 8.4 cells were used as the control.
Truncated PP5 and UBA2 transcripts in J-Lat 9.2 and 15.4 cells contain proviral sequences and terminate in the 5’LTR
To verify if PP5 and UBA2 *mRNAs contain the HIV LTR sequence, we first performed Northern blotting with a DNA probe containing a part of the LTR. Indeed, we detected single bands of equal size to the previously observed *mRNAs in the RNA from J-Lat 9.2 and 15.4 cells (Figure 1E), suggesting that they represented transcripts originating from the host promoter and terminating in the 5’LTR. To further confirm this possibility, we performed reverse transcription followed by PCR (RT-PCR) using the total RNA from J-Lat 9.2 or 15.4 cells and two different primer pairs (Figures 2A and 2B). For each cell line, the pairs shared the same forward primer (P1 or U1) but differed in the reverse primer, one of which annealed to the region upstream (H1) and another downstream (H2) of the polyA (pA) site in the 5’LTR (Figures 2A and 2B, top). Importantly, this analysis yielded a fragment only with the P1/H1 (Figure 2A, lanes 1 and 2) or U1/H1 (Figure 2B, lanes 1 and 2) primer pair, demonstrating the termination of the *mRNA at the pA site in the 5’LTR. Sequencing of the amplified fragments confirmed the presence of 5’LTR in *mRNAs and revealed the usage of a cryptic splice acceptor site in the intron preceding the 5’LTR in both cell lines (Figures S1A and S1B).
Figure 2. The host-viral chimeric transcripts in J-Lat 9.2 and 15.4 cells terminate in the 5’LTR.

(A and B) RT-PCR was used to determine the termination of PP5 *mRNA and UBA *mRNA. Schematic representations of a part of the PP5* and UBA2* alleles with numbered exons (black rectangles) and 5’LTR (white rectangle) are presented on top. The vertical line in the 5’LTR represents the pA site. Primers used for amplification of cDNA are marked above the schemes. Bottom panels show agarose gels with fragments obtained by RT-PCR of the same sample. The primer pairs used are denoted above the lanes. (C) Schematic representations of a part of the PP5* and UBA2* alleles with numbered exons (black rectangles) and 5’LTR (white rectangle). Primers used for amplification of cDNA corresponding to the truncated transcripts are marked above the scheme. (D) Ratio between *mRNA and HIV (Rev) mRNA in untreated (left panel) or between HIV (Rev) mRNA and *mRNA in TNF-α-treated (right panel) J-Lat 9.2 (white bars) and 15.4 (black bars) cells determined by RT-DqPCR. Primers amplifying cDNA for truncated transcripts are denoted for each of the two cell lines, Rev cDNA was amplified with primer pair H13/H14 (Table S1). Values of amplified cDNA were normalized to DNA amplified with the same primer pair. The results for three RT-DqPCR assays are shown ± SEM.
To further characterize *mRNAs, we determined the ratio between levels of *mRNA and viral mRNA in J-Lat 9.2 or 15.4 cells. To do so, we designed a modified quantitative RT-PCR (RT-qPCR). Our modified method, herein named RT-DNA-qPCR (RT-DqPCR), is based on the fact that molar ratio between two genes in genomic DNA is equal (see Supplemental text 1). In short, RT-DqPCR involves normalization of values obtained by amplification of cDNA to those obtained by amplification of genomic DNA with the same primer pair that anneals to the respective exon sequences. Therefore, the method enables us to directly compare the levels of two different transcripts. Importantly, using RT-DqPCR we detected approximately 40- or 58-fold more *mRNA than viral mRNA in J-Lat 9.2 or 15.4 cells, respectively (Figure 2D, bars 1 and 2). In contrast, this ratio became reversed upon partial activation of viral transcription with TNF-α. The ratios between the viral mRNA and *mRNA were 38- and 11-fold in J-Lat 9.2 and 15.4, respectively (Figure 2D, bars 3 and 4). Using RT-DqPCR we further assessed levels of *mRNA relative to those of full-length mRNA (Figure S2). Interestingly, levels of PP5 *mRNA were 10-times lower compared to levels of PP5 mRNA (Figure S2A), whereas levels of UBA2 *mRNA were slightly higher than those of UBA2 mRNA (Figure S2B). The dissimilar ratios could be attributed to different transcript stabilities, which might reflect the nature of processing of nascent mRNAs. Also, differential expression from the two homologous alleles is possible. Nevertheless, these results are in a good agreement with the findings obtained by Northern blotting (Figures 1B and 1D). Taken together, the *mRNAs represent the host-viral chimeric transcripts, which contain sequences of the 5’LTR and terminate at its pA signals. In addition, RT-DqPCR revealed that levels of *mRNA exceed those of viral mRNA in unstimulated cells, suggesting that transcription originating from the host genes in J-Lat 9.2 and 15.4 cells may antagonize proviral transcription.
Host-viral chimeric transcripts are indicators of active transcription upstream of the 5’LTR
Existence of the host-viral chimeric transcripts that originate from a host promoter and include 5’LTR could be useful for identifying ongoing transcription upstream of the 5’LTR independently of the site of viral integration. Therefore, we next devised an assay, which determines the ratio between transcripts containing LTR sequences and those containing sequences present solely in the viral mRNA. For these experiments, we employed RT-DqPCR and used primer pairs specific for LTR-containing and Rev- or Env-containing transcripts. To ensure that we measured the same viral transcripts, all primer pairs were selected after the last splice donor in the HIV nascent mRNA. The values obtained with the LTR-specific primers represent a sum of transcripts originating from the host promoter and of viral transcripts, which also contain LTR sequence at their 3’ ends. Therefore, the measured ratio corresponds to the equation a+b/b, where ‘a’ is the number of host-viral chimeric transcripts and ‘b’ the number of viral transcripts (see Supplemental text 2). First, we determined this ratio in J-Lat 9.2 or 15.4 cells and found that it was 35 or 55 (Figure 3A, bars 1-4). These results were comparable to the ones obtained with primers specific for *mRNA (Figure 2D, bars 1 and 2). In contrast, this ratio was 1 in TNF-α treated cells (Figure 3A, bars 5-8), indicating that approximately 20% activation of viral transcription (see Figure 7) already precludes detection of the upstream transcription. This finding is not surprising, as we demonstrated that there is 11-fold or 38-fold more viral mRNA than *mRNA in TNF-α treated cells (Figure 2D, bars 3 and 4). Predictably, our control experiments demonstrate that the ratio between the Rev- and Env-containing transcripts was 1 in untreated and TNF-α-treated cells (Figure 3A, bars 9-12).
Figure 3. Identification of upstream transcription in J-Lat cells and HIV-infected primary CD4+ T cells.

(A) Ratios between mRNAs containing LTR and Rev or Env in untreated (the two upper left panels) or TNF-α-treated (the two upper right panels) J-Lat 9.2 (white bars) and 15.4 (black bars) cells as determined by RT-DqPCR. Lower panels represent ratios between mRNAs containing Rev and Env in untreated (left) or TNF-α-treated (right) cells. (B) Ratios between mRNAs containing LTR and Rev in J-Lat 15.4 cells with different levels of viral expression (designated as percentage of GFP+) as determined by RT-DqPCR. (C) Viral production as assessed by p24 ELISA of HIV-infected CD4+ T cells (black bar) and activated PBLs (white bar). The results for two assays are shown ± SEM. (D) Ratios between mRNAs containing LTR and Rev (left panel), LTR and Env (middle panel) and Rev and Env (right panel) in CD4+ T cells (black bars) and activated PBLs (white bars) as determined by RT-DqPCR. In the RT-DqPCR assays, the values of amplified cDNA were normalized to DNA amplified with the same primer pair (H11/H12 in LTR, H13/H14 in Rev, H15/H16 in Env (Table S1)). The results for three RT-DqPCR assays are shown ± SEM.
Figure 7. TNF-α together with HMBA or Tat act synergistically to activate transcription from the 5’LTR.

(A-C) Histograms obtained with FACS analysis of J-Lat 9.2, 15.4 and 8.4 cells as indicated on top of the panels. The numbers represent the percentage of GFP-positive cells indicated by horizontal lines. Cells were untreated (mock), treated with HMBA (HMBA), expressed Tat (Tat), treated with TNF-α alone (TNF-α) or in combination with HMBA (HMBA + TNF-α) as shown on top of each histogram. The last histograms on the right represent cells expressing Tat that were treated with TNF-α (Tat + TNF-α). (D) Relative quantity of PP5* (left panel) and UBA2* (right panel) mRNAs in untreated (mock, white bars), TNF-α-treated (black bars), HMBA + TNF-α treated (hatched bars) and cells expressing Tat that were treated with TNF-α (checkered bars) as determined using RT-qPCR. Primer pairs are denoted above the diagrams. Values in different samples were normalized to the GAPDH signal. The results for three RT-qPCR assays are shown ± SEM.
Next, we determined a threshold, at which upstream transcription is still detectable using this method. Here, we used J-Lat 15.4 cells with different levels of viral expression obtained by mixing the cDNA of untreated and TNF-α-treated cells (Figures 3B and S3). We decided to use this cell line because of a smaller ratio between HIV transcripts and *mRNA in these cells compared to those in J-Lat 9.2 cells (Figure 2D, bars 3 and 4). The ratio between LTR- and Rev-containing transcripts increased with the decreased levels of viral expression consistent with the rational equation (see Supplemental text 2), and revealed that the upstream transcription can be detected when viral transcription is activated for less than 10% (Figure 3B). Taken together, the host-viral chimeric transcripts could be exploited for identification of the host transcription upstream of 5’LTR. In addition, because of the presence of 5’LTR in these transcripts, the upstream transcription could be detected independently of the viral integration site.
HIV-infected primary CD4+ T cells contain significant levels of transcription upstream of the 5’LTR
To identify transcription upstream of the 5’LTR in HIV-infected peripheral blood lymphocytes (PBLs), we used the above method. After activation of HIV-infected PBLs with IL-2 and PHA, we rested them and isolated CD4+ T cells. We measured viral production from activated PBLs and CD4+ T cells using p24 ELISA and found that activated PBLs produced 5.5-fold more viral particles (Figure 3C, bars 1 and 2). Although CD4+ T cells still produced modest levels of viruses, we detected the transcription upstream of the 5’LTR as the ratio between LTR-containing and Rev- or Env-containing transcripts was 2 (Figure 3D, bars 1 and 3). This ratio corresponded to the one in J-Lat 15.4 cells with about 2% of activated viral transcription (Figure 3B). On the contrary, the upstream transcription was not detected in activated PBLs (Figure 3D, bars 2 and 4). As expected, the ratio between Rev-and Env-containing transcripts was 1 in CD4+ T cells as well as in activated PBLs (Figure 3D, bars 5 and 6). We conclude that HIV-infected primary CD4+ T cells contain significant levels of the host-viral chimeric transcripts. Because they indicate active transcription upstream of the 5’LTR, these findings suggest that viral transcription is subjected to TI in these cells.
Transcriptional interference by the actively transcribed host gene reverses viral transcription from the 5’ to the 3’LTR
Next, we investigated in detail how active transcription of the upstream PP5* or UBA2* gene affects transcription from both LTRs of the HIV provirus in J-Lat 9.2 or 15.4 cells (Figure 4). In the case of active provirus, transcription originating from the 5’LTR interferes with transcription from the 3’LTR (Cullen et al., 1984). Thus, we hypothesized that a similar TI is taking place in latent J-Lat 9.2 and 15.4 cell lines, in which the ongoing transcription from the host gene would interfere with transcription from the 5’LTR. Consequently, due to the premature termination of *mRNA at the pA site in the 5’LTR, the 3’LTR would no longer be subjected to TI and could thus be activated. To test this hypothesis, we activated viral gene expression with Tat or TNF-α and compared transcription from both LTRs to corresponding transcription in untreated J-Lat 9.2 (Figure 4A) or 15.4 (Figure 4B) cells. We measured the activation of transcription using RT-qPCR with two primer pairs that distinguish transcripts from the two LTRs. Indeed, whereas the expression of Tat resulted in only 3-fold amplification of transcripts initiating from the 5’LTR (Figures 4A and 4B, bar 2), treatment of the cells with TNF-α resulted in 100- or 200-fold amplification (Figures 4A and 4B, bar 3) when compared to that from untreated cells. In sharp contrast, both activators stimulated transcription from the 3’LTR profoundly in both cell lines. Tat expression resulted in 100- or 250-fold amplification of transcripts initiating from the 3’LTR (Figures 4A and 4B, bar 5) and exposure of cells to TNF-α led to 1300- or 3000-fold amplification (Figures 4A and 4B, bar 6). The same primer pairs (H5/H2 and H5/P3 or H6/U3) were used in RT-PCR to estimate absolute levels of transcription in unstimulated and TNF-α treated J-Lat 9.2 (Figure S4A) and 15.4 (Figure S4B) cells. This confirmed that TNF-α treatment activated the 3’LTR to a larger extend than the 5’LTR (Figures S4A and S4B, compare lanes 1 and 2 to lanes 3 and 4). In addition, we performed RT-PCR with primer pairs that amplify longer fragments from transcripts originating from the 3’LTR (Figures 4C and 4D). Here, no transcripts whatsoever could be detected in unstimulated cells, whereas significant levels were detected in TNF-α treated cells (Figures 4C and 4D, lanes 1 and 2). Importantly, treatment of cells with TNF-α did not affect levels of PP5 or UBA2 transcripts (Figures 4C and 4D, lanes 3 and 4). Sequencing of these fragments revealed a cryptic splice donor site in the 3’LTR in both cell lines (Figures S1C and S1D). Therefore, these transcripts contain a part of the 3’LTR followed by the host gene exons spliced at the appropriate splice sites. Taken together, our results indicate that the latent provirus in J-Lat 9.2 and 15.4 cells is subjected to TI. Active transcription from the upstream gene interferes with transcription from the 5’LTR. As a consequence, transcription can be activated from the 3’LTR. Thus, TI mediated by active transcription from a host gene switches transcriptional activation from the 5’ to the 3’ LTR. Importantly, both LTRs are silent in unstimulated cells, suggesting that although the 3’LTR is probably not affected by the upstream transcription, cells have to be stimulated for the productive transcription from this promoter.
Figure 4. Upstream transcription interferes with the activation of 5’ but not 3’LTR in J-Lat 9.2 and 15.4 cells.
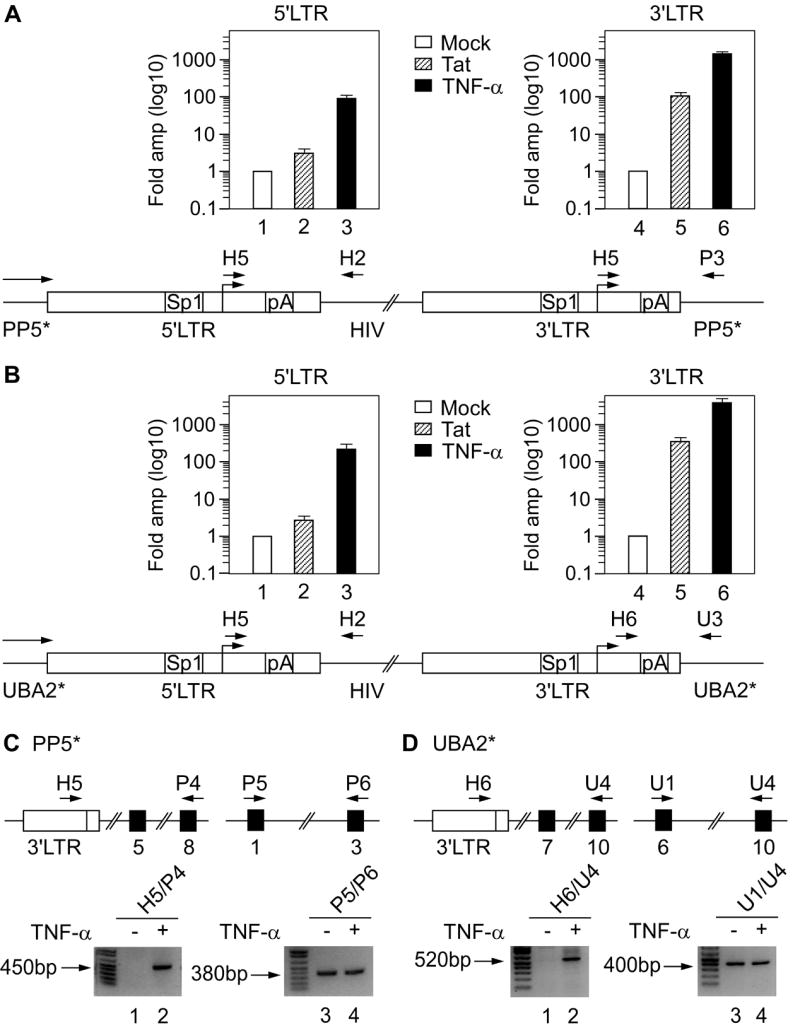
(A and B) Top: cells were electroporated with Tat (hatched bars) or induced with TNF-α (black bars) and activation of transcription from the 5’ (left diagram) and the 3’LTR (right diagram) was determined using RT-qPCR. Levels represent fold amplification of cDNA from treated (Tat or TNF-α) cells over cDNA from untreated (mock, white bars). Values in different samples were normalized to the GAPDH signal. The results for four RT-qPCR assays are shown ± SEM. Schematic representations of the HIV genome in J-Lat 9.2 and 15.4 cells are presented below the RT-qPCR data. On both LTRs, binding sites for Sp1 and pA sites are marked. Horizontal arrow above the gene designates ongoing transcription from the PP5* and UBA2* promoters. Primers used for amplification of transcripts from the 5’ and 3’LTRs are marked above the scheme. (C and D) RT-PCR was used to determine activation of transcription from the 3’LTR. Schematic representations of a part of the PP5* and UBA2* alleles with numbered exons (black rectangles) and the 3’LTR (white rectangle) are presented on top. Primers used for amplification of fragments from cDNA are marked above the scheme. Bottom panels show agarose gels with fragments obtained by RT-PCR from untreated (-) or TNF-α treated (+) J-Lat 9.2 and 15.4 cells. The primer pairs used are written above the lanes. The right panels represent a normalizing control.
Occupancy of Sp1 at the 5’ but not 3’ LTR is decreased by the actively transcribed PP5* gene
To demonstrate further TI of the 5’ LTR by the actively transcribed host gene, we examined the occupancy of Sp1 and RNAPII at both LTRs in J-Lat 9.2 cells using quantitative chromatin immunoprecipitation (ChIP-qPCR) assay (Figure 5). This analysis was performed on samples from untreated cells or cells treated with TNF-α. To distinguish between Sp1 and RNAPII occupancies at the two LTRs, two discriminating primer pairs were used for amplifying fragments of the 5’ and the 3’LTR, respectively (Figure 5A, H7/H8 and H7/P7). As a control, the occupancy of the same proteins was determined at the PP5*/5’LTR junction and in the coding region of the viral genome (Figure 5A, P2/H3 and H9/H10).
Figure 5. Occupancy of Sp1, RNAPII, PS2-RNAPII and PS5-RNAPII on the HIV genome confirms that transcription from the 5’LTR is inhibited.

(A) Schematic representation of the HIV genome in intron 4 of the PP5* gene. Primers used for amplification of immunoprecipitated DNA with qPCR are depicted with arrows above the gene. (B-E) ChIP-qPCR was performed on non-treated (mock, white bars) and TNF-α treated (black bars) J-Lat 9.2 cells. Results are presented as fold enrichment over a no antibody control. DNA was immunoprecipitated with antibodies against Sp1, RNAPII, PS2-RNAPII and PS5-RNAPII as depicted above the panels. The primer pairs used are indicated below the bars. The results for at least three ChIP-qPCR assays are shown ± SEM.
First, we performed ChIP-qPCR with an antibody against Sp1. We decided to follow the Sp1 gene occupancy because previous studies demonstrated its role in the stimulation of PIC assembly and transcription initiation (Jones et al., 1986). More importantly, studies of the two consecutive HIV-derived promoters that were integrated into the genome of HeLa cells have established that Sp1 binding to the downstream promoter was reduced only in the presence of the active transcription originating from the upstream promoter (Greger et al., 1998). Therefore, the lack of Sp1 promoter occupancy can be used as a marker for TI. Indeed, no Sp1 could be detected at the 5’LTR in unstimulated cells. On the contrary, there was about 3.5-fold enrichment of this protein at the 3’LTR under the same conditions (Figure 5B, bars 3 and 7). Moreover, TNF-α stimulation led to a 4-fold and 7-fold enrichment of Sp1 occupancy at the 5’ and 3’LTR, respectively (Figure 5B, bars 4 and 8). The enrichment of Sp1 was promoter-specific as we failed to detect any Sp1 at the PP5*/5’LTR junction or in the coding region of the HIV genome (Figure 5B, bars 1, 2, 5 and 6). Thus, the absence of Sp1 at the 5’LTR in untreated cells is a result of TI due to the actively transcribed PP5* gene. The finding that TNF-α stimulation increased the levels of Sp1 not only at the 3’ but also at the 5’LTR indicates that stimulating PIC assembly on the latter promoter can partially antagonize TI caused by the ongoing transcription of the upstream host gene.
Elongating RNAPII from the actively transcribed PP5* gene interferes with initiating RNAPII only at the 5’LTR, which is opposed by treatment with TNF-α
Next, we followed the occupancy of total RNAPII, RNAPII phosphorylated on Ser2 of the CTD (PS2-RNAPII), and RNAPII phosphorylated on Ser5 of the CTD (PS5-RNAPII) at the same genomic regions under the same cell culture conditions as above. Levels of PS2-RNAPII indicate the presence of elongating RNAPII, whereas levels of PS5-RNAPII mark initiating RNAPII. We first detected a modest enrichment of total RNAPII at both LTRs (7-fold and 3-fold, respectively) in unstimulated cells (Figure 5C, bars 3 and 7). This RNAPII occupancy was further increased in TNF-α treated cells with a significantly greater enrichment at the 3’ LTR (30-fold and 255-fold, respectively; Figure 5C, bars 4 and 8). Critically, in unstimulated cells, PS2-RNAPII occupied only the 5’LTR (10-fold enrichment; Figure 5D, bars 3 and 7). Furthermore, at the 5’LTR these levels were increased minimally upon TNF-α stimulation. However, the stimulation led to a dramatic (52-fold) enrichment of PS2-RNAPII at the 3’LTR (Figure 5D, bars 4 and 8). Unlike the PS2-RNAPII occupancy, almost no PS5-RNAPII could be detected at the 5’LTR in unstimulated cells. In contrast, PS5-RNAPII was present at the 3’LTR in unstimulated cells (11-fold enrichment) (Figure 5E, bars 3 and 7). Finally, both LTRs exhibited further enrichments of PS5-RNAPII upon TNF-α treatment (25-fold and 80-fold, respectively; Figure 5E, bars 4 and 8). Predictably, about 6-fold and 8-fold enrichment of RNAPII and PS2-RNAPII was observed at the PP5*/5’LTR junction in unstimulated cells (Figure 5C, bars 1 and 2), which was slightly decreased in TNF-α-treated cells (Figure 5D, bars 1 and 2). A minimal (2-3-fold) enrichment of RNAPII as well as its phosphorylated forms was observed in the coding region in unstimulated cells and TNF-α stimulation led to the significant enrichment of RNAPII (15-fold), PS2-RNAPII (8-fold) and PS5-RNAPII (17-fold) (Figures 5C-5E, bars 5 and 6). Taken together, these ChIP-qPCR results suggest strongly that a hallmark of the latent provirus in J-Lat 9.2 cells is TI of the 5’LTR caused by the transcription of the host PP5* gene. This interfering transcription results in the lack of Sp1 and the presence of the elongating RNAPII at the 5’LTR. Moreover, TI can be partially rescued by TNF-α stimulation, as documented by the appearance of Sp1 and initiating RNAPII at the 5’LTR. The slight enrichment of the RNAPII in the coding region of unstimulated cells might be attributed to some read-through transcription from the host gene. However, the enrichments of RNAPII, PS2-RNAPII and PS5-RNAPII in TNF-α stimulated cells are still much greater at the 3’LTR. These results are understandable since TNF-α activates the 5’LTR in only 20% of cells (Figure 7). Consequently, the 3’LTR is not interfered by transcription from the 5’LTR in 80% of cells and can be therefore activated by TNF-α.
Inhibition of transcription from the PP5* gene decreases transcriptional interference and cooperates with TNF-α for stimulating HIV gene expression
Thus far, we have established that TI by the actively transcribed host gene prevents the transcription from the 5’LTR and that TNF-α partially reverses this effect. Next we asked whether a decrease of TI through inhibiting transcription from the promoter upstream of the 5’LTR would increase transcriptional activation from this LTR (Figure 6). Here we focused on J-Lat 9.2 cell line, since it has been demonstrated that transcription from the PP5 promoter could be reduced through inhibiting estrogen receptor (ER) (Urban et al., 2001). Therefore, we established J-Lat 9.2 and control J-Lat 8.4 cell lines that stably express miRNA-adapted shRNA (shRNAmir) against the ERα mRNA (J-Lat 9.2 shER and J-Lat 8.4 shER, respectively). In both J-Lat shER cell lines, the ERα levels were decreased by 70-80% (Figure 6A) without affecting levels of GAPDH protein. Expectedly, this decrease led to a 50% inhibition of the PP5 mRNA levels in the both cell lines (Figure 6B). To examine how a decrease of transcription originating from the PP5* promoter influenced transcription from the 5’LTR, we compared GFP expression of parental and J-Lat shER cells using fluorescence activated cell sorting (FACS). As expected, no GFP-expressing cells could be detected in untreated cells (Figures 6C-6F, mock). About 20% of cells turned GFP-positive in TNF-α-treated J-Lat 9.2 cells (Figure 6C, TNF-α). Importantly, the inhibition of PP5 transcription synergized with TNF-α to increase further the number of GFP-expressing cells to 44% (Figure 6D, TNF-α). On the other hand, the number of GFP-expressing cells remained the same (13%) in J-Lat 8.4 and J-Lat 8.4 shER cell lines (Figures 6E and 6F, TNF-α), ruling out any nonspecific effect of shRNA against the ERα mRNA. In addition, a control shRNA in the J-Lat 9.2 cells did not result in increased transcription from the 5’LTR (data not presented). Thus, the inhibition of transcription from the PP5* gene decreased TI of the 5’LTR, which resulted in its increased activation by TNF-α.
Figure 6. Knockdown of ERα in J-Lat 9.2 cells inhibits transcription from the PP5* promoter and activates transcription from the 5’LTR.

(A) Western blotting of endogenous ERα and GAPDH in cellular lysates from J-Lat 9.2, J-Lat 9.2 shER and a control J-Lat 8.4 shER cells as indicated. (B) RT-qPCR with a primer pair amplifying exon 2 of the PP5 gene was used to measure the inhibition of transcription from the PP5 promoter in J-Lat (white bars) and J-Lat shER (black bars) cells as indicated. (C-F) Histograms obtained with FACS of untreated (mock) and TNF-α-treated cells. Cell lines used are indicated on top of the panels. Numbers represent the percentage of GFP-positive cells indicated by horizontal lines.
Cooperative activation of the 5’LTR overcomes transcriptional interference and stimulates HIV gene expression
The results above illustrated that the inhibition of an active host transcription upstream of the 5’LTR led to the increased transcriptional activation of the provirus. In contrast to the viral integration-specific transcriptional activation in J-Lat 9.2 cells, we next undertook an approach that should be independent of the host gene into which the provirus integrated and could be applied in general for the reactivation of proviruses from latency (Figure 7). We reasoned that a potent activation of the 5’LTR could overcome the upstream transcription and thus effectively counteract TI. To activate 5’LTR, we employed TNF-α, HMBA and Tat. Whereas TNF-α stimulates potently transcription initiation, the latter two activate transcription elongation by releasing and/or recruiting the active P-TEFb, respectively (Contreras et al., 2007; Wei et al., 1998). For these experiments, we again used the J-Lat 9.2, 15.4 and 8.4 cell lines and followed the activation of viral transcription by counting GFP-expressing cells using FACS. First, we found that HMBA treatment alone led to a minimal increase in the number of GFP-expressing cells and, as expected, about 20% of TNF-α treated cells became GFP positive (Figures 7A-7C, HMBA and TNF-α). However, a combined treatment of cells with HMBA and TNF-α resulted in a much greater activation of viral transcription (50-60% of GFP-expressing cells) in the cell lines tested (Figures 7A-7C, HMBA + TNF-α). Of note, a combinatorial treatment with HMBA and TNF-α also increased viral production in HIV-infected resting CD4+ T cells (Figure S5, bar 2). Next, we tested the effect of Tat on transcription of the provirus. In agreement with the results in Figure 4, expression of Tat alone exerted minimal stimulatory effect on the 5’LTR (Figures 7A-7C, Tat). However, in combination with TNF-α, Tat expression activated viral transcription greatly (70-80% of GFP-expressing cells) in all three cell lines (Figures 7A-7C, Tat + TNF-α). We further investigated the ability of PMA, another known stimulator of viral transcription, to activate the 5’LTR in latent J-Lat cells. Treatment of cells with PMA stimulated transcriptional activation form HIV promoter similarly to TNF-α (Figure S6A-C). Finally, we compared levels of *mRNA in J-Lat 9.2 and 15.4 cells treated with TNF-α alone (Figure 7D, bars 2 and 6) and in combination with HMBA (Figure 7D, bars 3 and 7) or Tat (Figure 7D, bars 4 and 8) to levels in untreated cells (Figure 7D, bars 1 and 5). Interestingly, *mRNA levels decreased concomitantly with the increased activation of transcription from the 5’LTR in both cell lines. Probably, the formation of the PIC at the 5’LTR prevents elongating complex from the upstream promoter to transcribe through this LTR, resulting in the degradation of non-polyadenylated transcripts. Taken together, synergistic activation of the viral promoter overcomes the upstream host transcription and thus effectively counteracts TI.
DISCUSSION
Understanding mechanisms that direct the establishment and maintenance of HIV latency is critical for developing strategies to eradicate the viral reservoir. In this study, we found that TI is an important mechanism that contributes to viral latency in latent J-Lat cells as well as in HIV-infected primary CD4+ T cells.
Numerous studies have established that a plethora of transcriptional and post-transcriptional mechanisms contribute to the post-integration form of viral latency (Lassen et al., 2004). In addition, it was reported that the HIV genome integrates frequently in transcription units (Han et al., 2004; Lewinski et al., 2005). In the present work, we extended this knowledge by a detailed analysis of how TI impacts viral transcription in latent cells. Although TI occurs regardless of the orientation of the two promoters, we studied TI phenomenon in two J-Lat cell lines with the same orientation of the host and viral promoters, which allowed us to detect and analyze truncated transcripts originating from a host promoter and transcribing through the 5’LTR. The use of cryptic splice acceptor sites in the introns upstream of the 5’LTR in both cell lines resulted in inclusion of the LTR sequence in the processed transcript. Since cryptic splice sites are plentiful in genes and they are recognized by the spliceosome when there is no stronger splice site downstream of them, such aberrant splicing probably takes place in many cases of integration of the viral genome. On one hand, these transcripts reflected active transcription upstream of the provirus in both J-Lat cell lines. On the other hand, LTR sequence in the transcripts enabled us to use them as indicators of TI in general. Importantly, with this approach we detected TI in primary CD4+ T cells. The limitations of the method applied here are that proviral expression has to be low for the host transcription at the 5’LTR to be detectable. Since primary CD4+ T cells used here produced modest levels of viral particles, we speculate that average levels of host-viral chimeric transcripts in these cells exceed those in the two J-Lat cell lines. These results thus suggest that TI plays a key role in primary CD4+ T cells.
In J-Lat 9.2 and 15.4 cells, the host-viral chimeric transcripts terminated at the pA site in the 5’LTR, but transcripts initiating at the host promoter and terminating at the pA site in the 3’LTR were not observed. Overall, these results are in agreement with studies demonstrating that pA site in the 5’LTR is recognized if it is at sufficient distance from the transcription start site (Cherrington and Ganem, 1992). Nevertheless, we do not exclude the possibility of some transcription through the provirus, since slight enrichment of elongating RNAPII in the HIV coding region of transcriptionally silent J-Lat 9.2 cells was observed using ChIP-qPCR assay. However, transcription originating from the host promoter, ignoring pA sites in both LTRs and consequently splicing out the provirus together with the host intron (Han et al., 2004) is most likely less frequent than transcription terminating in the 5’LTR. In the support of this notion is also our finding that the latent provirus exhibited active transcription originating from the 3’ but not 5’LTR upon Tat expression as demonstrated with RT-qPCR. Also, the 3’LTR was considerably more responsive to TNF-α stimulation than the 5’LTR, suggesting that the latter LTR is much stronger subjected to TI. Even if there is transcription from host gene ‘reading through’ both LTRs in some latent cells, this does not diminish the impact of TI on the 5’LTR.
In addition to the transcript analysis from both LTRs, a series of ChIP-qPCR assays in J-Lat 9.2 cells complemented nicely the RT-qPCR results. Accordingly, the active PP5* transcription coincided with the lack of Sp1 and with the occurrence of elongating RNAPII at the interfered 5’LTR in unstimulated cells. Furthermore, TNF-α stimulation led to the appearance of Sp1 and initiating RNAPII on the 5’LTR and additional enrichments of initiating and elongating RNAPII on the 3’LTR. These effects are most likely achieved through the activation of NF-κB, which stimulates several steps of viral transcription including the PIC formation, transcription initiation and transcription elongation. Thus, our findings lead us to propose a model for TI, in which the elongating RNAPII transcribes the host gene through the 5’LTR, thus physically antagonizing the formation of the PIC on the viral promoter. Hence, effective transcription from the 5’LTR cannot ensue and consequently, the integrated virus remains dormant. In contrast, we demonstrated that TI could be counteracted by specific inhibition of the upstream transcription or by cooperative activation of transcription initiation and elongation from the 5’LTR by the viral and host TFs. In the latter scenario, we envision that RNAPII initiating from the viral promoter competes successfully with the RNAPII that is elongating through the 5’LTR. Because the potent activation of the 5’LTR is independent on the integration site of the provirus, it could be in principle applied generally for overcoming TI. This would lead to the reactivation of the latent viruses, which is generally assumed to be a prerequisite for its elimination from the host (Finzi et al., 1999).
Given the preferential integrations of viral genomes into active transcription units, we hypothesize that TI is a widespread event, which silences expressions of the invading proviruses. Notably, TI could operate in concert with already established mechanisms. For example, its occurrence could be instrumental in resting cells, where key host and viral TFs are limiting and thus cannot overcome TI for effective viral gene expression. In addition, it is possible that the presence of a repressive deacetylated chromatin that has been observed on the 5’LTR (Van Lint et al., 1996) as well as methylated DNA in this region (Bednarik et al., 1987) is a consequence of an elongating RNAPII from the actively transcribed host gene that ‘reads through’ the viral promoter. Indeed, studies in yeast have determined that the eviction of histones in front of the elongating RNAPII is followed by their rapid deposition behind RNAPII, where they further undergo deacetylation by the cotranscriptionally recruited HDACs (Kaplan et al., 2003; Li et al., 2007). This mechanism helps to ensure that cryptic promoters within the transcribed genes do not function as transcription start sites. Therefore, 5’LTRs of the proviruses that are integrated within actively transcribed host genes may represent just such cryptic promoters that need to be silenced. Thus, multiple mechanisms operating at the level of gene expression act cooperatively to establish and maintain HIV latency.
In conclusion, our study reveals that TI represents a key mechanism that antagonizes proviral gene expression to promote the latency of HIV. Furthermore, it demonstrates several means that could be used to counteract TI for reactivating latent HIV. Future mechanistic studies linking TI and other transcriptional and post-transcriptional blocks will yield a broader picture of all critical factors responsible for the post-integration latency. These investigations could be of help in devising strategies for eradicating the latent reservoir.
EXPERIMENTAL PROCEDURES
Cell lines and culture conditions
J-Lat cells and the corresponding sequences flanking the viral genomes were kindly provided by Drs Eric Verdin and Dwayne A. Bisgrove. Cells were grown in RPMI containing penicillin (100 IU/ml), streptomycin (100 μg/ml), and 10% FBS at 37 °C with 5% CO2. Phoenix cells were grown in DMEM containing penicillin (100 IU/ml), streptomycin (100 μg/ml), and 10% FBS at 37°C with 5% CO2.
Northern blotting
Total RNA was isolated from the cell pellet (~3 × 10⁷) with TRIzol reagent (Sigma) according to the manufacturer’s instructions. Northern blotting was performed using NorthernMax kit (Ambion) according to the manufacturer’s instructions. The probes were amplified from cDNA synthesized with MMLV reverse transcriptase (Invitrogen). PCR products were labeled with BioNick Labelling System (Invitrogen).
Stimulation of J-Lat cells and detection of activated cells by flow cytometry
Tat protein was expressed from pCDNA3 vector using electroporation of 107 J-Lat cells resuspended in 300 μl of PBS at 230 V and 950 microfarads in Gene Pulser II Electroporator (Bio-Rad). J-Lat cells were treated with 20 ng/ml TNF-α, 10 mM HMBA, 100 nM PMA or 100 nM TSA (all Sigma-Aldrich) for 24 h and analyzed on FACSCalibur flow cytometer (Becton Dickinson) using CellQuestPro software. The results were analyzed with WinMDI 9.2 software.
Reverse transcription followed by PCR
Total RNA isolation and reverse transcription was performed as described above. For RT-PCR and RT-qPCR cDNA was synthesized with random hexamer primers (Invitrogen) and for RT-DqPCR analyzing HIV transcripts with a specific primer (H17, Table S1). Genomic DNA for RT-DqPCR was isolated using DNeasy Blood and Tissue Kit (Qiagen). Fold change between levels of two transcripts was obtained by normalizing values of amplified cDNA to amplification of genomic DNA and determining ratio between the two normalized values. From TNF-α treated cells, RNA was isolated 24 h after beginning of the treatment and from cells expressing Tat protein, 48 h after electroporation. qPCR was performed in the presence of SyBr Green (Sigma). Primer sequences and positions are in Table S1.
Construction of stably transfected cell lines
LMP vectors (Open Biosystems) expressing two microRNA-adapted shRNAs (shRNAmir) against the ERα and a control shRNAmir (Table S1) were transfected into Phoenix cells with FuGENE6 reagent (Roche Applied Science). 48 h post-transfection, supernatant was collected and used for the infection of J-Lat 9.2 or 8.4 cells. 24 h post-infection, cells with the integrated shRNAmir were selected with puromycin.
Western blotting
107 J-Lat or J-Lat shER cells were lysed in 0.8 ml of lysis buffer A (10 mM Tris-HCl [pH 7.4], 150 mM NaCl, 2 mM EDTA, 1% NP-40, 0.1% protease inhibitor) for 40 min at 4°C. Proteins in the lysates were separated on SDS-PAGE electrophoresis. Western blotting was performed according to the standard protocols with antibodies described in Table S2.
ChIP-qPCR assays
Cross-linking was achieved by incubating 7 × 10⁷ J-Lat 9.2 cells in 1% formaldehyde in medium for 10 min at room temperature. Cross-linking reactions were stopped by addition of glycine to a final concentration of 0.125 M. Cells were then pelleted in a conical tube and washed with cold phosphate-buffered saline. Sonication and immunoprecipitation were performed using Chromatin Immunoprecipitation (ChIP) Assay Kit (Upstate) according to the manufacturer’s instructions. Antibodies used are presented in Table S2. As negative control, normal rabbit or mouse serum (Sigma-Aldrich) was used. Appropriate primer pairs (Table S1) were used to amplify specific DNA fragments with qPCR. Results were normalized to input DNA and presented as fold enrichment over a no-antibody (serum) control.
Infection of PBLs and isolation of resting CD4+ T cells
PBMCs were isolated from buffy coats of healthy HIV negative donors in a Ficoll density gradient (Pharmacia). Isolation of PBLs, their activation with PHA/IL-2 and infection with HIV-1LAI followed by isolation of resting CD4+ T cells by negative selection using magnetic beads (Invitrogen) was performed as previously described (Contreras et al., 2007). Resting CD4+ T cells were treated with 1mM HMBA and 10 ng/ml TNF-α for 24 h. Viral release in the supernatant was quantified by p24 ELISA (PerkinElmer).
Supplementary Material
Acknowledgments
We thank Drs Eric Verdin and Dwayne A. Bisgrove for providing us with the J-Lat cell lines, Dr Matjaz Barboric for assistance with writing the manuscript, and members of Peterlin laboratory for helpful discussions and continuous support. This work was supported by grants from the National Institutes of Health to B.M.P. (AI49104 and AI058708). T.L. was supported in part by a grant from the National Institutes of Health, University of California San Francisco–Gladstone Institute of Virology & Immunology Center for AIDS Research, P30 AI27763.
Footnotes
Publisher's Disclaimer: This is a PDF file of an unedited manuscript that has been accepted for publication. As a service to our customers we are providing this early version of the manuscript. The manuscript will undergo copyediting, typesetting, and review of the resulting proof before it is published in its final citable form. Please note that during the production process errors may be discovered which could affect the content, and all legal disclaimers that apply to the journal pertain.
References
- Bednarik DP, Mosca JD, Raj NB. Methylation as a modulator of expression of human immunodeficiency virus. J Virol. 1987;61:1253–1257. doi: 10.1128/jvi.61.4.1253-1257.1987. [DOI] [PMC free article] [PubMed] [Google Scholar]
- Cherrington J, Ganem D. Regulation of polyadenylation in human immunodeficiency virus (HIV): contributions of promoter proximity and upstream sequences. Embo J. 1992;11:1513–1524. doi: 10.1002/j.1460-2075.1992.tb05196.x. [DOI] [PMC free article] [PubMed] [Google Scholar]
- Chun TW, Finzi D, Margolick J, Chadwick K, Schwartz D, Siliciano RF. In vivo fate of HIV-1-infected T cells: quantitative analysis of the transition to stable latency. Nat Med. 1995;1:1284–1290. doi: 10.1038/nm1295-1284. [DOI] [PubMed] [Google Scholar]
- Contreras X, Barboric M, Lenasi T, Peterlin BM. HMBA releases P-TEFb from HEXIM1 and 7SK snRNA via PI3K/Akt and activates HIV transcription. PLoS Pathog. 2007;3:1459–1469. doi: 10.1371/journal.ppat.0030146. [DOI] [PMC free article] [PubMed] [Google Scholar]
- Contreras X, Lenasi T, Peterlin BM. HIV latency: present knowledge and future directions. Future Virol. 2006;1:733–745. doi: 10.2217/17460794.1.6.733. [DOI] [PMC free article] [PubMed] [Google Scholar]
- Cullen BR, Lomedico PT, Ju G. Transcriptional interference in avian retroviruses--implications for the promoter insertion model of leukaemogenesis. Nature. 1984;307:241–245. doi: 10.1038/307241a0. [DOI] [PubMed] [Google Scholar]
- Finzi D, Blankson J, Siliciano JD, Margolick JB, Chadwick K, Pierson T, Smith K, Lisziewicz J, Lori F, Flexner C, et al. Latent infection of CD4+ T cells provides a mechanism for lifelong persistence of HIV-1, even in patients on effective combination therapy. Nat Med. 1999;5:512–517. doi: 10.1038/8394. [DOI] [PubMed] [Google Scholar]
- Greger IH, Demarchi F, Giacca M, Proudfoot NJ. Transcriptional interference perturbs the binding of Sp1 to the HIV-1 promoter. Nucleic Acids Res. 1998;26:1294–1301. doi: 10.1093/nar/26.5.1294. [DOI] [PMC free article] [PubMed] [Google Scholar]
- Han Y, Lassen K, Monie D, Sedaghat AR, Shimoji S, Liu X, Pierson TC, Margolick JB, Siliciano RF, Siliciano JD. Resting CD4+ T cells from human immunodeficiency virus type 1 (HIV-1)-infected individuals carry integrated HIV-1 genomes within actively transcribed host genes. J Virol. 2004;78:6122–6133. doi: 10.1128/JVI.78.12.6122-6133.2004. [DOI] [PMC free article] [PubMed] [Google Scholar]
- Jones KA, Kadonaga JT, Luciw PA, Tjian R. Activation of the AIDS retrovirus promoter by the cellular transcription factor. Sp1 Science. 1986;232:755–759. doi: 10.1126/science.3008338. [DOI] [PubMed] [Google Scholar]
- Jordan A, Bisgrove D, Verdin E. HIV reproducibly establishes a latent infection after acute infection of T cells in vitro. Embo J. 2003;22:1868–1877. doi: 10.1093/emboj/cdg188. [DOI] [PMC free article] [PubMed] [Google Scholar]
- Kaplan CD, Laprade L, Winston F. Transcription elongation factors repress transcription initiation from cryptic sites. Science. 2003;301:1096–1099. doi: 10.1126/science.1087374. [DOI] [PubMed] [Google Scholar]
- Lassen K, Han Y, Zhou Y, Siliciano J, Siliciano RF. The multifactorial nature of HIV-1 latency. Trends Mol Med. 2004;10:525–531. doi: 10.1016/j.molmed.2004.09.006. [DOI] [PubMed] [Google Scholar]
- Lewinski MK, Bisgrove D, Shinn P, Chen H, Hoffmann C, Hannenhalli S, Verdin E, Berry CC, Ecker JR, Bushman FD. Genome-wide analysis of chromosomal features repressing human immunodeficiency virus transcription. J Virol. 2005;79:6610–6619. doi: 10.1128/JVI.79.11.6610-6619.2005. [DOI] [PMC free article] [PubMed] [Google Scholar]
- Li B, Carey M, Workman JL. The role of chromatin during transcription. Cell. 2007;128:707–719. doi: 10.1016/j.cell.2007.01.015. [DOI] [PubMed] [Google Scholar]
- Peterlin BM, Price DH. Controlling the elongation phase of transcription with P-TEFb. Mol Cell. 2006;23:297–305. doi: 10.1016/j.molcel.2006.06.014. [DOI] [PubMed] [Google Scholar]
- Schroder AR, Shinn P, Chen H, Berry C, Ecker JR, Bushman F. HIV-1 integration in the human genome favors active genes and local hotspots. Cell. 2002;110:521–529. doi: 10.1016/s0092-8674(02)00864-4. [DOI] [PubMed] [Google Scholar]
- Urban G, Golden T, Aragon IV, Scammell JG, Dean NM, Honkanen RE. Identification of an estrogen-inducible phosphatase (PP5) that converts MCF-7 human breast carcinoma cells into an estrogen-independent phenotype when expressed constitutively. J Biol Chem. 2001;276:27638–27646. doi: 10.1074/jbc.M103512200. [DOI] [PubMed] [Google Scholar]
- Van Lint C, Emiliani S, Ott M, Verdin E. Transcriptional activation and chromatin remodeling of the HIV-1 promoter in response to histone acetylation. Embo J. 1996;15:1112–1120. [PMC free article] [PubMed] [Google Scholar]
- Verdin E, Paras P, Jr, Van Lint C. Chromatin disruption in the promoter of human immunodeficiency virus type 1 during transcriptional activation. Embo J. 1993;12:3249–3259. doi: 10.1002/j.1460-2075.1993.tb05994.x. [DOI] [PMC free article] [PubMed] [Google Scholar]
- Wei P, Garber ME, Fang SM, Fischer WH, Jones KA. A novel CDK9-associated C-type cyclin interacts directly with HIV-1 Tat and mediates its high-affinity, loop-specific binding to TAR RNA. Cell. 1998;92:451–462. doi: 10.1016/s0092-8674(00)80939-3. [DOI] [PubMed] [Google Scholar]
- Williams SA, Chen LF, Kwon H, Ruiz-Jarabo CM, Verdin E, Greene WC. NF-kappaB p50 promotes HIV latency through HDAC recruitment and repression of transcriptional initiation. Embo J. 2006;25:139–149. doi: 10.1038/sj.emboj.7600900. [DOI] [PMC free article] [PubMed] [Google Scholar]
Associated Data
This section collects any data citations, data availability statements, or supplementary materials included in this article.