Abstract
We used gene co-expression network analysis to functionally annotate long noncoding RNAs (lncRNAs) and identify their potential cancer associations. The integrated microarray data set from our previous study was used to extract the expression profiles of 1,865 lncRNAs. Known cancer genes were compiled from the Catalogue of Somatic Mutations in Cancer and UniProt databases. Co-expression analysis identified a list of previously uncharacterized lncRNAs that showed significant correlation in expression with core cancer genes. To further annotate the lncRNAs, we performed a weighted gene co-expression network analysis, which resulted in 37 co-expression modules. Three biologically interesting modules were analyzed in depth. Two of the modules showed relatively high expression in blood and brain tissues, whereas the third module was found to be downregulated in blood cells. Hub lncRNA genes and enriched functional annotation terms were identified within the modules. The results suggest the utility of this approach as well as potential roles of uncharacterized lncRNAs in leukemia and neuroblastoma.
Keywords: lncRNA, co-expression, network analysis, microarray, cancer
Introduction
Long noncoding RNAs (lncRNAs) are a major class of noncoding RNAs and exceed 200 nucleotides in length. Originally suspected of being the result of transcriptional noise, lncRNAs have been shown to have a broad range of functions including transcriptional regulation, mediating protein interactions, and influencing mRNA splicing.1 The ENCODE project has demonstrated that 74.7% of the human genome is transcribed, and more than 9,000 lncRNAs have been annotated.2,3 A large number of lncRNAs have also been identified in many other organisms. For instance, the FANTOM3 annotation project has discovered 34,030 lncRNA transcripts in the mouse genome.4 These studies have led to the projection that there may be more lncRNAs than protein-coding genes. The roles in biological processes and mechanism of action for the majority of lncRNAs have not yet been determined.5,6 For functional annotation, a weighted gene co-expression network analysis (WGCNA)7 of lncRNAs with well-annotated protein-coding genes offers an approach for insight into the biological roles of lncRNAs.
A definitive link between cancer and lncRNAs has been established through disease state studies and their functions in development and cellular differentiation.8–10 Examples of well-studied lncRNAs associated with cancer include HOX antisense intergenic RNA (HOTAIR), prostate cancer antigen 3 (PCA3) and metastasis-associated lung adenocarcinoma transcript 1 (MALAT1). HOTAIR interacts with Polycomb Recessive Complex 2 (PRC2) and the LSD1/CoREST/REST complex to modify histones, which results in silencing at multiple sites.11,12 PCA3 in contrast has no known function but acts as an effective noninvasive diagnostic marker for prostate cancer.13,14 MALAT1, which was first discovered in a differential expression study of non–small-cell lung cancer tumors, has been linked to 16 different cancer types including cervical cancer and hepatocellular carcinoma.15–18 These three lncRNAs share the common feature found in most cancer-associated lncRNAs, which are overexpressed in cancerous tissues.13,18,19 The significant changes in expression levels aid in determining the function of these cancer-associated lncRNAs, which have become important for diagnosis and prognosis of cancers.
This study is unique in the application of co-expression analysis to normal (noncancerous) tissues to determine lncRNA and cancer gene associations. Previous studies have focused on differential expression between normal and cancerous tissues. An example is the genome-wide differential and co-expression analysis of hepatoblastoma tissues.20 Bipartite network analysis has also been performed to predict lncRNA–disease associations.21 In this study, we use a previously compiled data set consisting of 2,968 microarray expression profiles across a wide spectrum of tissues.22 All expression profiles were obtained using the Affymetrix HG-U133 Plus 2.0 Array, which provides suitable genome coverage for known protein-coding genes with 98.6% of our cancer gene list being represented in the array probes. This microarray platform also contains probes for 1,970 lncRNAs.23 By utilizing the available data for co-expression analysis, we have examined the previously uncharacterized lncRNAs for their potential role in cancer and functional annotation.
Methods
Gene lists
A core and an extended gene list of known cancer genes were compiled for this study (Supplementary File S1). The core list comprised the known causal cancer genes from the Catalogue of Somatic Mutations in Cancer (COSMIC) Cancer Gene Census List from the Wellcome Trust Sanger Institute.24 Redundant genes and genes that do not have protein-level expression were removed from the list. The UniProt knowledgebase was used to determine if there was evidence of protein-level expression.25 The core list consisting of 472 protein-coding cancer genes was used to select microarray probes for the co-expression analysis of cancer genes and lncRNAs. To expand the core list for all plausible cancer genes, additional cancer genes not present within the core list were added to create the extended gene list. A custom search query was used to search the UniProt knowledgebase for additional cancer genes. Among the search criteria was a requirement for evidence of protein-level expression. The extended list consisting of 951 protein-coding cancer genes was used to select microarray probes for the WGCNA. The lncRNAs used in this study (Supplementary File S1) have at least one corresponding probe on the Affymetrix HG-U133 Plus 2.0 Array.
Microarray expression data
The microarray gene expression data set was compiled in our previous study.22 The data set had 2,968 microarray gene expression profiles generated using the Affymetrix HG-U133 Plus 2.0 Array with 54,675 probe sets. A data integration method was developed to combine the expression profiles from 131 different microarray studies into a single data set.22 Most human tissue types were represented in the integrated microarray data set, and the high quality of the data set was demonstrated by examining tissue-specific gene expression patterns as well as for identifying co-expressed genes.
Co-expression analysis of cancer genes and lncRNAs
For each cancer gene probe in the core list, co-expression was calculated against all lncRNA probes individually using the microarray expression data. Co-expression was measured by Pearson product–moment correlation with Microsoft Excel (2013). The top 10 absolute correlation values were kept. P-values were calculated using R 3.0.2.26 Due to the high degrees of freedom, the P-value after Bonferroni correction for multiple testing in each correlation measurement returned a significance of <6.53E-13. Cancer gene and lncRNA function were retrieved from the NCBI Gene database.27 Cancer gene disease associations were provided in the COSMIC Cancer Gene Census List.24
Weighted gene co-expression network analysis
The co-expression network was constructed using the WGCNA package.7 The normalized expression data for probes from the extended cancer gene list and lncRNAs were used as input. Given the relatively large data set and our interest in finding all the co-expression modules, we opted for a smaller minimum module size at 10 probes. The merge cut height, defined as the threshold of dissimilarity, 1-Topological Overlap Matrix (TOM), below which separate modules would be merged, was set to 0.2. Visual inspection of the initial hierarchical clustering revealed no outliers, and soft thresholding was set to 4. An unsigned network with connections based upon absolute correlations was constructed. Module assignment of cancer genes and lncRNAs was performed using democratic vote method. A gene was assigned to the module that had the highest number of probes for the gene. Genes with equal numbers of probes in different modules were assigned using the highest mean module membership for the probes.
Functional term enrichment analysis
Each module was analyzed for gene ontology term enrichment using the Database for Annotation, Visualization and Integrated Discovery (DAVID).28 The analysis was performed using the Affymetrix probe identifiers in each module with the Affymetrix HG-U133 Plus 2.0 Array as the background. Where significant, functional annotation terms were selected for biological process, molecular function, and Online Mendelian Inheritance in Man (OMIM) disease association.29 The P-value provided by DAVID was used as the measure of significance. The significance threshold was set to 0.1 for the reported functional terms.
Network visualization
Network visualization was performed using the VisANT software.30 All edges were based on TOM values with a threshold set for a minimum of one connection for each node. The 100 probes with the highest intramodal connectivity were analyzed. Node size was determined by connectivity.
Results
Normal cross-tissue expression profiles show high co-expression between lncRNAs and cancer genes
Cancer genes and lncRNAs appear to be involved in some common biological functions. Examples include the involvement in development and transcriptional regulation. Both cancer genes and lncRNAs have been shown to have tissue-specific expression patterns.5 We thus hypothesize that associations between known cancer genes and lncRNAs could be demonstrated through correlations in expression across various tissue samples. Previous studies have also shown that different isoforms of a cancer gene or lncRNA may have specific activity, function, and impact on cancer progression.31,32 Because of this possibility and our concern about the poor quality of some probe sets, we studied the microarray data at the probe level instead of combining multiple probe sets for a gene. We examined the highest co-expression correlations between the lncRNA and cancer gene probes. The degree of co-expression is shown here as a measure of the Pearson product–moment correlation. Since lncRNAs may have a silencing effect, the absolute correlation was used in the ranking to account for a negative Pearson correlation.33,34
The core cancer genes are a curated list of genes from the COSMIC cancer gene census database.24 From the integrated microarray expression data set, which contains 2,968 profiles of various normal tissue samples,22 we extracted the expression profiles for the corresponding probes of all available lncRNAs and core cancer genes. The 10 highest correlations were compiled (Supplementary File S2). Interestingly, a large majority of the co-expressed lncRNA probes show positive correlation with cancer genes and the minority show negative correlation. The well-known lncRNA HOTAIR showed a positive correlation (0.38) with homeobox C13 (HOXC13) and the lower level of positive correlation (0.28) with the transcription factor paired box 1 (PAX1). The lowly expressed lncRNA, PCA3, only showed a low level of positive correlation (0.23) with Rho guanine nucleotide exchange factor 12 (ARHGEF12).
To highlight the extent of co-expression between lncRNAs and cancer genes, the pairs with the highest correlations were compiled and annotated. Ten cancer genes with the highest absolute correlations with lncRNAs are shown in Table 1. All the correlation values are greater than 0.8 and well below the significance threshold of 0.05 (P-value < 6.53E-13). The majority of the lncRNAs analyzed in this study lack any functional annotation, and this is reflected in the highly co-expressed lncRNAs. MEG3 is the only lncRNA to have functional annotation. Notably, two lncRNAs, LOC100505812 and ITGB2 antisense RNA 1 (ITGB2-AS1), demonstrate high co-expression with multiple cancer genes. For the cancer genes highly co-expressed with LOC100505812, three (PTPRC, FLI1, and IKZF1) are associated with acute lymphoid leukemia and two (IKZF1 and MYD88) are associated with diffuse large B-cell lymphoma. ITGB2-AS1 has high co-expression with IKZF1 and LCK, both of which are associated with acute lymphoid leukemia. The third cancer gene co-expressed with ITGB2-AS1, WAS, is associated with lymphoma. The proteins encoded by the cancer genes have various functions. Two of the 10 proteins function as transcription factors, and 5 have DNA- or RNA-binding capacity. While the majority of the proteins appear to have functions related to transcription, the other proteins include receptors, phosphatases, and kinases. Four of the 10 cancer genes are involved in the immune response.
Table 1.
Identification of lncRNAs highly co-expressed with known cancer genes.
| CANCER GENE | FUNCTION | DISEASE ASSOCIATIONS | IncRNA | FUNCTION | CORRELATION COEFFICIENT |
|---|---|---|---|---|---|
| PTPRC | Protein tyrosine phosphatase receptor involved in T-cell activation. | Acute lymphoid leukemia | LOC100505812 | Uncharacterized | 0.86215 |
| FLI1 | Transcription factor and proto-oncogene | Ewing sarcoma, ALL | LOC100505812 | Uncharacterized | 0.85744 |
| IKZF1 | Zinc finger transcription factor involved in lymphocyte differentiation | ALL, diffuse large B-cell lymphoma (DLBCL) | LOC100505812 | Uncharacterized | 0.84260 |
| ITGB2-AS1 | Uncharacterized | 0.83235 | |||
| C21orf96 (RUNX1-IT1) | Uncharacterized | 0.82207 | |||
| RBM15 | RNA-binding motif protein | Acute megakaryocytic leukemia | LOC144438 | Uncharacterized | 0.83453 |
| HNRNPA2B1 | Ribonucleoprotein involved in pre-mRNA processing | Prostate cancer | FLJ31306 | Uncharacterized | 0.81977 |
| CNBP | Zinc finger SSDNA and SSRNA-binding protein | Aneurysmal bone cyst | LOC388789 | Uncharacterized | 0.81457 |
| MYD88 | Adapter protein for Toll-like receptor and interleukin-1 (IL-1) signaling | DLBCL | LOC100505812 | Uncharacterized | 0.81449 |
| LCK | Protein tyrosine kinase involved in T-cell development | ALL | ITGB2-AS1 | Uncharacterized | 0.81244 |
| CHN1 | GTPase-activating protein involved in neuronal signal-transduction | Extraskeletal myxoid chondrosarcoma | MEG3 | Potential tumor suppressor that interacts with p53 | 0.81079 |
| WAS | Signal transduction protein possibly involved in actin filament reorganization | Lymphoma | ITGB2-AS1 | Uncharacterized | 0.81049 |
Weighted gene co-expression network analysis shows close associations of lncRNAs and cancer genes
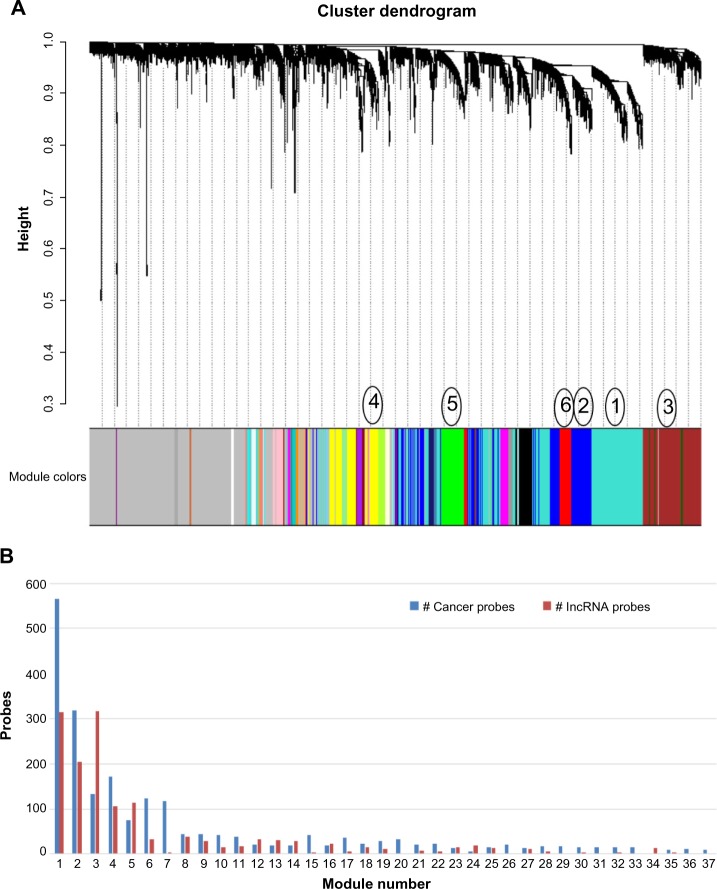
WGCNA with the extended gene list resulted in 37 distinct modules (Figs. 1A and 1B). With the exceptions of Module 3 and Module 5, the six largest modules showed a greater number of cancer gene probes within the module than lncRNA probes (Fig. 1B). Module 3 had twofold more lncRNAs than cancer genes. All of the modules contained at least one lncRNA probe, and Module 34 was the only module that contained only lncRNA probes. Nevertheless, the majority of the modules showed a relatively equal distribution of lncRNAs and cancer genes. There were 1,493 out of the 5,079 probes analyzed (29.4%) which were not assigned to any modules (shown in grey in Fig. 1A). Out of the 2,632 cancer gene probes, 489 (18.6%) were not assigned, whereas 1,004 out of the 2,447 lncRNA probes (41.0%) were left out.
Figure 1.
WGCNA of cancer genes and lncRNAs. (A) Cluster dendrogram of the co-expression modules. The modules were designated numerically based on size, and the six largest modules with Module 1 as the largest module are labeled adjacent to their respective color band. The grey band contains probes not assigned to any module. (B) Chart of the probe counts for cancer genes and lncRNAs respectively for each module.
Modules 1, 4, and 5 were chosen for further analysis. These selected modules were larger in size and showed high connectivity and module membership (data not shown) as well as divergence in expression patterns from one another.
Module 1 shows functional enrichment of transcriptional activity and blood-specific expression patterns
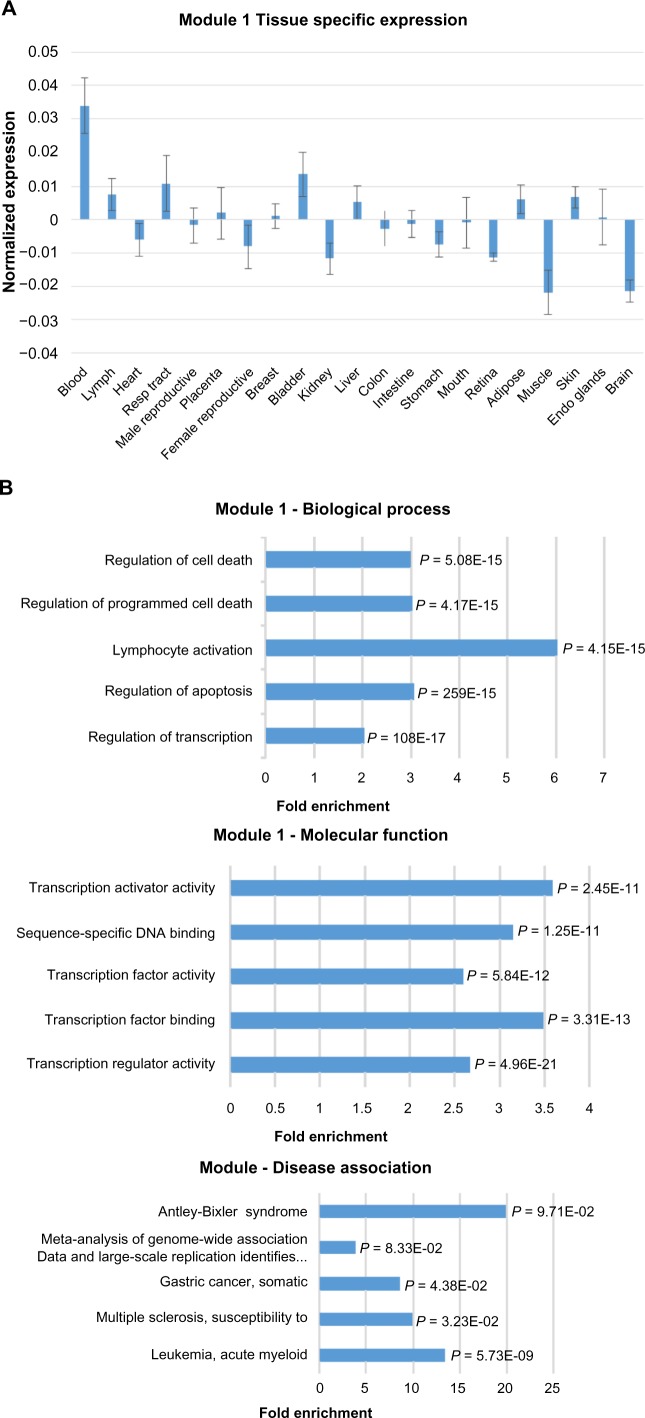
To examine the expression pattern of the module, samples were grouped by tissue types, and the mean expression level in each tissue type was calculated. As shown in Figure 2A, the average expression level of Module 1 genes is significantly higher in blood cells than the other tissues. Within the blood tissue type, neutrophils have the highest expression. The blood-specific expression pattern is also evident in the Module 1 expression heat map (Supplementary Fig. S1A). The other tissue types have median to low expression for both lncRNAs and cancer genes. Interestingly, the cancer genes have a more uniform high expression pattern in blood cells in comparison to lncRNAs, which show moderate expression in blood cells.
Figure 2.
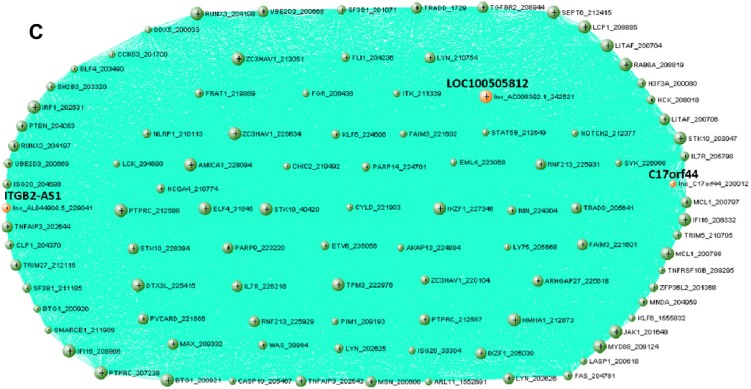
Expression, functional term enrichment, and network visualization of the largest Module 1 with high level of expression in blood. (A) Chart of the average expression levels of Module 1 genes in broad tissue types. Error bars represent standard deviations. (B) DAVID functional analysis of Module 1 genes. The enriched terms for biological process, molecular function, and OMIM disease association are plotted against fold enrichment with the corresponding P-value. (C) VisANT network visualization of the top 100 probes with the highest intramodal connectivity within Module 1. Node size is proportional to intramodal connectivity and edges are based upon TOM values with the minimum threshold set to 0.06.
To determine the biological significance of the module, functional term enrichment using the DAVID web server was performed (Fig. 2B). While the highest fold enrichment has been found in a component of the innate immune response, there is a significant enrichment for lymphocyte activation for Module 1. Other terms show functional enrichment for processes involved in cell death. The tissue specificity and gene ontology term enrichment reinforce the OMIM disease association with acute myeloid leukemia (AML).
To visualize the co-expression network and identify hub genes, the 100 probes with the highest intramodal connectivity were analyzed using the VisANT software (Fig. 2C). The network visualization shows dense connectivity within the module. The lncRNA LOC100505812 is a hub gene for Module 1, providing further evidence of the module’s role in lymphocyte activation. Two other uncharacterized lncRNAs are present in Module 1, ITGB2-AS1and C17orf44. Module 1 is the largest module with 879 co-expressed probes. Thus, although the other lncRNAs do not represent hub genes in the network of the selected probes, they may have high connectivity degrees and possibly play a central role in the biological function of the module.
Module 4 expression is low in blood and enriched for genes associated with intracellular signaling pathways
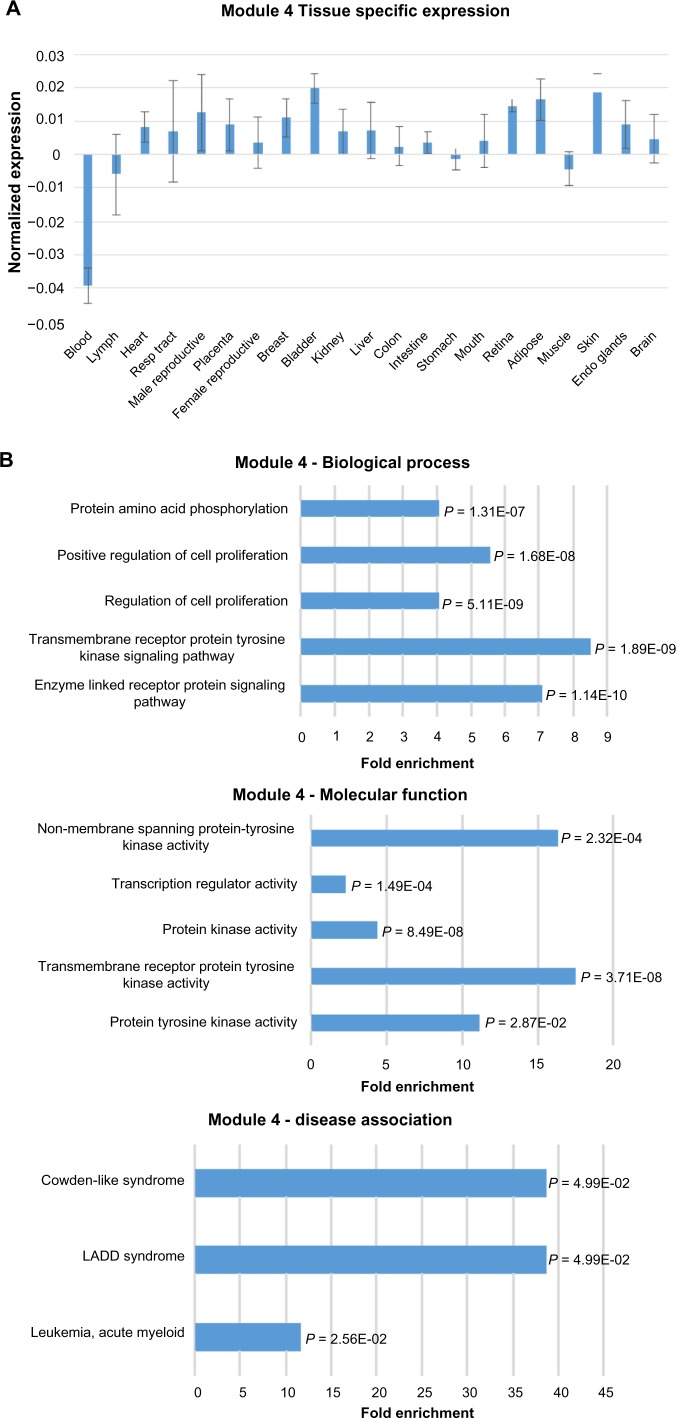
In contrast to Module 1, Module 4 shows significantly lower expression in blood samples than the other tissue types (Fig. 3A). Module 4 genes do not show obvious tissue-specific expression patterns. The lncRNAs show relatively low expression across tissues when compared to the cancer genes (Supplementary Fig. S1B). Functional terms for Module 4 are enriched for intracellular signaling pathways involved in cell proliferation at the process level and phosphatase and kinase activity at the molecular level (Fig. 3B). Interestingly, Module 4 shows an OMIM disease association for AML similar to Module 1. Module 4 also has less disparity between the proportion of lncRNAs to cancer genes and a larger number of higher intramodal connectivity for lncRNAs than Module 1 (Fig. 3C). The network visualization reveals a tendency of the lncRNAs to not have connections with each other but many connections with the cancer genes. For the nodes with the highest connectivity in Module 4, only 1.3% of the potential lncRNA–lncRNA connections were above the TOM connection threshold of 0.06, and of the potential connections between lncRNAs and cancer genes, 13.5% were above the TOM connection threshold. The uncharacterized lncRNA, LOC100130776, is identified as a potential hub gene within Module 4, and the lncRNA, AC009133.2 (GenBank accession) is of interest as well due to its high connectivity within the module.
Figure 3.
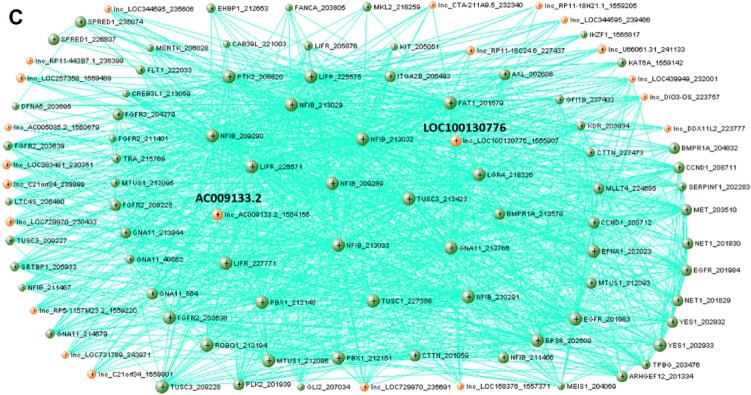
Expression, functional term enrichment, and network visualization of Module 4 genes with low level of expression in blood. (A) The average expression levels of Module 4 genes in broad tissue types with standard deviation bars. (B) The functional enrichment of biological process, molecular function, and OMIM disease association terms for Module 4 plotted against fold enrichment with the corresponding P-value. (C) VisANT network visualization of the top 99 probes with the highest intramodal connectivity within Module 4 (RNASEH2B excluded from visualization due to no connectivity above the edge threshold). The minimum TOM value threshold for edges is set to 0.06.
Module 5 exhibits high expression in brain tissues, OMIM disease association with neuroblastoma, and functional enrichment for neural development
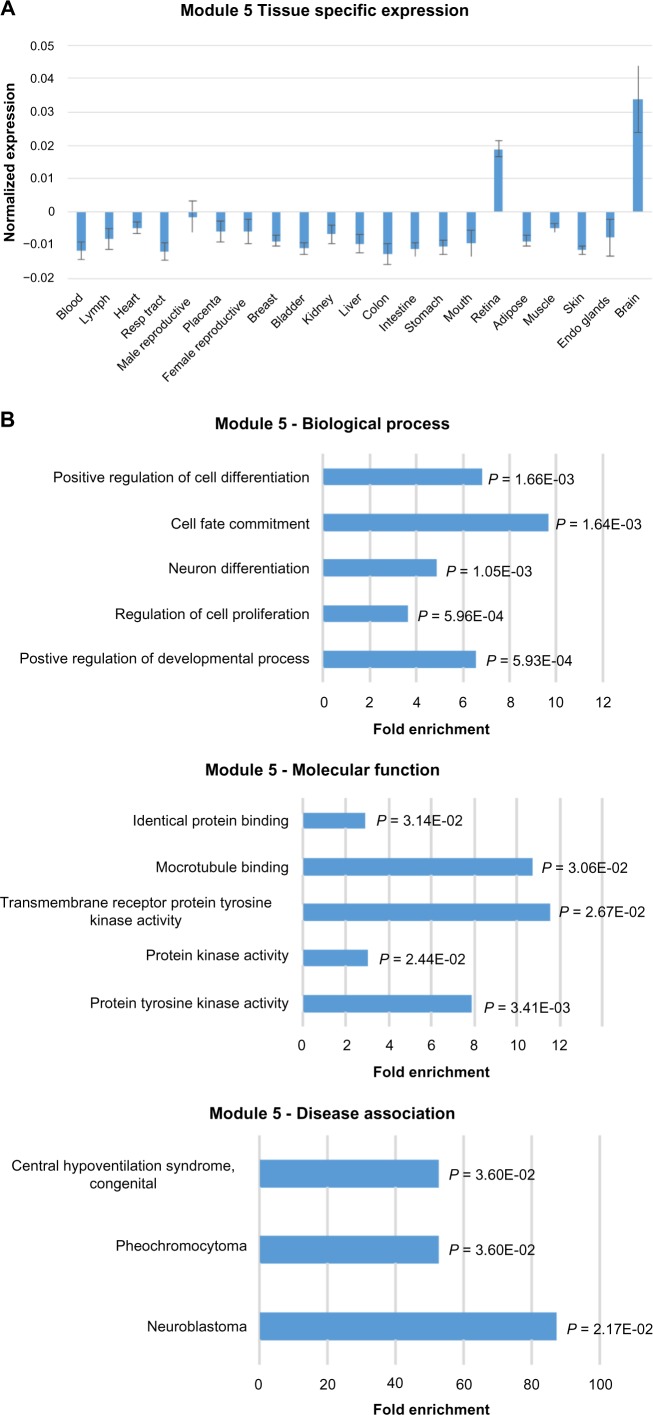
Module 5 genes show significantly higher levels of expression in the brain and retina tissues than the other tissue types (Fig. 4A). Moreover, the expression level in the brain is higher than in the retina. The heat map of Module 5 expression shows that cancer genes generally have higher expression than the lncRNAs in the brain samples (Supplementary Figure S1C). Within the brain tissue group, dorsolateral prefrontal cortex has the highest mean expression level.
Figure 4.
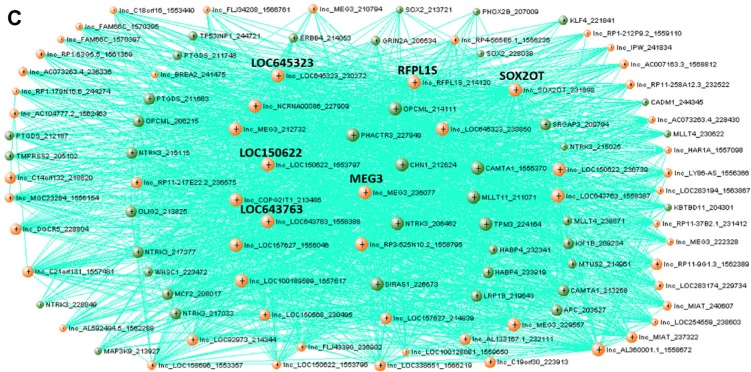
Expression, functional term enrichment, and network visualization of Module 5 genes with high proportion of lncRNAs and high level of expression in brain tissues. (A) Average expression levels of Module 5 genes in broad tissue types with standard deviation bars. (B) Functional enrichment analysis of Module 5 genes. The enriched terms for biological process, molecular function, and OMIM disease association are plotted against fold enrichment with the corresponding P-value. (C) VisANT network visualization of the top 100 probes with the highest intramodal connectivity within Module 5. The minimum TOM value threshold for edges is set to 0.06.
Functional term enrichment indicates that Module 5 genes may play a role in neural development (Fig. 4B). Module 5 has the significant enrichment of the biological process terms, positive regulation of developmental process and neuron differentiation. Not surprisingly given its brain-specific expression pattern, Module 5 is the only module to show an OMIM disease association with neuroblastoma. Although Module 5 does not show any significant molecular function term enrichment for transcriptional regulation as the previous two modules analyzed, it is similar to Module 4 in its term enrichment for intracellular signaling functions. Module 5 is also enriched for microtubule binding.
Network visualization of Module 5 shows less connectivity than Modules 1 and 4 (Fig. 4C). The pattern of high numbers of connections between lncRNAs and cancer genes is also observed in this module. However, there is not a greater propensity of connections between lncRNAs and cancer genes as was observed in Module 4. For the nodes with the highest connectivity in Module 5, 59.3% of the potential lncRNA–lncRNA connections were above the TOM connection threshold of 0.06, and of the potential connections between lncRNAs and cancer genes, 57.1% were above the TOM connection threshold. Six lncRNAs are identified as hub genes within Module 5. Four of the hub genes, LOC645323, LOC643763, LOC150622, and RFPLS are uncharacterized, whereas the other two hub genes, MEG3 and SOX2OT, have been studied. SOX2OT has been shown to be expressed specifically in the brain and linked to neurogenesis in mice.35 MEG3 is implicated in a variety of cancers, and MEG3 knockouts cause developmental disorders in mice.36
Discussion
In this study, we have demonstrated high degrees of co-expression between lncRNAs and cancer genes in noncancerous tissues. We have cataloged the lncRNAs that are highly co-expressed with the cancer genes in the core list. This catalog can serve as a prioritizing resource for research focused on the causal cancer genes and their potential interactions with lncRNAs. We have highlighted the biological significance of these interactions through the analysis of the highest correlations between lncRNAs and cancer genes. Interestingly, cancer genes that have high correlation with the same lncRNA also tend to share a common disease association. The co-expression analysis has also provided new insights into the association of lncRNAs and cancer genes. The mainly positive correlations in expression between lncRNAs and cancer genes imply function beyond transcriptional inhibition. Tissue-specific cancer genes, especially those expressed in blood or brain tissues, tend to have higher degrees of co-expression with lncRNAs. The cancer gene with the highest lncRNA co-expression, CHN1, is predominantly expressed in the brain, consistent with the relatively high level of expression for lncRNAs in this tissue type.37 In addition, our results suggest a potential role of lncRNAs in the immune response. LOC100505812 is located on chromosome 19 adjacent to the caspase recruitment domain family member 8 (CARD8) gene, which is involved in the inflammation response. It is possible that LOC100505812 may have a functional role in the immune response as well as the leukemia and lymphoma disease states. However, the expression of LOC100505812 may also be the result of transcriptional noise due to its close proximity to the CARD8 gene since lncRNAs and protein-coding genes are equally likely to be transcribed with adjacent genes.2 Both LOC100505812 and ITGB2-AS1 present interesting possibilities as leukemia or lymphoma biomarkers.
We have also performed gene co-expression network analysis to identify modules containing both lncRNAs and cancer genes. The expression patterns of the modules and their enrichment for biological process, molecular function, and disease association terms have provided the initial characterization for the previously uncharacterized lncRNAs. We have identified candidate lncRNAs that are hub genes within the biologically significant modules and thus warrant further studies. For instance, LOC100505812 is a hub gene in Module 1, which shows functional term enrichment for transcriptional regulation and disease association for AML. Moreover, the analysis of three co-expression modules has provided new insights into the potential roles of lncRNAs in cancer. While Modules 1 and 4 share AML disease association, there is a stark contrast in the expression patterns between the two modules. Recent studies have suggested the involvement of several lncRNAs such as HOTAIRM1 and RUNX1 in AML, but still little is known about their roles in the disease.38,39 Given the elevated expression pattern, the lncRNAs within Module 1 may have more functional potential related to the disease when compared with Module 4. However, overexpressed lncRNAs have previously served as diagnostic biomarkers. Thus, Module 4 with low level of expression in normal blood cells may provide some interesting diagnostic lncRNAs for cancer. Module 5 is of particular interest due to its brain-specific expression pattern, greater proportion of lncRNAs than cancer genes, and disease association with neuroblastoma. While lncRNAs have been shown to be involved in neural development, little is known about their role in neuroblastoma.37 Further characterization of the lncRNAs within Module 5 could provide insights into this disease.
We have shown the utility of our integrated microarray expression data set for functional annotation of lncRNAs associated with cancer genes. The data set contains 2,968 high-quality expression profiles of various normal tissue samples, which have been selected, after manual curation, from the vast amount of microarray data in public databases.22 We have used this high-quality data set for the co-expression analysis of cancer genes and lncRNAs. Since highly co-expressed genes are often involved in similar biological processes, the findings provide useful information for lncRNA annotation as well as cancer research. Our approach is different from the differential expression analysis of cancerous and normal samples, which is commonly used to identify disease-associated lncRNAs. Since cancer is a highly heterogeneous disease and lncRNAs are normally expressed at low levels, the analysis of gene co-expression in a wide range of normal tissue types may allow for the broader identification of cancer-associated lncRNAs and functional characterization. This approach can also be used to determine lncRNA associations with other disease states. Nevertheless, one limitation in this study is that only 1,865 lncRNAs are represented in the microarray platform (Affymetrix HG-U133 Plus 2.0 Array). This limitation can be overcome by utilizing RNA-seq data. With the rapid accumulation of RNA-seq data in public databases, a high-quality expression data set containing all lncRNAs will be compiled and used for the gene co-expression network analysis in the future.
Supplementary Data
Gene_List.xslx. File S1: Lists of all the genes and their module assignments. Included are the core and extended lists of cancer genes compiled from the COSMIC and UniProt databases and the list of lncRNAs with probes available on the Affymetrix HG-U133 Plus 2.0 Array.
COSMIC-lncRNA_Correlations.xslx. File S2: Highest co-expression lncRNAs for each cancer gene in the core list. The core cancer gene and corresponding probe are listed with the ten lncRNA probes with the highest absolute Pearson product moment correlation.
Supplement figure 1. Heat maps to show expression patterns across normal tissue samples in (A) Module1, (B) Module 4, and (C) Module 5. The probes are sorted by their average expression levels across the tissue types highest to lowest.
Footnotes
ACADEMIC EDITOR: JT Efird, Editor in Chief
FUNDING: This work is supported by CSREES/USDA under project number SC-1000675.
COMPETING INTERESTS: Authors disclose no potential conflicts of interest.
This paper was subject to independent, expert peer review by a minimum of two blind peer reviewers. All editorial decisions were made by the independent academic editor. All authors have provided signed confirmation of their compliance with ethical and legal obligations including (but not limited to) use of any copyrighted material, compliance with ICMJE authorship and competing interests disclosure guidelines and, where applicable, compliance with legal and ethical guidelines on human and animal research participants. Provenance: the authors were invited to submit this paper.
Author Contributions
LW conceived the study. SBC wrote the first draft of the manuscript. SBC and LW designed the experiments, analyzed the data, made critical revisions of the manuscript, and reviewed and approved the final manuscript.
REFERENCES
- 1.Cech TR, Steitz JA. The noncoding RNA revolution-trashing old rules to forge new ones. Cell. 2014;157(1):77–94. doi: 10.1016/j.cell.2014.03.008. [DOI] [PubMed] [Google Scholar]
- 2.Djebali S, Davis CA, Merkel A, et al. Landscape of transcription in human cells. Nature. 2012;489(7414):101–8. doi: 10.1038/nature11233. [DOI] [PMC free article] [PubMed] [Google Scholar]
- 3.Derrien T, Johnson R, Bussotti G, et al. The GENCODE v7 catalog of human long noncoding RNAs: analysis of their gene structure, evolution, and expression. Genome Res. 2012;22(9):1775–89. doi: 10.1101/gr.132159.111. [DOI] [PMC free article] [PubMed] [Google Scholar]
- 4.Maeda N, Kasukawa T, Oyama R, et al. Transcript annotation in FANTOM3: mouse gene catalog based on physical cDNAs. PLoS Genet. 2006;2(4):e62. doi: 10.1371/journal.pgen.0020062. [DOI] [PMC free article] [PubMed] [Google Scholar]
- 5.Cabili MN, Trapnell C, Goff L, et al. Integrative annotation of human large intergenic noncoding RNAs reveals global properties and specific subclasses. Genes Dev. 2011;25(18):1915–27. doi: 10.1101/gad.17446611. [DOI] [PMC free article] [PubMed] [Google Scholar]
- 6.Wang S, Tran EJ. Unexpected functions of lncRNAs in gene regulation. Commun Integr Biol. 2013;6(6):e27610. doi: 10.4161/cib.27610. [DOI] [PMC free article] [PubMed] [Google Scholar]
- 7.Langfelder P, Horvath S. WGCNA: an R package for weighted correlation network analysis. BMC Bioinformatics. 2008;9:559. doi: 10.1186/1471-2105-9-559. [DOI] [PMC free article] [PubMed] [Google Scholar]
- 8.Cheetham SW, Gruhl F, Mattick JS, Dinger ME. Long noncoding RNAs and the genetics of cancer. Br J Cancer. 2013;108(12):2419–25. doi: 10.1038/bjc.2013.233. [DOI] [PMC free article] [PubMed] [Google Scholar]
- 9.Iyengar BR, Choudhary A, Sarangdhar MA, Venkatesh KV, Gadgil CJ, Pillai B. Non-coding RNA interact to regulate neuronal development and function. Front Cell Neurosci. 2014;8:47. doi: 10.3389/fncel.2014.00047. [DOI] [PMC free article] [PubMed] [Google Scholar]
- 10.Zhu S, Hu X, Han S, et al. Differential expression profile of long non-coding RNAs during differentiation of cardiomyocytes. Int J Med Sci. 2014;11(5):500–7. doi: 10.7150/ijms.7849. [DOI] [PMC free article] [PubMed] [Google Scholar]
- 11.Rinn JL, Kertesz M, Wang JK, et al. Functional demarcation of active and silent chromatin domains in human HOX loci by noncoding RNAs. Cell. 2007;129(7):1311–23. doi: 10.1016/j.cell.2007.05.022. [DOI] [PMC free article] [PubMed] [Google Scholar]
- 12.Tsai MC, Manor O, Wan Y, et al. Long noncoding RNA as modular scaffold of histone modification complexes. Science. 2010;329(5992):689–93. doi: 10.1126/science.1192002. [DOI] [PMC free article] [PubMed] [Google Scholar]
- 13.Bussemakers MJ, van Bokhoven A, Verhaegh GW, et al. DD3: a new prostate-specific gene, highly overexpressed in prostate cancer. Cancer Res. 1999;59(23):5975–9. [PubMed] [Google Scholar]
- 14.Hessels D, Klein Gunnewiek JM, van Oort I, et al. DD3(PCA3)-based molecular urine analysis for the diagnosis of prostate cancer. Eur Urol. 2003;44(1):8–16. doi: 10.1016/s0302-2838(03)00201-x. discussion 15–6. [DOI] [PubMed] [Google Scholar]
- 15.Ji P, Diederichs S, Wang W, et al. MALAT-1, a novel noncoding RNA, and thymosin beta4 predict metastasis and survival in early-stage non-small cell lung cancer. Oncogene. 2003;22(39):8031–41. doi: 10.1038/sj.onc.1206928. [DOI] [PubMed] [Google Scholar]
- 16.Chen G, Wang Z, Wang D, et al. LncRNADisease: a database for long-non-coding RNA-associated diseases. Nucleic Acids Res. 2013;41(Database issue):D983–6. doi: 10.1093/nar/gks1099. [DOI] [PMC free article] [PubMed] [Google Scholar]
- 17.Guo F, Li Y, Liu Y, Wang J, Li Y, Li G. Inhibition of metastasis-associated lung adenocarcinoma transcript 1 in CaSki human cervical cancer cells suppresses cell proliferation and invasion. Acta Biochim Biophys Sin (Shanghai) 2010;42(3):224–9. doi: 10.1093/abbs/gmq008. [DOI] [PubMed] [Google Scholar]
- 18.Luo JH, Ren B, Keryanov S, et al. Transcriptomic and genomic analysis of human hepatocellular carcinomas and hepatoblastomas. Hepatology. 2006;44(4):1012–24. doi: 10.1002/hep.21328. [DOI] [PMC free article] [PubMed] [Google Scholar]
- 19.Huang L, Liao LM, Liu AW, et al. Overexpression of long noncoding RNA HOTAIR predicts a poor prognosis in patients with cervical cancer [published online ahead of print April 20, 2014] Arch Gynecol Obstet. 2014 doi: 10.1007/s00404-014-3236-2. [DOI] [PubMed] [Google Scholar]
- 20.Dong R, Jia D, Xue P, et al. Genome-wide analysis of long noncoding RNA (lncRNA) expression in hepatoblastoma tissues. PLoS One. 2014;9(1):e85599. doi: 10.1371/journal.pone.0085599. [DOI] [PMC free article] [PubMed] [Google Scholar]
- 21.Yang X, Gao L, Guo X, et al. A network based method for analysis of lncRNA-disease associations and prediction of lncRNAs implicated in diseases. PLoS One. 2014;9(1):e87797. doi: 10.1371/journal.pone.0087797. [DOI] [PMC free article] [PubMed] [Google Scholar]
- 22.Wang L, Srivastava AK, Schwartz CE. Microarray data integration for genome-wide analysis of human tissue-selective gene expression. BMC Genomics. 2010;11(suppl 2):S15. doi: 10.1186/1471-2164-11-S2-S15. [DOI] [PMC free article] [PubMed] [Google Scholar]
- 23.Zhang X, Sun S, Pu JK, et al. Long non-coding RNA expression profiles predict clinical phenotypes in glioma. Neurobiol Dis. 2012;48(1):1–8. doi: 10.1016/j.nbd.2012.06.004. [DOI] [PubMed] [Google Scholar]
- 24.Futreal PA, Coin L, Marshall M, et al. A census of human cancer genes. Nat Rev Cancer. 2004;4(3):177–83. doi: 10.1038/nrc1299. [DOI] [PMC free article] [PubMed] [Google Scholar]
- 25.UniProt Consortium. Activities at the universal protein resource (UniProt) Nucleic Acids Res. 2014;42(Database issue):D191–8. doi: 10.1093/nar/gkt1140. [DOI] [PMC free article] [PubMed] [Google Scholar]
- 26.R Core Team . R: A Language and Environment for Statistical Computing. Vienna, Austria: R Foundation for Statistical Computing; 2013. Available at http://www.R-project.org/ [Google Scholar]
- 27.Maglott D, Ostell J, Pruitt KD, Tatusova T. Entrez gene: gene-centered information at NCBI. Nucleic Acids Res. 2011;39(Database issue):D52–7. doi: 10.1093/nar/gkq1237. [DOI] [PMC free article] [PubMed] [Google Scholar]
- 28.Huang da W, Sherman BT, Lempicki RA. Systematic and integrative analysis of large gene lists using DAVID bioinformatics resources. Nat Protoc. 2009;4(1):44–57. doi: 10.1038/nprot.2008.211. [DOI] [PubMed] [Google Scholar]
- 29.Amberger J, Bocchini CA, Scott AF, Hamosh A. McKusick’s online mendelian inheritance in man (OMIM) Nucleic Acids Res. 2009;37(Database issue):D793–6. doi: 10.1093/nar/gkn665. [DOI] [PMC free article] [PubMed] [Google Scholar]
- 30.Hu Z, Chang YC, Wang Y, et al. VisANT 4.0: integrative network platform to connect genes, drugs, diseases and therapies. Nucleic Acids Res. 2013;41(Web Server issue):W225–31. doi: 10.1093/nar/gkt401. [DOI] [PMC free article] [PubMed] [Google Scholar]
- 31.Li CM, Chen G, Dayton TL, et al. Differential Tks5 isoform expression contributes to metastatic invasion of lung adenocarcinoma. Genes Dev. 2013;27(14):1557–67. doi: 10.1101/gad.222745.113. [DOI] [PMC free article] [PubMed] [Google Scholar]
- 32.Bochenek G, Häsler R, El Mokhtari NE, et al. The large non-coding RNA ANRIL, which is associated with atherosclerosis, periodontitis and several forms of cancer, regulates ADIPOR1, VAMP3 and C11ORF10. Hum Mol Genet. 2013;22(22):4516–27. doi: 10.1093/hmg/ddt299. [DOI] [PubMed] [Google Scholar]
- 33.Negishi M, Wongpalee SP, Sarkar S, et al. A new lncRNA, APTR, associates with and represses the CDKN1 A/p21 promoter by recruiting polycomb proteins. PLoS One. 2014;9(4):e95216. doi: 10.1371/journal.pone.0095216. [DOI] [PMC free article] [PubMed] [Google Scholar]
- 34.Pandey RR, Mondal T, Mohammad F, et al. Kcnq1ot1 antisense noncoding RNA mediates lineage-specific transcriptional silencing through chromatin-level regulation. Mol Cell. 2008;32(2):232–46. doi: 10.1016/j.molcel.2008.08.022. [DOI] [PubMed] [Google Scholar]
- 35.Amaral PP, Neyt C, Wilkins SJ, et al. Complex architecture and regulated expression of the Sox2ot locus during vertebrate development. RNA. 2009;15(11):2013–27. doi: 10.1261/rna.1705309. [DOI] [PMC free article] [PubMed] [Google Scholar]
- 36.Benetatos L, Vartholomatos G, Hatzimichael E. MEG3 imprinted gene contribution in tumorigenesis. Int J Cancer. 2011;129(4):773–9. doi: 10.1002/ijc.26052. [DOI] [PubMed] [Google Scholar]
- 37.Wu P, Zuo X, Deng H, Liu X, Liu L, Ji A. Roles of long noncoding RNAs in brain development, functional diversification and neurodegenerative diseases. Brain Res Bull. 2013;97:69–80. doi: 10.1016/j.brainresbull.2013.06.001. [DOI] [PubMed] [Google Scholar]
- 38.Zhang X, Weissman SM, Newburger PE. Long intergenic non-coding RNA HOTAIRM1 regulates cell cycle progression during myeloid maturation in NB4 human promyelocytic leukemia cells [published online ahead of print April 24, 2014] RNA Biol. 2014;11(6) doi: 10.4161/rna.28828. [DOI] [PMC free article] [PubMed] [Google Scholar]
- 39.Wang H, Li W, Guo R, et al. An intragenic long noncoding RNA interacts epigenetically with the RUNX1 promoter and enhancer chromatin DNA in hematopoietic malignancies [published online ahead of print April 20, 2014] Int J Cancer. 2014 doi: 10.1002/ijc.28922. [DOI] [PubMed] [Google Scholar]
Associated Data
This section collects any data citations, data availability statements, or supplementary materials included in this article.
Supplementary Materials
Gene_List.xslx. File S1: Lists of all the genes and their module assignments. Included are the core and extended lists of cancer genes compiled from the COSMIC and UniProt databases and the list of lncRNAs with probes available on the Affymetrix HG-U133 Plus 2.0 Array.
COSMIC-lncRNA_Correlations.xslx. File S2: Highest co-expression lncRNAs for each cancer gene in the core list. The core cancer gene and corresponding probe are listed with the ten lncRNA probes with the highest absolute Pearson product moment correlation.
Supplement figure 1. Heat maps to show expression patterns across normal tissue samples in (A) Module1, (B) Module 4, and (C) Module 5. The probes are sorted by their average expression levels across the tissue types highest to lowest.


