Abstract
Purpose:
Contrast enhanced (CE) imaging techniques for both planar digital mammography (DM) and three-dimensional (3D) digital breast tomosynthesis (DBT) applications requires x-ray photon energies higher than the k-edge of iodine (33.2 keV). As a result, x-ray tube potentials much higher (>40 kVp) than those typical for screening mammography must be utilized. Amorphous selenium (a-Se) based direct conversion flat-panel imagers (FPI) have been widely used in DM and DBT imaging systems. The a-Se layer is typically 200 μm thick with quantum detective efficiency (QDE) >87% for x-ray energies below 26 keV. However, QDE decreases substantially above this energy. To improve the object detectability of either CE-DM or CE-DBT, it may be advantageous to increase the thickness (dSe) of the a-Se layer. Increasing the dSe will improve the detective quantum efficiency (DQE) at the higher energies used in CE imaging. However, because most DBT systems are designed with partially isocentric geometries, where the gantry moves about a stationary detector, the oblique entry of x-rays will introduce additional blur to the system. The present investigation quantifies the effect of a-Se thickness on imaging performance for both CE-DM and CE-DBT, discussing the effects of improving photon absorption and blurring from oblique entry of x-rays.
Methods:
In this paper, a cascaded linear system model (CLSM) was used to investigate the effect of dSe on the imaging performance (i.e., MTF, NPS, and DQE) of FPI in CE-DM and CE-DBT. The results from the model are used to calculate the ideal observer signal-to-noise ratio, d′, which is used as a figure-of-merit to determine the total effect of increasing dSe for CE-DM and CE-DBT.
Results:
The results of the CLSM show that increasing dSe causes a substantial increase in QDE at the high energies used in CE-DM. However, at the oblique projection angles used in DBT, the increased length of penetration through a-Se introduces additional image blur. The reduced MTF and DQE at high spatial frequencies lead to reduced two-dimensional d′. These losses in projection image resolution may subsequently result in a decrease in the 3D d′, but the degree of which is largely dependent on the DBT reconstruction algorithm. For a filtered backprojection (FBP) algorithm with spectral apodization and slice-thickness filters, which dominate the blur for reconstructed images at oblique angles, the effect of oblique entry of x-rays on 3D d′ is minimal. Thus, increasing dSe results in an improvement in d′ for both CE-DM and CE-DBT with typical FBP reconstruction parameters.
Conclusions:
Increased dSe improves CE breast imaging performance by increasing QDE of detectors at higher energies, e.g., 49 kVp. Although there is additional blur in the oblique angled projections of a DBT scan, the overall 3D d′ for DBT is not degraded because the dominant source blur at these angles results from the reconstruction filters of the employed FBP algorithm.
Keywords: digital breast tomosynthesis (DBT), contrast enhancement, amorphous selenium, cascaded linear system model (CLSM), MTF, ideal observer signal-to-noise ratio (SNR)
1. INTRODUCTION
Contrast enhanced (CE) x-ray breast imaging for planar techniques, such as digital mammography (DM)1–9 and three-dimensional (3D) techniques such as digital breast tomosynthesis (DBT)10–15 has been the subject of intensive investigation. The conspicuity of large, malignant lesions may be enhanced through the injection of radio-opaque contrast agents (i.e., iodine). These lesions often exhibit signature contrast uptake characteristics due to tumor angiogenesis.
CE breast imaging is normally accompanied by image subtraction, either dual energy (DE) or temporal (TE), which is used to mathematically remove breast tissue background. In order to maximize the signal from the iodinated contrast agent, which has a k-edge of 33.2 keV, the x-ray tube potentials utilized must be much higher (>40 kVp) than those typically used in screening mammography (∼28 kVp). This necessitates modifications in detector design. For amorphous selenium (a-Se) based direct conversion flat-panel imagers (FPI), increasing the thickness of the a-Se layer (dSe) will result in increased quantum detection efficiency (QDE).
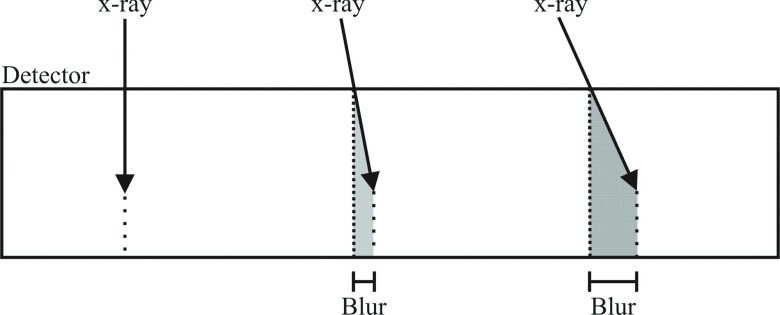
For CE-DM, the gains in x-ray absorption realized by increasing dSe will result in improved lesion conspicuity. In DBT with stationary detectors, however, additional blur from oblique entry of x-rays becomes more severe as dSe increases. This mechanism is illustrated in Fig. 1. The lateral component of a photon’s trajectory through the a-Se layer results in a spread of the charge generated by x-ray interaction, i.e., blurring of the charge image. This effect may be calculated from the depth of penetration of the x-ray photon and its angle of incidence. For high energy x-rays, a larger dSe affords a longer distance through which the x-ray may penetrate, exacerbating this source of blur.
FIG. 1.
Diagram showing the blur due to oblique entry of x-ray photons on a stationary direct conversion a-Se detector.
In the present work, the overall impact of increasing dSe on the imaging performance for CE-DM and CE-DBT was analyzed in both projection and reconstruction domains specifically for DE subtraction techniques. The detective quantum efficiency (DQE), which depends on both QDE and MTF, is evaluated as a function of the angle of projection. The ideal observer signal-to-noise ratio (SNR), d′, is calculated for both DE-DM [0° two-dimensional (2D) projection image] and DE-DBT and is used as the figure-of-merit (FOM) to determine the effect of dSe on object detectability.
2. THEORY AND METHODS
2.A. Development of the cascaded linear system model
A cascaded linear system model (CLSM) was employed for the analysis and optimization of CE breast imaging.13,16,17 Each stage of the imaging chain, from the physical processes of x-ray interaction within the a-Se layer to the geometry and (analytical) reconstruction of 3D DBT images, was modeled as a serial or parallel gain or blurring stage. The CLSM has been validated for a-Se detectors18,19 as well as DBT imaging17 and has been used to investigate the propagation of image artifact arising from incomplete sampling20 as well as dose-distribution techniques21 to improve calcification detection. Other similar linear system models have been used to investigate optimal imaging parameters for DE-computed tomography (CT).22–25 The DBT model was modified for CE imaging. The input to the CLSM is an x-ray spectrum generated using Boone’s interpolated polynomial model for tungsten (W) anodes for either mammography (MASMIP—used for tube potentials <43 kVp)26 or general radiography (TASMIP—used for tube potentials >43 kV p).27
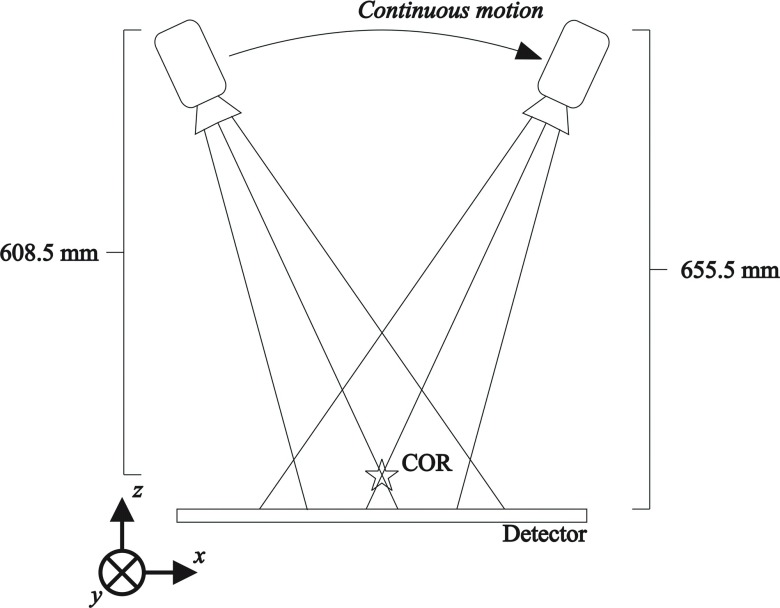
Figure 2 is a diagram of the modeled DBT system geometry. The x-ray tube moves in a continuous arc (the x-direction) over a stationary detector. The center of rotation is 608.5 mm from the focal spot and the source-to-imager distance is 655.5 mm. The angular range is set to ±25°. The detector pixel elements were modeled as square in shape with dimensions of 85 × 85 μm. The tube potential for the W target x-ray tube ranges from 23 to 49 kVp and filters including 50 μm of rhodium (Rh) for low energy (LE) views as well as 300 μm of copper (Cu) or 1 mm of titanium (Ti) for high energy (HE) views. For the sake of convenience herein, LE will refer a typical mammographic x-ray spectrum (28 kVp, W/Rh target/filter combination) and HE will refer to a 49 kVp, W/Ti spectrum.
FIG. 2.
Diagram of the modeled tomosynthesis unit with angular range of +25°. The unit is designed with partially isocentric geometry, where the x-ray tube moves along a continuous arc over a stationary detector.
2.B. Factors affecting projection domain performance
The CLSM simulates the effect of the physical processes of the system as a combination of serial or parallel stages which modify the frequency dependent signal (Φ) or noise power spectrum (S). Any of the following processes may be involved, including (1) gain/selection, (2) stochastic blurring, (3) deterministic blurring, (4) aliasing, or (5) addition. The projection domain detector model has been described in detail previously.18,28
The first stage of interaction is a binary selection process, where x-ray photons are attenuated by the a-Se layer. This binary selection is a subcase of amplification and is described by the energy dependent x-ray QDE, η(E), calculated by
| (1) |
where μSe(E) is the energy dependent linear attenuation coefficient of the a-Se layer. It should be noted that for x-rays entering the detector at some oblique angle, θi, the effective detector thickness is dSe,eff = dSe/cos(θi) since the available material thickness through which the photon may travel is increased. η(E) affects both signal and noise propagation as a binary gain stage according to28
| (2) |
where Φ0(E) is the input x-ray spectrum. It should be noted that at this selection stage, both signal and NPS are spatially white and follow a Poisson distribution. The total QDE may be calculated using η(E). It is a single percentage FOM and is dependent on input spectrum. This quantity may be calculated using
| (3) |
2.C. Effects of DBT acquisition and geometry
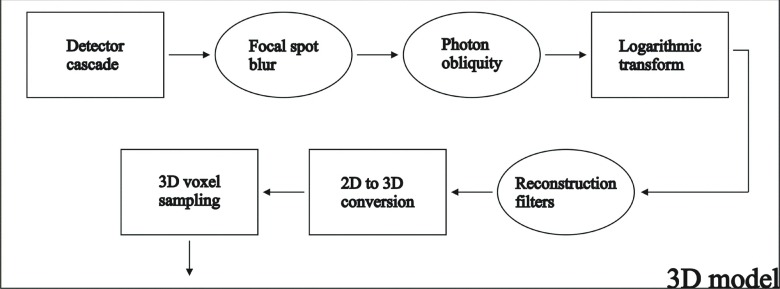
The output of the CLSM for a-Se detectors is used as inputs into the linear system model for DBT imaging.13,16,17,21,29 Figure 3 depicts a flow chart of the stages of the linear cascade for DBT.
FIG. 3.
Flow chart of the noise and signal propagation in the cascaded linear system model for DBT.
The first modeled stage includes the geometric effect of focal spot motion (FSM) during a continuous motion DBT scan on MTF blurring. The total effect of focal spot blur (FSB) including both FSM and the effect of the finite size of the x-ray source has been described in detail previously.16,17 The effect of FSM was found to be the dominant source of FSB and has been calculated as a deterministic blurring stage, having no effect on the correlation of the NPS. The blur function is essentially a rectangular aperture function applied only in the direction of tube motion (x′-direction) according to
| (4) |
where a1 is the distance of focal spot travel at the detector plane. The resulting signal spectrum and NPS are given by
| (5) |
where proj denotes the output of the a-Se model.
Due to the implementation of partially isocentric geometry, where the a-Se detector is stationary, effects of beam obliquity, particularly at the most extreme angles of the DBT scan, may result in significant blurring of the MTF.30 Seen in Fig. 1 is a diagram of the effect of oblique entry of x-ray photons on image blur. The diagonal travel of the x-ray photon within the a-Se bulk causes a horizontal distribution of energy and charge along the detector width. This phenomenon blurs high frequency objects, resulting in loss of resolution in the image. This effect was studied in detail by Mainprize et al. and was described mathematically using30
| (6) |
where Eabs is the absorbed energy, which is calculated by determining the mean energy deposited per x-ray photon and multiplying by the total fluence. Because oblique entry of x-ray photons does not result in additional correlation of the NPS, the resulting signal and noise power spectra are affected by
| (7) |
2.D. Conversion from 2D to 3D
Images acquired at different acquisition angles contribute to the reconstructed 3D signal and noise differently. Central slice theorem indicates that for a projection image acquired at angle θi, from the vertical (z-) axis, its frequency domain response functions (signal and noise power spectra, as well as MTF) are mapped along that same angle measured from the horizontal (x-) axis. For convenience, the frequency domain polar coordinates, fr and θi are invoked, where fr denotes the frequency in the radial direction along the projection angle θi. For a unit with isocentric geometry, fr = fx′. In the case of a partial isocentric geometry with stationary detector,31 fr is calculated as
| (8) |
The radial frequency, fr, is related to 3D Cartesian coordinates in reconstruction space (x-, y-, and z-directions) through
| (9) |
In all cases, fy = fy′ and substitution of Eq. (8) in Eq. (9) results in fx′ = fx.
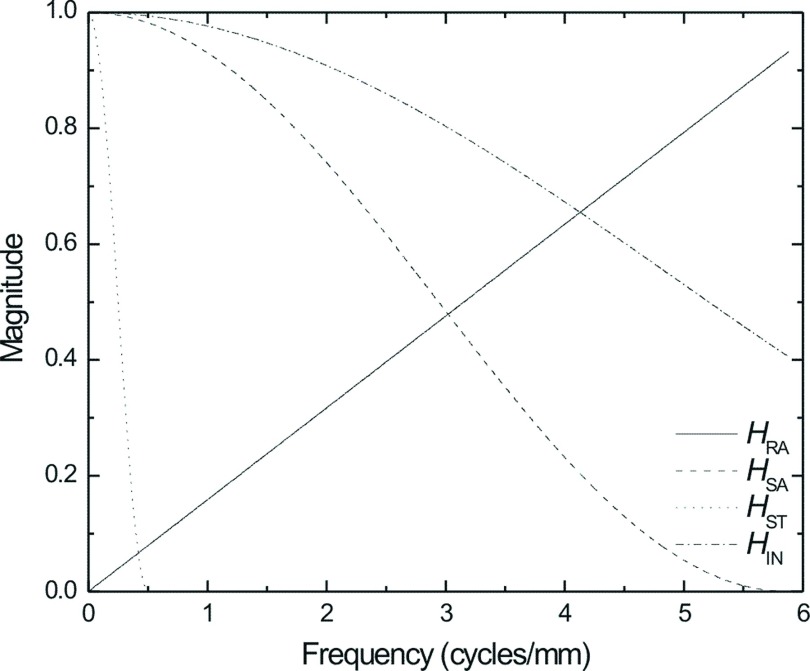
Figure 4 depicts the impulse response functions of each of the reconstruction filters used in the modified filtered backprojection (FBP) algorithm modeled in this study. These filters have been described in detail previously and include (1) Ramp (RA) filter, (2) spectral apodization (SA) filter, (3) slice-thickness (ST) filter, and (4) interpolation (IN) filter.32,33
FIG. 4.
Plot of the magnitude of each reconstruction filter as a function of frequency (cycles/mm).
The RA filter is used to account for the effect of spoke density and is defined as
| (10) |
where
| (11) |
θTOT represents the total angular range of DBT acquisition, and fNY is the Nyquist frequency of the projection images (5.88 cycles/mm for 85 μm pixel elements). The SA filter is used to limit the effect of noise and noise aliasing at high frequencies in the x-direction and is in the form of a Hanning window according to
| (12) |
Similarly, the ST filter is used to limit noise and noise aliasing at high frequencies in the z-direction and is also presented in the form of a Hanning window according to
| (13) |
where A and B are the window widths of the SA and ST filters, respectively, and are defined as quantities in multiples of fNY. Finally, the IN filter is applied to mimic the effect of voxel-driven reconstruction and is a bilinear interpolation according to16
| (14) |
The filtered signal and noise power spectra for the projection images are defined as
| (15) |
after conversion into polar coordinates.
For an acquisition with N projection views, the 3D response function outputs are calculated from the 2D images through16
| (16) |
where the N/θTOTfr describes the spoke density of the sampled region and the term δ(fxsin(θi) − fzcos(θi)) is a mapping function, applying the signal and noise power spectra along the angle of acquisition, θi. The 3D presampling MTF is determined by normalizing the output signal spectrum, Φb, by its zero frequency value.
Due to the finite sampling of the reconstructed volume, signal, and noise aliasing may compromise image quality. Typical DBT voxel dimensions are 0.085 × 0.085 × 1 mm in x-, y-, and z-directions, respectively. In the present study, the zeros of the SA and ST filters, A and B, respectively, are set equal to 0.7 and 0.035, which were common values for clinical DBT systems employing this particular FBP algorithm and completely remove the effect of noise aliasing in the reconstructed image volume.
Finally, DBT volumes are typically viewed as image slices parallel with the x–y (detector) plane. Analysis of the in-plane (IP) MTF (ΦIP) and NPS (SIP) allows quantification of image quality within these DBT slices. ΦIP and SIP are calculated by integrating Φb and Sb from Eq. (16) along the fz-direction.
2.E. Ideal observer signal-to-noise ratio
The ideal observer SNR was used as a FOM to determine the efficacy of a particular system to accomplish an imaging task, W.34 This imaging task is defined as the difference between two hypotheses. For a detection task, where the ideal observer SNR is also known as the detectability index (d′), the hypotheses are signal present and signal absent.21–23,34,35 This simplifies the task function for 2D and 3D images (W2D and W3D, respectively) to
| (17) |
where O is the Fourier-domain object spectrum of the lesion of interest and CS its contrast. For the following study, the object function was defined as a Gaussian of the form
| (18) |
where wO defines the physical width of the object in the spatial domain. d′ for projection images (proj), 3D volumes (vol), and in-plane slices are calculated using21,34
| (19) |
Assuming parallel beam geometry, the MTF and NPS in y-direction are not affected by FSB or beam obliquity. The effects of contrast enhancement, selenium thickness, and image reconstruction on the y-direction MTF and NPS are equivalent to those for the responses in the x-direction. For these reasons, the analysis was simplified from 3D to 2D and from 2D to 1D problems by analyzing along the axis of fy = 0.
3. RESULTS AND DISCUSSION
3.A. Projection domain and detector performance
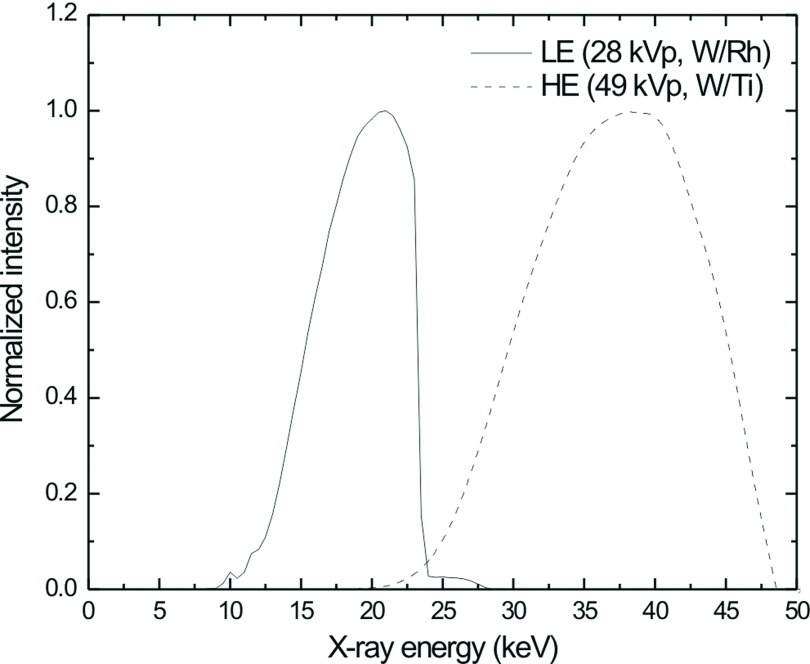
Figure 5 depicts the modeled x-ray output of a W anode for a LE x-ray spectrum (28 kVp, W/Rh) using Boone’s MASMIP model and a HE x-ray spectrum (49 kVp, W/Ti) using Boone’s TASMIP model.
FIG. 5.
Normalized x-ray spectra calculated using Boone’s MASMIP model for a LE (28 kVp, W/Rh) spectrum (solid line) and TASMIP model for a HE (49 kVp, W/Ti) spectrum (dashed line).
Seen in Fig. 6 is η(E) calculated using Eq. (1) as a function of photon energy (a) and total QDE as calculated using Eq. (3) for both LE and HE spectra as a function of dSe (b).
FIG. 6.
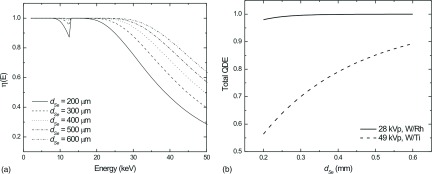
Theoretical calculation of η(E) as a function of photon energy (a) and total QDE as a function of dSe for a low energy x-ray spectrum (solid line—28 kVp, W/Rh) and an x-ray spectrum used for a high energy projection view of a dual-energy pair (dashed line—49 kVp, W/Ti) (b).
Increasing dSe results in substantial improvement of η(E) at higher energies. At 33.2 keV (the k-edge of iodine), increasing dSe from 200 to 500 μm results in an increase in η(E) from 66% to 96%.
For LE views, increasing dSe has little effect on QDE. Currently, typical a-Se mammographic detectors house photoconductive layers on the order of dSe = 200 μm. For typical DM applications, this thickness is adequate as QDE is ∼97%. Increasing dSe does result in increased efficiency but only by approximately 2% points. However, increasing dSe will have particularly beneficial effects for imaging above standard DM energies. Due to the increased absorption afforded by the thicker a-Se layer, QDE may increase from ∼56% for dSe = 200 μm up to 70% and 85% for dSe = 300 μm and dSe = 500 μm, respectively.
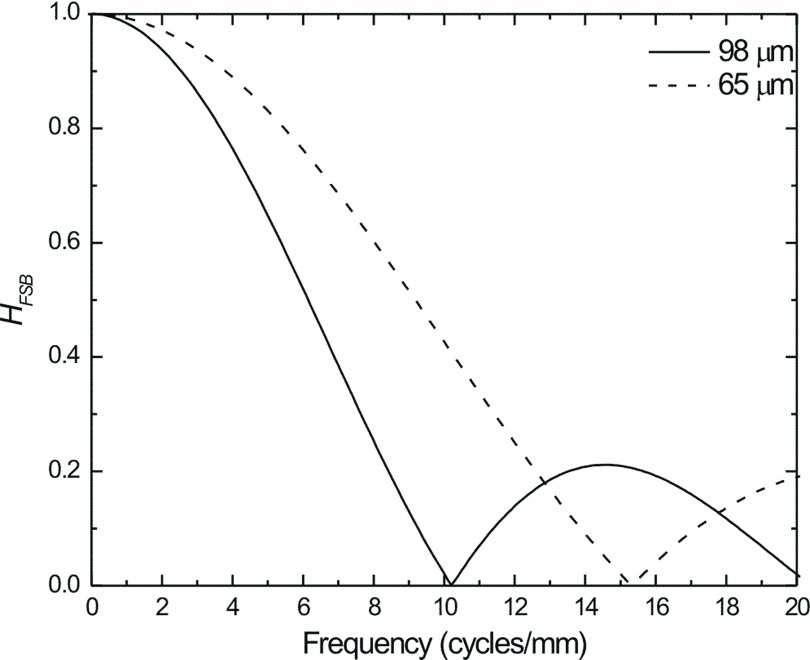
In order to determine the dominant factor affecting MTF and DQE for tomosynthesis projection views, the blurring due to FSM and total FSB must be considered. Seen in Fig. 7 is the MTF due to FSB as calculated in Eq. (4) for focal spot travel lengths (measured at the detector housing surface) of 98 and 65 μm. These correspond to x-ray exposure time of 150 and 100 ms, respectively, for tube travel velocity of 23 mm/s, similar to those used in clinical DBT systems.
FIG. 7.
MTF due to focal spot motion for a DBT acquisition at 0° employing continuous x-ray tube motion. HFSB was calculated for focal spot travel lengths of 95 μm (solid line) and 65 μm (dashed line) at the detector surface, which were similar to those used in current clinical systems.
The MTF due to beam obliquity for LE (a) and HE (b) as calculated using Eq. (6) may be seen in Fig. 8 for several dSe values. As shown in Fig. 8(a), increasing dSe above 200 μm has little effect on MTF due to beam obliquity at LE because essentially all photons are absorbed at this thickness. However at HE, as shown in Fig. 8(b), the increased x-ray penetration results in a longer path length through the thicker a-Se and more lateral spread of image charge. The MTF values at 3 cycles/mm are approximately 96%, 86%, 74%, 62%, and 55% for dSe values of 100, 200, 300, 400, and 500 μm, respectively.
FIG. 8.
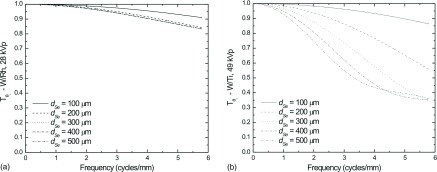
Calculation of the MTF due to oblique entry of x-ray photons at an angle of θi = 25° for (a) LE (28 kVp W/Rh), and (b) HE (49 kVp W/Ti) MTF due to oblique entry of x-rays were calculated according to Eq. (6).
The effect of dSe on the intrinsic detector performance, i.e., DQE without beam obliquity or FSB, is shown in Fig. 9 for both LE (a) and HE (b). Total glandular dose was set to 1.5 mGy for a 4 cm breast, which corresponds to a detector entrance exposure of 25 mR for the LE spectrum and 47 mR for the HE spectrum. For the LE case, DQE(0) improves from ∼0.76 up to a maximum value of 0.79, which represents a fairly small benefit for typical DM spectra. However, for the HE case, the DQE(0) is nearly doubled by increasing dSe = 200 to 500 μm.
FIG. 9.
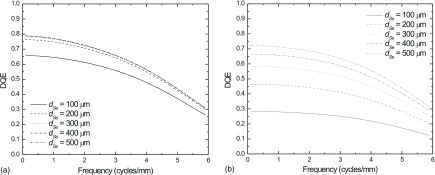
Intrinsic detector DQE (without FSB or beam obliquity) for LE (a), and HE (b) as a function of dSe. Total glandular dose was set equal to 1.5 mGy, which corresponds to detector entrance exposure of 25 and 47 mR for the LE and HE spectra, respectively.
In comparison, the DQE for the most oblique projection view in a DBT scan (25°) is plotted in Fig. 10 assuming a focal spot travel distance of 98 μm for an object placed on the surface of the detector housing. Both LE (a) and HE (b) DQEs are plotted for dSe ranging from 100 to 500 μm. Additional photoconductor thickness (above 200 μm) had little effect on the DQE for LE imaging. At HE, substantial gains in DQE(0) may be observed with increased dSe. However at high spatial frequencies, the MTF degradation due to oblique entry worsens with increased dSe, resulting in a crossover point where the DQE of the thinner layer exceeds that of the thicker. For the thickest layers, this crossover frequency is at a lower value than for the thinner layers.
FIG. 10.
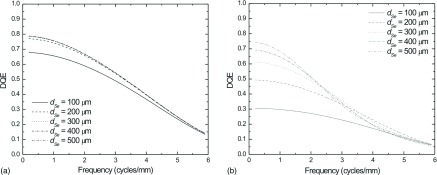
DQE of the most oblique DBT projection view (25°) with focal spot travel distance of 98 μm (measured at the detector housing surface) LE (a) and HE (b) images using a variety of values for dSe.
3.B. 3D system performance
As illustrated in Figs. 9 and 10, the effect of oblique entry of photons at a 25° angle results in significant image blurring when acquiring information with HE spectra, such that DQE at high frequencies for thicker photoconductor layers is lower than that for smaller dSe, despite increased absorption. However, when employing an FBP reconstruction algorithm, as is the case with most currently implemented clinical DBT systems, where reconstruction filters must be applied to limit high frequency noise and noise aliasing, blur due to oblique entry of x-rays may have a relatively small effect.
Seen in Fig. 11 are the in-plane MTF (left) as well as the 2D x–z plane MTF (right) for a system without (a) and with (b) modeled oblique entry of x-rays, where the calculation accounts for the different MTFs of each angle of acquisition. In each case, the MTF was calculated with an apodization filter width A = 0.7, as defined in Eq. (12), and the ST filter was either not applied or with B set equal to 0.085 or 0.035, as defined in Eq. (13). B = 0.085 represents the maximum window width where the ST filter removes all noise aliasing in the z-direction.
FIG. 11.
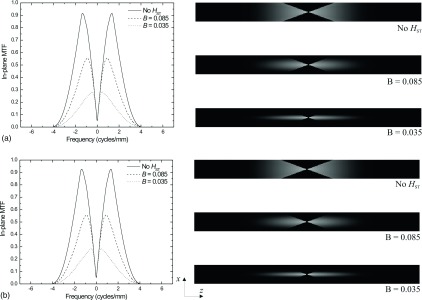
In-plane MTF (left) and x–z MTF (right) for a system without (a) and with (b) modeled oblique entry of x-rays, corresponding to the central ray of each view.
When comparing the in-plane MTF with and without the effect of oblique entry of x-rays, little difference is observed in spite of the obvious differences in the DQE as seen in Fig. 10.
Similarly, Fig. 12 plots the total projection space MTF after the application of the SA filter (A = 0.7) but not the ST filter, for the 25° projection view may be seen for LE images (a) and HE images (b). Although at 25° significant blurring is observed in Fig. 8(b), the residual effect after application of the SA filter is minimal for all values of dSe. In the case of LE images, the thickness of the a-Se layer has almost no effect on the total MTF.
FIG. 12.
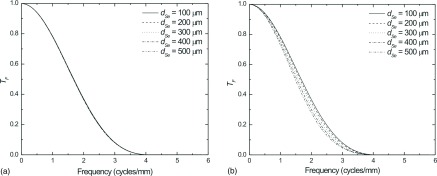
Comparison of the total projection space MTF after application of the SA filter (A = 0.7) for the 25° projection view for LE (a) and HE (b) images. The model also incorporates FSB where the focal spot moves 98 μm at the detector surface.
Figure 13 plots a comparison of the blur functions associated with a HE DBT scan for a detector with dSe = 500 μm (a) and the detector’s total projection space MTF for a number of view angles after a SA filter was applied where A = 0.7 (b). While an appreciable decrease in the MTF due to x-ray obliquity may be observed, the dominant source of blur was the reconstruction filter. It is clear from Figs. 12 and 13 that the effect of the SA filter, set at 0.7 (which is consistent with clinical implementation) serves as the dominant source of blur. With application of the ST filter, the residual effect of x-ray obliquity should be effectively negligible as observed in Fig. 11.
FIG. 13.
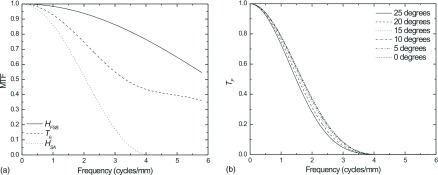
Plot of the magnitude of the blurring functions associated with a projection view (25°) of HE DBT scan using a detector where dSe = 500 μm (a) and calculation of the total filtered projection space MTF (b) for a number views of the same DBT scan (b). The calculation assumes a focal spot travel distance 98 μm at the detector surface and a FBP algorithm where HRA and HSA are applied with A = 0.7.
3.C. Comparison of overall system performance for both DM and DBT
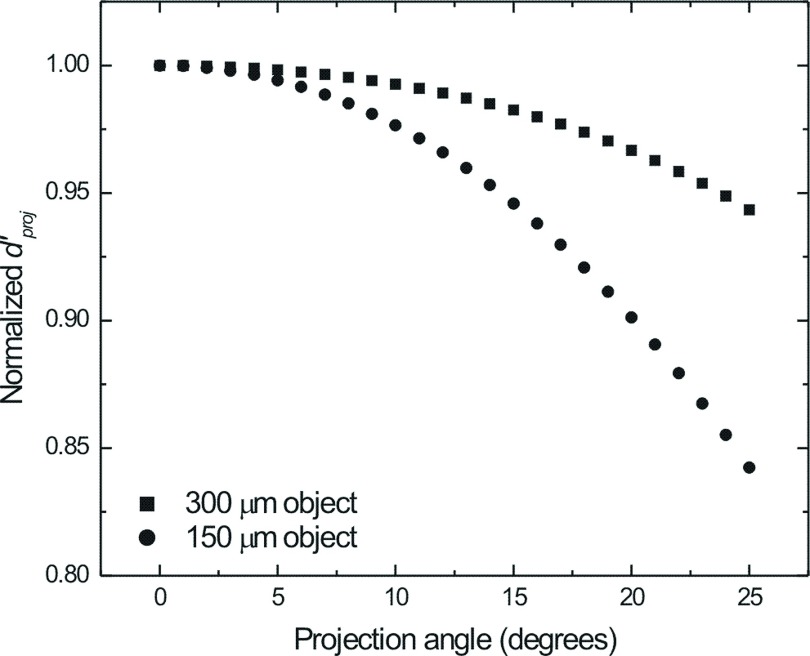
The total effect of increasing dSe of the direct conversion FPI may be determined by examining the detectability index, d′, for the ideal observer. Figure 14 plots the projection domain detectability index ( for a single 1.5 mGy DE projection image, which was normalized to the value at the central projection, as a function of acquisition angle for 300 and 150 μm Gaussian objects imaged after DE subtraction. Modeling for DE subtraction using the cascaded linear system model was described in detail previously.23–25 No reconstruction filters were added and the total glandular dose for the DE projection was set equal to 1.5 mGy. The fraction of dose allocated to the HE view (fh) was set to 0.6. In both the 300 and 150 μm cases, decreased as a function of view angle due to the increased blurring at the most oblique views. This effect is particularly pronounced with the 150 μm object, which, because of its smaller size, retains greater object signal power at high frequencies.
FIG. 14.
Normalized projection domain ideal observer SNR ( for a dSe = 300 μm detector imaging 300 μm (squares) and 150 μm (circles) Gaussian objects using a DE subtraction technique as a function of the projection angle. Total glandular dose for each DE-DBT scan was set to 1.5 mGy. The fraction of the total dose allocated to the HE view (fh) was 0.6.
In Fig. 15, is calculated for DE projections acquired at 25° and 0° as a function of dSe for 300 μm (a) and 150 μm objects (b). The total glandular dose for the DE CE-DM acquisition was set to 1.5 mGy. The values in the plots were normalized to the maximum value for the 0° view. For the 0° view, increasing dSe results in an increase in due to the increased absorption (and subsequently lower noise) without corresponding losses in MTF. For the 25° view an optimal value for dSe exists, such that is maximized. Above this value, losses in high frequency MTF outweigh gains in photon absorption. For larger objects, such as the 300 μm object, which retain more signal power at low frequencies than smaller objects (e.g., 150 μm), this optimal point corresponds to a higher dSe. Similarly, losses in above the optimal dSe are smaller for the larger objects.
FIG. 15.
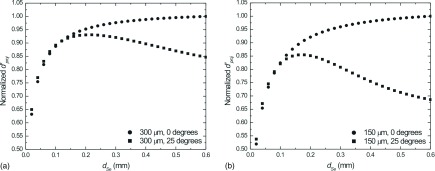
Normalized ideal observer SNR (d′) for 25° DE projection views (squares) and 0° DE projection views (circles) of a DBT scan as a function of dSe for 300 μm (a) and 150 μm (b) Gaussian objects. Total glandular dose was set equal to 1.5 mGy in all cases. In each case, fh was optimized to yield the greatest value of .
Figure 16 plots for a DE-DBT study as a function of dSe with and without the effect of oblique entry (i.e., partially and complete isocentric geometries, respectively) for 300 μm (a) and 150 μm (b) Gaussian objects. Values for were normalized to the maximum value for comparison. In both cases, increasing dSe results in increased object detectability with negligible effect of image blur from oblique entry of x-rays. This is because blur is dominated by application of reconstruction filters.
FIG. 16.
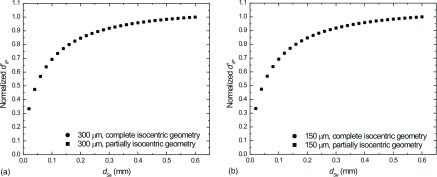
Normalized 3D ideal observer SNR (d′) as a function of a-Se thickness for 300 μm (a) and 150 μm (b) Gaussian objects modeled with (i.e., partially isocentric geometry—squares) and without (i.e., complete isocentric geometry—circles) the effect of x-ray obliquity. Total glandular dose was set equal to 1.5 mGy in each case. In each case, fh was optimized to yield the greatest value of .
4. CONCLUSIONS
Increasing dSe in an a-Se FPI results in increased photon absorption and DQE at high energies used in DE-DM and DE-DBT. However, since DBT is often implemented with partially isocentric geometry, oblique entry of x-ray photons may degrade the projection-space MTF, particularly as dSe and x-ray tube potential increases. However, when DBT is applied using an analytical reconstruction algorithm, such as FBP, where noise and noise aliasing are handled by applying low-pass filters, the dominant source of blur may not be oblique entry of x-rays and focal spot motion but rather the reconstruction filter kernel. In these cases, increasing dSe is positively correlated with object detectability for both DE-DM and DE-DBT applications.
ACKNOWLEDGMENTS
The authors gratefully acknowledge the financial support from NIH (1 R01 CA148053 and 1 R01 EB002655) and Siemens Healthcare.
REFERENCES
- 1.Dromain C.et al. , “Dual-energy contrast-enhanced digital mammography: Initial clinical results,” Eur. Radiol. 21, 565–574 (2011). 10.1007/s00330-010-1944-y [DOI] [PubMed] [Google Scholar]
- 2.Diekmann F.et al. , “Digital mammography using iodine-based contrast media: Initial clinical experience with dynamic contrast medium enhancement,” Invest. Radiol. 40, 397–404 (2005). 10.1097/01.rli.0000167421.83203.4e [DOI] [PubMed] [Google Scholar]
- 3.Diekmann F.et al. , “Evaluation of contrast-enhanced digital mammography,” Eur. J. Radiol. 78, 112–121 (2011). 10.1016/j.ejrad.2009.10.002 [DOI] [PubMed] [Google Scholar]
- 4.Dromain C.et al. , “Contrast-enhanced digital mammography,” Eur. J. Radiol. 69, 34–42 (2009). 10.1016/j.ejrad.2008.07.035 [DOI] [PubMed] [Google Scholar]
- 5.Dromain C.et al. , “Evaluation of tumor angiogenesis of breast carcinoma using contrast-enhanced digital mammography,” Am. J. Roentgenol. 187, W528–W537 (2006). 10.2214/AJR.05.1944 [DOI] [PubMed] [Google Scholar]
- 6.Dromain C.et al. , “Dual-energy contrast-enhanced digital mammography: Initial clinical results of a multireader, multicase study,” Breast Cancer Res. 14, 1–18 (2012). 10.1186/bcr3210 [DOI] [PMC free article] [PubMed] [Google Scholar]
- 7.Fredenberg E.et al. , “Contrast-enhanced spectral mammography with a photon-counting detector,” Med. Phys. 37, 2017–2029 10.1118/1.3371689 [DOI] [PubMed] [Google Scholar]
- 8.Hill M. L.et al. , “Anatomical noise in contrast-enhanced digital mammography. Part I. Single-energy imaging,” Med. Phys. 40, 051910 (10pp.) (2013). 10.1118/1.4801905 [DOI] [PubMed] [Google Scholar]
- 9.Lewin J. M.et al. , “Dual-energy contrast-enhanced digital subtraction mammography: Feasibility1,” Radiology 229, 261–268 (2003). 10.1148/radiol.2291021276 [DOI] [PubMed] [Google Scholar]
- 10.Carton A.-K.et al. , “Quantification for contrast-enhanced digital breast tomosynthesis,” Proc. SPIE 6142, 61420D–61411 (2006). 10.1117/12.654682 [DOI] [Google Scholar]
- 11.Carton A.-K.et al. , “Dual-energy subtraction for contrast-enhanced digital breast tomosynthesis,” Proc. SPIE 6510, 651007–651012 (2007). 10.1117/12.713703 [DOI] [Google Scholar]
- 12.Carton A.-K.et al. , in Digital Mammography: 9th International Workshop, IWDM 2008, edited by Krupinski E. (Springer, Berlin/Heidelberg, NY, 2008), Vol. 5116, pp. 116–123. [Google Scholar]
- 13.Hu Y.-H. and Zhao W., “A 3D linear system model for the optimization of dual-energy contrast-enhanced digital breast tomosynthesis,” Proc. SPIE 7961, 79611C–79619 (2011). 10.1117/12.878134 [DOI] [Google Scholar]
- 14.Hu Y.-H. and Zhao W., “Experimental quantification of lesion detectability in contrast enhanced dual energy digital breast tomosynthesis,” Proc. SPIE 8313, 83130A–83110 (2012). 10.1117/12.911433 [DOI] [Google Scholar]
- 15.Hu Y.-H., Scaduto D. A., and Zhao W., “Optimization of clinical protocols for contrast enhanced breast imaging,” Proc. SPIE 8668, 86680G–86689 (2013). 10.1117/12.2008028 [DOI] [Google Scholar]
- 16.Zhao B. and Zhao W., “Three-dimensional linear system analysis for breast tomosynthesis,” Med. Phys. 35, 5219–5232 (2008). 10.1118/1.2996014 [DOI] [PMC free article] [PubMed] [Google Scholar]
- 17.Zhao B.et al. , “Experimental validation of a three-dimensional linear system model for breast tomosynthesis,” Med. Phys. 36, 240–251 (2009). 10.1118/1.3040178 [DOI] [PMC free article] [PubMed] [Google Scholar]
- 18.Zhao W., Ji W. G., and Rowlands J. A., “Effects of characteristic x rays on the noise power spectra and detective quantum efficiency of photoconductive x-ray detectors,” Med. Phys. 28, 2039–2049 (2001). 10.1118/1.1405845 [DOI] [PubMed] [Google Scholar]
- 19.Zhao W.et al. , “Digital radiology using active matrix readout of amorphous selenium: Detectors with high voltage protection,” Med. Phys. 25, 539–549 (1998). 10.1118/1.598229 [DOI] [PubMed] [Google Scholar]
- 20.Hu Y.-H., Zhao B., and Zhao W., “Image artifacts in digital breast tomosynthesis: Investigation of the effects of system geometry and reconstruction parameters using a linear system approach,” Med. Phys. 35, 5242–5252 (2008). 10.1118/1.2996110 [DOI] [PMC free article] [PubMed] [Google Scholar]
- 21.Hu Y.-H. and Zhao W., “The effect of angular dose distribution on the detection of microcalcifications in digital breast tomosynthesis,” Med. Phys. 38, 2455–2466 (2011). 10.1118/1.3570580 [DOI] [PMC free article] [PubMed] [Google Scholar]
- 22.Richard S. and Samei E., “Quantitative imaging in breast tomosynthesis and CT: Comparison of detection and estimation task performance,” Med. Phys. 37, 2627–2637 (2010). 10.1118/1.3429025 [DOI] [PubMed] [Google Scholar]
- 23.Richard S. and Siewerdsen J. H., “Optimization of dual-energy imaging systems using generalized NEQ and imaging task,” Med. Phys. 34, 127–139 (2007). 10.1118/1.2400620 [DOI] [PubMed] [Google Scholar]
- 24.Richard S. and Siewerdsen J. H., “Cascaded systems analysis of noise reduction algorithms in dual-energy imaging,” Med. Phys. 35, 586–601 (2008). 10.1118/1.2826556 [DOI] [PubMed] [Google Scholar]
- 25.Richard S.et al. , “Generalized DQE analysis of radiographic and dual-energy imaging using flat-panel detectors,” Med. Phys. 32, 1397–1413 (2005). 10.1118/1.1901203 [DOI] [PubMed] [Google Scholar]
- 26.Boone J., “Spectral modeling and compilation of quantum fluence inn radiography and mammography,” Proc. SPIE 3336, 592–601 (1998). 10.1117/12.317063 [DOI] [Google Scholar]
- 27.Boone J. M. and Seibert J. A., “An accurate method for computer-generating tungsten anode x-ray spectra from 30 to 140 kV,” Med. Phys. 24, 1661–1670 (1997). 10.1118/1.597953 [DOI] [PubMed] [Google Scholar]
- 28.Zhao W. and Rowlands J. A., “Digital radiology using active matrix readout of amorphous selenium: Theoretical analysis of detective quantum efficiency,” Med. Phys. 24, 1819–1833 (1997). 10.1118/1.598097 [DOI] [PubMed] [Google Scholar]
- 29.Hu Y.-H., Masiar M., and Zhao W., “Breast structural noise in digital breast tomosynthesis and its dependence on reconstruction methods,” in Digital Mammography: 10th International Workshop, IWDM, 2010 (Springer Berlin, Heidelberg, 2010), Vol. 6136, pp. 598–605. [Google Scholar]
- 30.Mainprize J. G.et al. , “Resolution at oblique incidence angles of a flat panel imager for breast tomosynthesis,” Med. Phys. 33, 3159–3164 (2006). 10.1118/1.2241994 [DOI] [PubMed] [Google Scholar]
- 31.Hu Y.-H. and Zhao W., “Nonuniform angular dose distribution in digital breast tomosynthesis for increased conspicuity of small high contrast objects,” Proc. SPIE 7258, 72580Q–72588Q (2009). 10.1117/12.813744 [DOI] [Google Scholar]
- 32.Lauritsch G. and Haerer W. H., “Theoretical framework for filtered back projection in tomosynthesis,” Proc. SPIE 3338, 1127–1137 (1998). 10.1117/12.310839 [DOI] [Google Scholar]
- 33.Mertelmeier T.et al. , “Optimizing filtered backprojection reconstruction for a breast tomosynthesis prototype device,” Proc. SPIE 6142, 61420F–61412 (2006). 10.1117/12.651380 [DOI] [Google Scholar]
- 34.Vennart W., “ICRU Report 54: Medical imaging—The assessment of image quality,” Radiography 3, 243–244 (1997). 10.1016/S1078-8174(97)90038-9 [DOI] [Google Scholar]
- 35.Gang G. J.et al. , “Analysis of Fourier-domain task-based detectability index in tomosynthesis and cone-beam CT in relation to human observer performance,” Med. Phys. 38, 1754–1768 (2011). 10.1118/1.3560428 [DOI] [PMC free article] [PubMed] [Google Scholar]


