Abstract
We apply femtosecond pulse shaping to generate optical pulse trains that directly access a material’s nonlinear refractive index (n2) and can thus determine time-resolved optical Kerr-effect (OKE) dynamics. Two types of static pulse trains are discussed: The first uses two identical fields delayed in time, plus a pump field at a different wavelength. Time-resolved OKE dynamics are retrieved by monitoring the phase of the interference pattern produced by the two identical fields in the Fourier-domain (FD) as a function of pump–probe–time–delay (where the probe is one of the two identical fields). The second pulse train uses three fields with equal time delays, but with the center field phase shifted by π/2. In this pulse scheme, changes on a sample’s nonlinear refractive index produce a new frequency in the FD signal, which in turn yields background-free intensity changes in the conjugate (time) domain and provides superior signal-to-noise ratios. The demonstrated sensitivity improvements enable, for the first time to our knowledge, molecular imaging based on OKE dynamics.
Nonlinear optical imaging techniques have proven immensely useful in the field of biology and medicine [1–4]. For example, the inherent cross-sectional ability and high sensitivity of multiphoton excitation fluorescence (MPEF) microscopy has enabled high-resolution imaging of intact biological tissues at unprecedented depths using exogenous agents [2]. Other groups, including ours, have used pump–probe (pu-pr) schemes to gain access to other nonlinear interactions (such as stimulated Raman scattering, excited state absorption, and ground-state bleaching) for highly specific molecular contrast of endogenous species in applications such as melanoma diagnosis [4–6]. In general, most nonlinear imaging techniques rely on interactions that generate new optical frequencies, or that result in attenuation/ amplification of a probe beam. Nonlinear interactions that only result in phase changes [self-phase modulation (SPM), and cross-phase modulation (XPM)] remain largely unexplored in microscopy and are the focus of this Letter.
The gold standard for measuring SPM is the Z-scan technique [7]. In this method, a transparent material of interest is scanned along the focus of a femtosecond beam, and transmitted light is collected after passing through a small aperture. Changes in the amount of light passing through the aperture can be related to n2, with high sensitivity. However, this approach is relatively slow, can only be used to assess bulk n2 properties, and is also rapidly degraded by scattering [8], making it ill-suited for imaging biological samples. To overcome these challenges Fischer and colleagues have developed a number of techniques based on femtosecond pulse shaping that measure n2 with the same inherent cross-sectional capabilities as MPEF microscopy, at fast speeds and with high sensitivity [9–12]. These methods have been applied to, for example, monitoring chemically activated neurons [10] and imaging of various biological samples [11–13]. However, these methods are mostly sensitive to the instantaneous nonresonant electronic response, which, unlike the other aforementioned nonlinear interactions, has poor molecular specificity. Microscopy with molecular contrast based on a material’s ultrafast time-varying nonlinear phase response, i.e., time-resolved optical Kerr effect (OKE), which contains highly specific molecular information, has not been demonstrated. (The OKE dynamic response describes the time evolution of the optically induced third-order polarization anisotropy, which is highly dependent on a molecule’s structure and surrounding medium [14–16].) Ultimately, current nonlinear phase imaging techniques have shown limited utility due to their lack of molecular specificity.
Recently, we showed that OKE dynamics could be ascertained from wavelength-dependent phase changes on a probe beam using a modified pu-pr system with a Michelson interferometer and Fourier-domain (FD) detection [17]. The approach used techniques similar to holography and enabled indirect measure of the OKE dynamics. In this Letter, we improve on our previous work by employing femtosecond pulse shaping for greater phase stability. We further leverage the flexibility of the pulse shaper to design different pulse trains that provide direct access to the OKE dynamics. Finally, we demonstrate imaging of a biological sample with endogenous molecular contrast based on OKE dynamics.
The experimental system consists of a pu-pr set up with a regenerative amplifier (RegA, Coherent) laser source seeded by a Ti:sapphire oscillator (Vitesse, Coherent), with a repetition rate of 20 kHz and center wavelength of 808 nm. Eighty percent of the light is sent into an optical parametric amplifier (OPA, Coherent) to produce a pump beam at 690 nm. The other 20% of the RegA output is sent to 4-f pulse shaper [18] to generate two to three time-delayed replicas of the input field (i.e., pulse train). The pulse train and the pump beam are combined using a dichroic mirror, and are then focused onto a sample with a 10×, 0.25 NA microscope objective. All pulses are ~75 fs, and the power of the pump is 300 μW and that of the two-/three-field pulse train is <10 μW (similar total power levels to [10]). For the nonimaging experiments, the pump beam is removed after passing through the sample using a dichroic filter, and a high-resolution spectrometer (HR4000, Ocean Optics) is used to detect the pulse train. The spectrometer integration time is set to its minimum value (4 ms) and signals are recoded without averaging. The samples are carbon disulfide (CS2) and pure water, each placed in separate cuvettes. These are chosen since their OKE dynamics have been well studied [15,16]; further, water is a good benchmark for potential biological applications. Glass is also used to model the electronic response. For the imaging experiment, the pump and pulse train are sent to a scanning laser microscope, then the pump and part of the probe spectrum are removed. A photo diode is used for detection. More details regarding the imaging setup are provided below.
Two-Field Pulse Train
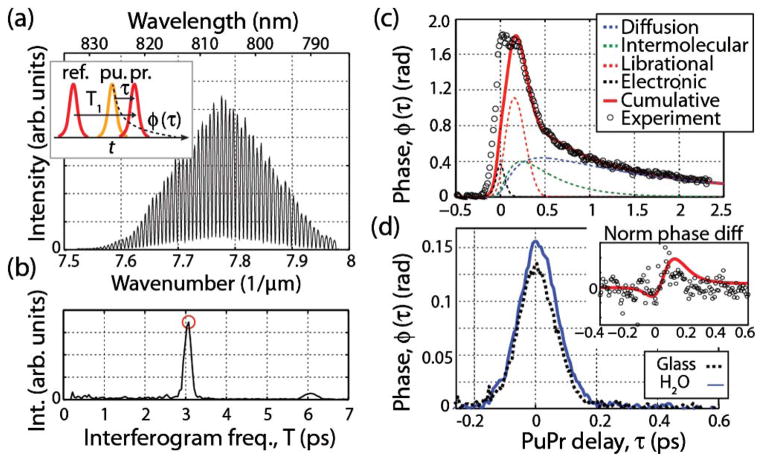
The inset of Fig. 1(a) illustrates the two-field pulse train at the sample: The first field that enters the sample (labeled “ref.”) is used as a reference, then the pump beam produces the temporal nonlinear dynamics, ϕ(τ), and finally, after a given pu-pr time-delay, τ, the probe beam passes through the focus and experiences a phase shift. The pulse train after passing through the focus can be described in the time domain as
Fig. 1.
(a) Detected FD signal of two-field pulse train. The inset shows the pulse train where the two identical fields (ref. and probe) are delayed by T1 = 3 ps and the pump arrives after ref. to produce the temporal nonlinear dynamics. (b) Absolute value of the FT of (a). The phase at the peak (red circle) reveals the OKE dynamics. (c) Measured CS2 OKE dynamics along with the expected response. (d) Measured OKE dynamics of water and glass. The inset shows the experimental (circles) and expected (red line) difference after normalizing.
| (1) |
where T1 (set to 3 ps) is the delay between the two identical fields. Thus, the detected FD signal, illustrated in Fig. 1(a), is given by
| (2) |
As Eq. (2) shows, the nonlinear dynamics are encoded as a phase change at a frequency of T1 of the detected interferogram. Thus, the OKE dynamics are accessed by taking a Fourier transform (FT) [absolute value shown in Fig. 1(b)] and then monitoring the phase at the peak [red circle in Fig 1(b)]. This is repeated at each pu-pr time delay to finally obtain the temporal phase dynamics.
The results for CS2, water, and glass are shown in Figs. 1(c) and 1(d). Figure 1(c) also plots the various processes (dashed lines) that contribute to the total response (red line) for CS2, as modeled by Heisler et al. [15]. This provides a benchmark for the quantitative abilities of this approach. And indeed, the measured response and model are in excellent agreement (a small discrepancy is observed near τ ~ 0 ps likely due to unaccounted instantaneous effects). Figure 1(d) shows the results for glass (electronic response) and water. Here, clear differences can be seen, but only in the amplitude of the signals; differences in their dynamic response, which contain the molecular information of interest, are much more subtle. To highlight these differences, the electronic response is subtracted from the water response after normalizing each by its maximum value. The inset of Fig. 1(d) shows the resulting dynamics, where the data are in general agreement with the expected behavior, as modeled by Chang and Castner [16], but they are extremely noisy.
In our previous work [17], briefly discussed above, the temporal phase dynamics were inaccessible due to the poor phase stability of the Michelson interferometer used to generate the two fields (ref. and pr.). To gain insight into the OKE dynamics, we instead monitored wavelength-dependent phase changes of the probe beam at a fixed pu-pr time delay of τ ~ 0 fs. Here, we repeat this process and add a variable time delay. To obtain the wavelength-dependent phase changes, techniques similar to holography are used [17,19]: The time-domain peak [shown in Fig. 1(b)] is filtered and shifted to DC, then the signal is transformed back to the FD, and finally, the angle of the complex data as a function of wavelength is computed. Then spectral phase dynamics are isolated by removing any offsets; in other words, the average spectral phase at each pu-pr time delay is removed. This final step removes a significant portion of the noise and provides a highly sensitive measure of the temporal dynamics. In [17], we showed that the spectral phase behavior is related to the second derivative of ϕ(τ); thus, this approach only gives an indirect measure of ϕ(τ).
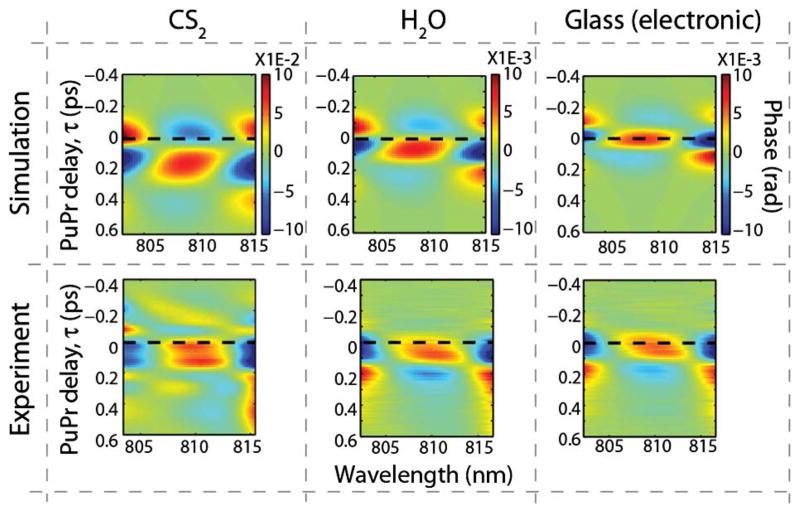
Results of the spectral phase dynamics are shown in Fig. 2, where the experiments are in good qualitative agreement with our previous theoretical predictions (simulations) [17]. As expected, the maximum response for the electronic signal occurs when the pump and probe beams are overlapped in time, τ = 0, but shifted to a later time for water, and even more for CS2. One complication of this approach stems from the fact that the dominant features that differentiate these molecules are small temporal shifts. The shifts here are in the order of a few to tens of femtoseconds, which could also be easily produced when the pump and probe beams of different wavelengths propagate through a dispersive medium. For example, after propagating 1 mm in water, the group-velocity difference between the 808 nm probe and 690 nm pump produces a temporal shift of ~12 fs. Thus, extreme care must be taken when analyzing data in this manner. Nonetheless, analysis of the spectral phase clearly differentiates between the electronic and water responses, whereas the temporal phase, ϕ(τ), does so with extremely poor signal-to-noise ratios (SNR).
Fig. 2.
Theoretical [17] and experimental spectral-phase dynamics for CS2, water, and glass. The dashed black line indicates τ = 0.
Three-Field Pulse Train
To directly recover the OKE dynamics with high SNR, we introduce a novel pulse sequence consisting of three equally spaced fields, but with the center field phase shifted by π/2. In the time domain, the three-field pulse train can be expressed as
| (3) |
and is illustrated in the inset of Fig. 3(a). Thus, the detected FD signal is
Fig. 3.
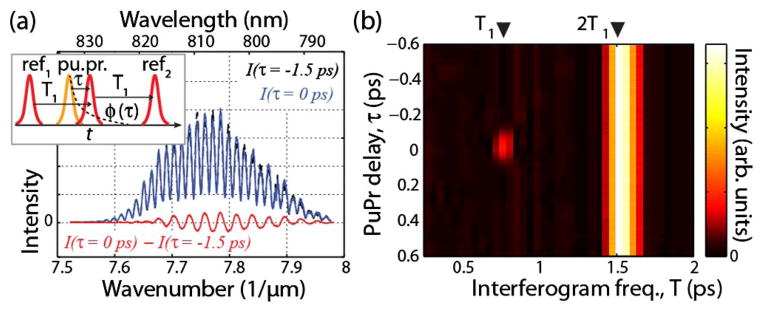
(a) Raw interferometric data at two pu-pr time delays (solid blue line and dotted black line). The red line is the difference between the two, which highlights the generated frequency when nonlinear phase changes occur. (b) FT of interferometric data as a function of pu-pr time delay.
| (4) |
assuming that the nonlinear phase changes, ϕ(τ), are small. Similar to other nonlinear methods, for example MPEF, the nonlinear phase interaction described here produces a new frequency, but in this case it is a frequency in the detected interferogram. Effectively, setting the phase of the center field to π/2 causes the interference between ref1 and the probe to cancel out the interference between the probe and ref2. When a non-linear phase change occurs, this balance is perturbed and triggers constructive interference at a well-defined frequency. This idea is similar to that of frequency modulation spectroscopy [20], but with the domains switched. Figure 3(a) shows the measured FD signal in water at two pu-pr time-delays, τ = −1.5 ps and 0 ps, corresponding to ϕ(τ) = 0 and 0.15 rad, respectively. The figure also plots the difference between the two, which clearly shows the new generated signal with a frequency of T1. Figure 3(b) shows the absolute value of the FT as a function of pu-pr time delay. Here, a peak can be observed at a frequency of 2T1 for all τ’s, corresponding to the interference between ref1 with ref2. On the other hand, the signal at T1 is only observed when the probe experiences a phase shift from the pump interacting with the sample, around τ = 0. We also note that ϕ(τ) is encoded with a sinusoid that is in phase with the 2T1 signal, therefore, quantitative results are achieved by only monitoring the real (in-phase) component.
Figure 4 shows the in-phase component of the spectral oscillations at a frequency of T1 for water and glass (i.e., vertical trace of Fig. 3(b) at T1). The behavior is similar to that obtained with the two-field pulse train [Fig. 1], but a significant SNR improvement can be seen. Indeed, Fig 4(b) shows that this pulse train is able to differentiate between the water and electronic OKE dynamics with high SNR. (The figure shows the difference of the two after normalizing by their peak response.) Further, the experimental results are in excellent agreement with the expected behavior (the small discrepancies are due to uncompensated temporal shifts).
Fig. 4.
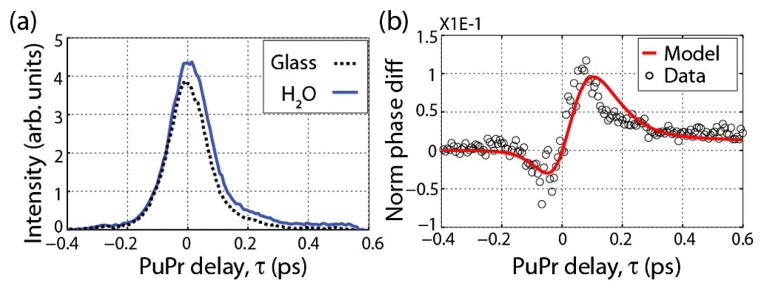
(a) Water and glass (electronic response) OKE dynamics measured using the three-field pulse train. (b) Difference between water and electronic response after normalizing each.
The SNR improvement of the three-field over the two-field pulse train is five-fold [Fig. 4(b) compared to the inset of Fig. 1(d)]. Specifically, the phase sensitivity of the two-field pulse train is ~2.5 mrad, whereas that of the three-field pulse train is ~0.5 mrad. There are two reasons for this improvement: First, the signal is background-free, which reduces the noise. Second, because the phase changes are converted to amplitude, the signal benefits form an interferometric gain. In other words, ref1 and ref2 not only act as references, but their amplitudes are also amplifying the effects of ϕ(τ) in the measured signal, as described by Eq. (4).
To demonstrate molecular imaging based on OKE dynamics, we use a single layer of epidermal cells from an onion. For simplicity, the detection scheme is altered: Rather than using a spectrometer, we use a narrow-band filter (3 nm wide centered at 808 nm, which isolates one of the lobes of the new generated spectral frequency) and a photodiode. In addition, the pump beam is modulated at 5 kHz, and the collected photodiode signal is passed through a boxcar integrator and onto a lock-in-amplifier (3 ms time constant). This configuration allows for light to be collected in transmission mode as the beam is scanned across the sample. Figure 5 shows the results where a hue saturation value (HSV) image display mode is used. The value is derived from the total energy of each image pixel (i.e., integral of signal across all pu-pr time delays). The hue of the image reflects differences in OKE dynamics, and is produced by projecting each pixel’s dynamic signal onto the top two principal components of the data set (i.e., all spectra) and taking the ratio. The saturation value is set to 1. As Fig. 5 shows, the body of the cell has a green hue, whereas the cell wall has a red hue, indicating the regions have different dynamics. Figure 5(b) illustrates dynamics from two representative regions of interest, where the cell body (dashed green line) shows slightly longer-lived dynamics than the wall (red line), likely due to a more restrictive environment for molecular reorientation in the cell wall.
Fig. 5.
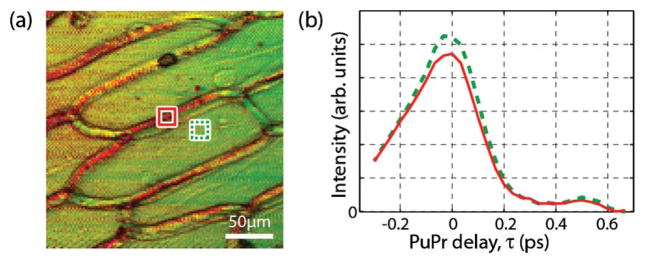
(a) Image of a single layer of epidermal cells from an onion with molecular contrast based on OKE dynamics. The image uses a HSV color mode, where the hue encodes differences in the OKE dynamics. Pump power is 300 μW and pulse-train power is 10 μW. Acquisition time per time-delay is ~60 s. (b) OKE dynamics of two regions of interest: cell body (dashed green) and cell wall (red).
In conclusion, we have developed two methods that directly access a sample’s OKE dynamics. The two-field pulse train is particularly well suited for measuring samples with strong, long-lived OKE dynamics, such as CS2, but its sensitivity is insufficient for biological materials. A significant improvement was demonstrated with the three-field pulse train, which translates nonlinear phase changes to background-free intensity changes. This simple modification shows sufficient sensitivity for biological applications. The measured signals for both methods are quantitative and linear with the OKE response. Finally, we demonstrated, for the first time to our knowledge, molecular imaging based on OKE dynamics using epidermal cells from an onion. Future work will focus on improving the imaging system’s sensitivity and speed by operating in reflection mode, descanning, and detecting the pulse train with a high-resolution spectrometer. The methods presented here bridge the gap between extremely sensitive methods that are too slow for imaging applications [14–16], and those that are well suited for imaging but lack the means to access the time-resolved OKE dynamics [9,11,21]. This novel form of molecular contrast could lead to exciting applications in cell biology and medicine. For example, identifying disease states that affect molecular diffusion and intracellular reorientation due to increased chromatin.
Acknowledgments
We gratefully acknowledge our funding sources: NIH R01-CA166555 (WSW), the Burroughs Welcome Fund 1012639 (FER), NIH F32CA183204 (FER), NSF CHE-1309017 (MCF), and Duke University.
References
- 1.Denk W, Strickler JH, Webb WW. Science. 1990;248:73. doi: 10.1126/science.2321027. [DOI] [PubMed] [Google Scholar]
- 2.Horton NG, Wang K, Kobat D, Clark CG, Wise FW, Schaffer CB, Xu C. Nat Photonics. 2013;7:205. doi: 10.1038/nphoton.2012.336. [DOI] [PMC free article] [PubMed] [Google Scholar]
- 3.Saar BG, Freudiger CW, Reichman J, Stanley CM, Holtom GR, Xie XS. Science. 2010;330:1368. doi: 10.1126/science.1197236. [DOI] [PMC free article] [PubMed] [Google Scholar]
- 4.Matthews TE, Piletic IR, Selim MA, Simpson MJ, Warren WS. Sci Trans Med. 2011;3:71ra15. doi: 10.1126/scitranslmed.3001604. [DOI] [PMC free article] [PubMed] [Google Scholar]
- 5.Robles FE, Wilson JW, Warren WS. J Biomed Opt. 2013;18:120502. doi: 10.1117/1.JBO.18.12.120502. [DOI] [PMC free article] [PubMed] [Google Scholar]
- 6.Wilson JW, Vajzovic L, Robles FE, Cummings TJ, Mruthyunjaya P, Warren WS. Investig Ophthalmol Vis Sci. 2013;54:6867. doi: 10.1167/iovs.13-12432. [DOI] [PMC free article] [PubMed] [Google Scholar]
- 7.Chapple PB, Staromlynska J, Hermann JA, McKay TJ, McDuff RG. J Nonlinear Opt Phys Mater. 1997;6:251. [Google Scholar]
- 8.Samineni P, Perret Z, Warren W, Fischer MC. Opt Express. 2010;18:12727. doi: 10.1364/OE.18.012727. [DOI] [PMC free article] [PubMed] [Google Scholar]
- 9.Fischer M, Ye T, Yurtsever G, Miller A, Ciocca M, Wagner W, Warren W. Opt Lett. 2005;30:1551. doi: 10.1364/ol.30.001551. [DOI] [PubMed] [Google Scholar]
- 10.Fischer MC, Liu HC, Piletic IR, Escobedo-Lozoya Y, Yasuda R, Warren WS. Opt Lett. 2008;33:219. doi: 10.1364/ol.33.000219. [DOI] [PubMed] [Google Scholar]
- 11.Samineni P, Li B, Wilson JW, Warren WS, Fischer MC. Opt Lett. 2012;37:800. doi: 10.1364/OL.37.000800. [DOI] [PMC free article] [PubMed] [Google Scholar]
- 12.Wilson JW, Samineni P, Warren WS, Fischer MC. Biomed Opt Express. 2012;3:854. doi: 10.1364/BOE.3.000854. [DOI] [PMC free article] [PubMed] [Google Scholar]
- 13.Li B, Claytor KE, Yuan H, Vo-Dinh T, Warren WS, Fischer MC. Opt Lett. 2012;37:2763. doi: 10.1364/OL.37.002763. [DOI] [PubMed] [Google Scholar]
- 14.Potma EO, de Boeij WP, Wiersma DA. Biophys J. 2001;80:3019. doi: 10.1016/S0006-3495(01)76267-4. [DOI] [PMC free article] [PubMed] [Google Scholar]
- 15.Heisler IA, Correia RRB, Buckup T, Cunha SLS, da Silveira NP. J Chem Phys. 2005;123:054509. doi: 10.1063/1.1994850. [DOI] [PubMed] [Google Scholar]
- 16.Chang YJ, Castner EW. J Chem Phys. 1993;99:113. [Google Scholar]
- 17.Robles FE, Samineni P, Wilson JW, Warren WS. Opt Express. 2013;21:9353. doi: 10.1364/OE.21.009353. [DOI] [PMC free article] [PubMed] [Google Scholar]
- 18.Dugan MA, Tull JX, Warren WS. J Opt Soc Am B. 1997;14:2348. [Google Scholar]
- 19.Robles FE, Satterwhite LL, Wax A. Opt Lett. 2011;36:4665. doi: 10.1364/OL.36.004665. [DOI] [PMC free article] [PubMed] [Google Scholar]
- 20.Bjorklund GC, Levenson MD, Lenth W, Ortiz C. Appl Phys B. 1983;32:145. [Google Scholar]
- 21.Fischer MC, Liu HC, Piletic IR, Warren WS. Opt Express. 2008;16:4192. doi: 10.1364/oe.16.004192. [DOI] [PubMed] [Google Scholar]


