Abstract
Purpose
Tumor infiltrating CD4+CD25+FoxP3+ regulatory immune cells (Treg) have been associated with impaired anti- tumor immune response and unfavorable prognosis for patients affected by ovarian carcinoma, whereas CD8+ T-cells have been found to positively influence survival rates in a large panel of solid tumors. Recently, density, location and tumor infiltration patterns of the respective immune cell subtypes have been identified as key prognostic factors for different types of tumors.
Patients and Methods
We stained 210 human ovarian carcinoma samples immunhistochemically for FoxP3 and CD8 to identify the impact different immune cell patterns have on generally accepted prognostic variables as well as on overall survival.
Results
We found that FoxP3+ cells located within lymphoid aggregates surrounding the tumor were strongly associated with reduced survival time (P = 0.007). Central accumulation of CD8+ effector cells within the tumor bed shows a positive effect on survival (P = 0,001).
Conclusion
The distribution pattern of immune cells within the tumor environment strongly influences prognosis and overall survival time of patients with ovarian carcinoma.
Introduction
Ovarian cancer has the highest mortality rate of all female genital cancers. Over 200,000 women are diagnosed with primary ovarian cancer every year [1]–[4]. Most of these cancers are diagnosed at a late stage, over 75% of patients are staged FIGO III or IV at first appearance. Overall five-year survival rates range between devastating 25% and 49% [2], [5]–[8]. Standard therapy, cytoreductive surgery followed by platin and taxan chemotherapy, initially leads to good response rates; however, in over 50% of the cases the disease recurs within the following five years [9], [10]. Generally accepted prognostic factors are optimal surgical debulking, histological subtype, tumor grading and staging [2], [6]. Nonetheless, these factors fail to predict overall survival rates accurately, since patients with similar clinical and pathological characteristics often differ widely concerning actual outcome and survival.
The correlation between tumor-infiltrating lymphocytes and prognosis of cancer patients has been investigated by numerous papers throughout the past thirty years [11]–[13]. For ovarian carcinoma Zhang et al. demonstrated as early as 2003 that CD3+ lymphocytes influence the progression-free and overall survival rates of patients [9]. Studies have since aimed at identifying methods to further depict the different cells that are involved in the anti-tumor immune response. As a result, a subpopulation of T-regulatory cells (Treg Cells) has been identified that plays a crucial role in tumor-induced immune suppression [14], [15]. The vast majority of Tregs are characterized by expressing CD3, CD4, CD25, the glucocorticoid- induced tumor necrosis factor receptor family related gene (GITR), the cytotoxic T-lymphocyte antigen-4 (CTLA-4) and, most importantly, the transcription factor forkhead box P3 (FoxP3) [16]–[19].
Treg cells are able to modulate the anti- tumor response of CD8+ effector T-cells and are associated with poor prognosis in ovarian carcinoma [20]–[24]. Similar results have been reported of numerous other tumors, for example colon carcinoma [25] gastric cancer [26] metastatic melanoma [27]. Curiel at al. showed that human tumor Treg cells suppress tumor-specific T-cell immunity and contribute to tumor growth in vivo. Treg cells were associated with a high mortality risk and reduced survival for patients with ovarian carcinoma [15]. Other authors have focused on the influence other subsets of T- lymphocytes have on the tumor environment. High numbers of and intratumoral penetration by CD8+ effector T-cells were found to slow down tumor growth and have been identified as independent prognostic factors for serous ovarian carcinoma [22]. On a similar note, a high CD8+ effector T-cell-to-Treg cell ratio, rather than the absolute number of each, has been suggested as an independent predictor of survival for patients affected by ovarian carcinoma [14] as well as breast cancer [28].
Apart from the determination of the mere presence of a distinct cell type within the tumor environment, increasing evidence suggests that the exact location and tumor infiltration pattern need to be considered [23], [27], [29]. Other authors have claimed the lymphoid clusters surrounding the carcinomata to be the actual site of Treg cell activation. The accumulation of FoxP3+ cells within lymphoid cell clusters was associated with a significantly worse prognosis than samples with high numbers of Treg cells [30]–[32].
This study is based upon the assumption that FoxP3 is a valid Treg cell marker. However, there have been publications that have questioned this assumption in the past [33], [34]. There also have been several reports of FoxP3 expression through tumor cells themselves, which has been interpreted as a specific tumor escape mechanism [35]–[37]. Some evidence also suggests that FoxP3+ Treg cell subpopulations may also be involved in tumor suppressive functions [38], [39]. The interaction of FoxP3 and the transcription factor NFAT are subject to further investigation to ultimately understand FoxP3 function [40]. Moreover, other immune cells are known to be able to exert immunsuppresive mechanisms, but do not express FoxP3 [41], [42], [43]. However, the single legitimate Treg cell marker still remains to be discovered and for now FoxP3 remains to be the most established and understood Treg cell marker we know [17], [27], [44]–[47].
Material and Methods
Patient characteristics
210 tumor tissue samples were selected from the archives of the Institute of Pathology of the Ludwig-Maximilians University, Munich, Germany. All patients had undergone debulking surgery at the Department of Obstetrics and Gynecology, Maistrasse, University Clinic Munich, between 1989 and 2002. The patients were between 27 and 87 years of age at diagnosis, with a median age of 60.1. Tumors were graded according to the Silverberg grading system. Most tumors were graded class 3+4 (62.2%) and only very few class 1 (2.96%). Only samples classified as stage III cancers, according to the International Federation of Gynecology and Obstetrics (FIGO), were included. All histological types of epithelial ovarian carcinoma were selected, but the serous (77.1%), endometroid (8.1%) and adenocarcinoma NOS (5.3%) were by far the most commonly represented types (Table 1).
Table 1. Patient and tumor characteristics.
| n | |
| Number of Samples | 210 |
| Age (Mean/Range) | 60.77(27–87) |
| Survival Time (Median/Standard Deviation) | 48.28 (46,27) |
| Grading | Result (%) |
| G1 | 6 (2.96%) |
| G2 | 70 (34.48%) |
| G3+ G4 | 127 (62.56%) |
| Histological subtype | |
| Serous | 162 (77.1%) |
| Mucinous | 3 (1.4%) |
| Endometroid | 17 (8.1%) |
| Adenocarcinoma (NOS) | 11 (5.3%) |
| Undifferentiated | 7 (3.3%) |
| Unknown | 10 (4.8%) |
| Optimal Surgical Debulking | |
| Radical operation | 49 (23.3%) |
| Remaining tumor < = 2 cm | 68 (32.4%) |
| Remaining tumor >2 cm | 43 (20.5%) |
| Unknown | 47 (22.4%) |
| Sample laparotomy | 2 (1%) |
Histology and immunohistochemistry
The formalin-fixed, paraffin- bedded blocks were cut into approximately <2 µm thick slices and mounted on SuperFrost Plus microscope slides (Menzel Gläser, Braunschweig, Germany). After deparaffinization and rehydration, sections were immersed into Dako Target Retrieval solution (Dako North America Inc., Carpinteria, USA), pH 6, 1∶10, incubated at 97°C–99°C at 750 Watt for 2x 15 minutes, and allowed to cool to room temperature for 20 minutes. Endogenous peroxidase activity was blocked by 10-minute incubation in 7.5% hydrogen-peroxide solution (Hydroxen Peroxide Solution, Sigma Aldrich Co., Munich, Germany). Immunohistochemical staining for FoxP3 was performed according to standard procedure using MACH-3 mouse alkalic phosphatase polymer detection kit from Biocare Medical Systems (Concord, USA). The slides were incubated with monoclonal mouse antibody. Chromogen Red (Dako North Amerika Inc., Carpinteria, USA) was used as chromogen for FoxP3 staining, and lastly hematoxylin counterstaining was done (Vector Laboratories, Burlingam, USA). An independent set of slides was selected to perform immunhistochemical staining for CD8+ T-cells. These specimens were automatically stained using Ventana Benchmark XT according to standard operating procedure with monoclonal mouse antibody (Anti- Human CD8- AB-1 Antigen, Vision, Fremont, USA). Additional single serial staining was performed for CD4 and CD20 automatically using Ventana Benchmark XT with monoclonal mouse antibody according to the XT ultraView DAB procedure (Table 2).
Table 2. Antibodys used in this study.
| Antibody | Type | Dilution | IncubationTime | Source |
| Anti- Human FoxP3(Catalog Number ab20034) | Monoclonal; Mouse(Klon 236A/E7) | 1∶180 | 60 min | Biocare medical systems,Abcam, Cambridge, UK |
| Anti-Human CD8(Catalog Number MS 457) | Monoclonal; Mouse(Klon C8\144 B) | 1∶50 | 24 min | LAB Vision, Fremont, USA |
| Anti-Human CD20(Catalog Number M0755) | Monoclonal;Mouse (Klon L26) | 1∶400 | DAKO North America Inc.,Carpinteria, USA | |
| Anti-Human CD4(Catalog Number NCL-CD4-368) | Monoclonal;Mouse (Klon 4B12) | 1∶10 | Leica Biosystems,Nussloch, Germany |
Cells were first quantified by counting absolute numbers of 100 power fields per specimen (two independent investigators). After adequate group boundaries were defined, all remaining 110 specimens, as well as the initial 100 samples, were reevaluated semi-quantitatively. At least 35–40 high power fields were counted at 20- or 40-fold magnification (Axiovert Inverse Microscope, Carl Zeiss, Jena, Germany). The amount of cells was categorized according to a specific scoring system (Table 3).
Table 3. Scoring System.
| Group1 | Group2 | Group3 | Group4 | |
| CD8 | 0–4 | 5–14 | 15–24 | >25 |
| FoxP3 | 0–4 | 5–14 | 15–24 | >25 |
Preferred cell location (central vs peripheral) and finally, the infiltration of immune cells into the tumor tissue were checked (no infiltration vs. infiltration). Per definition, only cells surrounded by at least three tumor cells were counted as infiltrating the tumor.
Statistical analysis
Statistical analysis was done by Superior Performance Software Systems Statistics Software (SPSS). Correlations between clinicobiological data and the FoxP3+ and CD8+ cell content were determined using a χ2 test. Survival curves were plotted using the Kaplan-Meier method and compared using the log-rank test. Multivariate analyses of prognostic factors for survival were performed using a Cox Proportional Hazard Model.
Ethics Statement
Following the requirement of an ethics statement for publication of our manuscript in your journal, we would like to declare that the presented data were the result of a retrospective analysis on anonymized biopsy material. The material was sampled for diagnostic purposes. At all times we acted in accordance with the legal requirements concerning confidential medical communication as well as the data protection act. Consequently, we were sure before starting our investigation in 2009 that consulting the Institutional Review Board of out University was not required.
Results
a) Amount, Location, Infiltration of CD8+ and FoxP3+
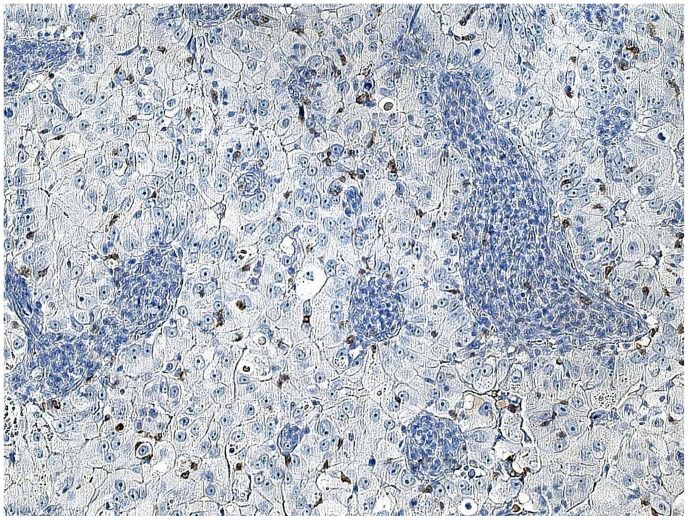
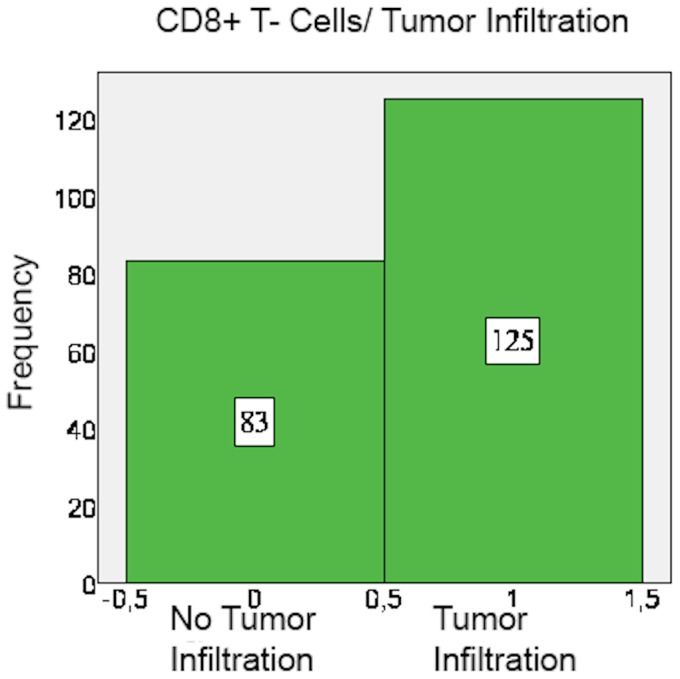
CD8+ and FoxP3+ cells were detected in nearly all specimens, with CD8+ and FoxP3+ staining exclusively found on lymphocytes (Table 4). The amount of CD8+ cells mostly varied between 5 and 25 cells per field. In 53.8% of the examined specimens, CD8+ cells mainly accumulated in the peripheral stroma surrounding the tumor tissue and in 46.2% they spread equally throughout the tissue (Figure 1). A mere 60.1% of cases showed tumor-infiltrating CD8+ cells (Figures 2 and 3).
Table 4. Amount of cells.
| Group1 | Group2 | Group3 | Group4 | Missing | |
| CD8 | 54 (25.7%) | 78 (37.1%) | 68 (32.4%) | 8 (3.8%) | 2 (1%) |
| FoxP3 | 65 (31.0%) | 50 (23.8%) | 59 (28.1%) | 27 (12.9%) | 9 (4.3%) |
Figure 1. CD8+ T-cells: Location.
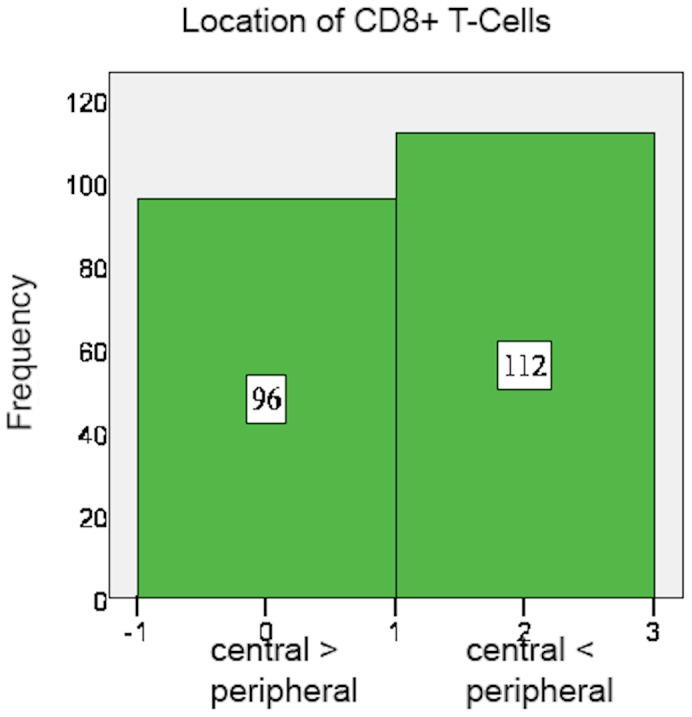
Figure 2. CD8+ T-cells infiltrating tumor tissue.
Microscope: Carl Zeiss, Jena, Germany, 20-fold magnification, room temperature, Adobe Photoshop.
Figure 3. CD8+ T-cells: Tumor infiltration pattern.
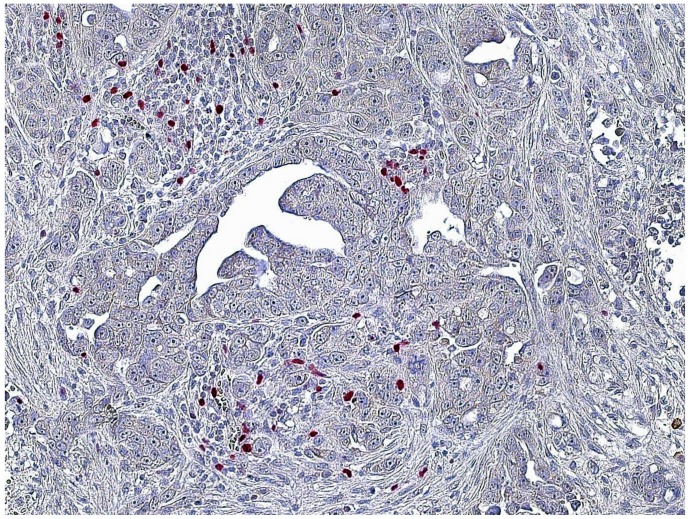
FoxP3+ cell count mainly ranged between 5 and 25 cells per field as well, but overall more FoxP3+ than CD8+ cells were counted in the specimens. Moreover, FoxP3+ cells accumulated relatively more often within the centre of the specimen than in the peripheral stroma (63.3%) (Figures 4 and 5). FoxP3+ cells usually infiltrated the tumor tissue (94.4% positive tumor infiltration) (Figure 6) (Tables 5 and 6).
Figure 4. FoxP3+ cells mainly accumulate centrally.
Carl Zeiss, Jena, Germany, 20-fold magnification, room temperature, Adobe Photoshop.
Figure 5. FoxP3+ cells: Location.
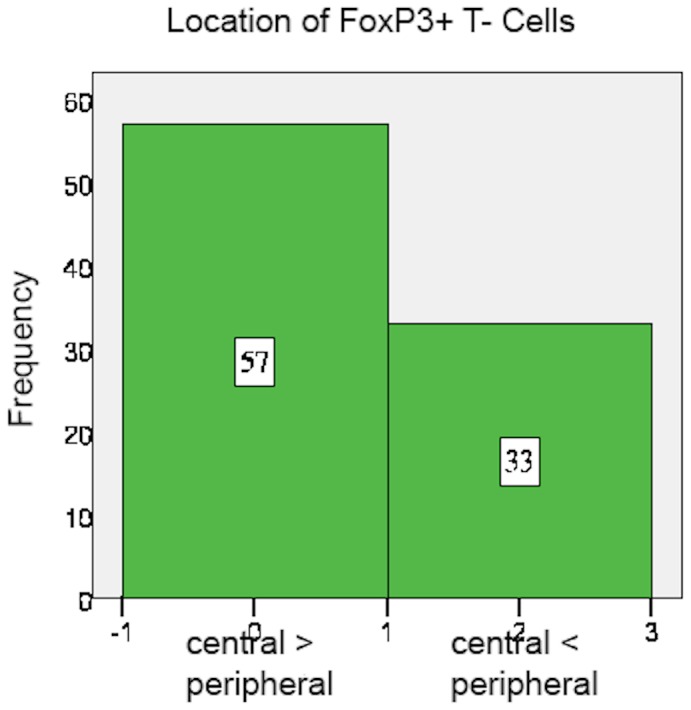
Figure 6. FoxP3+ cells: Tumor infiltration pattern.
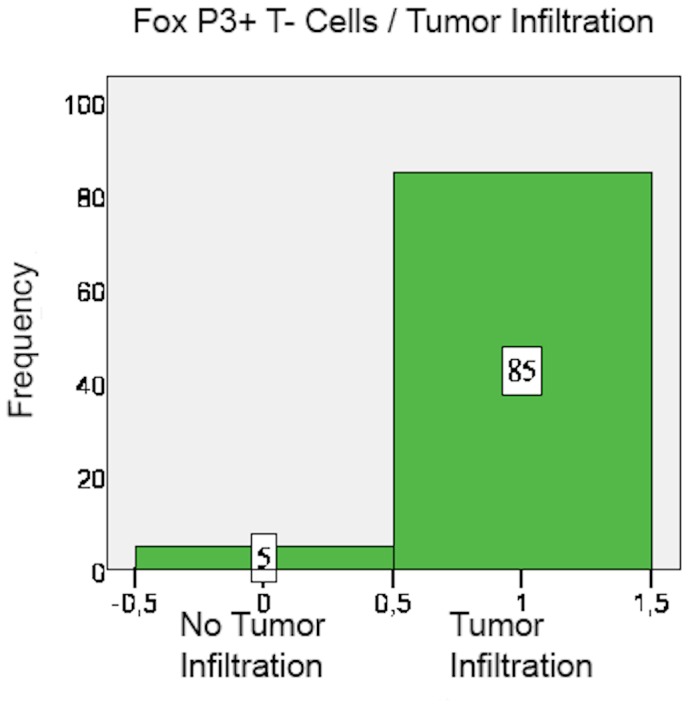
Table 5. Localisation of cells.
| Central> = Peripheral | Central<Peripheral | Missing | |
| CD8 | 96 (45.7%) | 112 (53.3%) | 2 (1%) |
| FoxP3 | 57 (27.1%) | 33 (15.7%) | 120 (57.1%) |
Table 6. Tumor infiltration of cells.
| Tumor not Infiltrated | Tumor infiltrated | Missing | |
| CD8 | 83 (39.9%) | 125 (59.5%) | 2 (1%) |
| FoxP3 | 5 (2.4%) | 85 (40.5%) | 120 (57.1%) |
b) Correlation analysis
The amount of CD8+ cells within the specimen strongly correlates with the amount of FoxP3+ cells (p = 0.0001). Also, high numbers of CD8+ T-cells are positively linked to tumor infiltration of CD8+ cells (p = 0.001).
Increased numbers of FoxP3+ cells are associated with tumor infiltration of FoxP3+ cells, thus implying a benchmark number of Treg cells necessary for invasion into the tumor tissue (p = 0.001). Moreover, the ratio of CD8+T-cells to FoxP3+ cells strongly correlates with FoxP3+ cell location: a high CD8-to-FoxP3 ratio is associated with peripheral location of FoxP3+ cells. They mainly accumulate in lymphoid clusters surrounding the tumor. A low CD8+ to-FoxP3+ ratio, however, is associated with tumor infiltration of FoxP3+ cells. As soon as FoxP3+ cells outweigh CD8+ cells, they will infiltrate into the tumor and spread throughout the specimen.
The correlation tables reveal a significant relationship between “grading” level and FoxP3+ cell density, implying that high levels of FoxP3+ Treg cells are associated with significantly worse grading according to the Silverberg grading classification scheme (p = 0.004). This relationship is further emphasized by the negative correlation found between the CD8-to-FoxP3+ cell ratio and grading. Relatively low levels of CD8+ effector cells in comparison to FoxP3+ Treg cells are significantly associated with lower histological tumor grading (p = 0.001). Surprisingly, the parameter of “location of FoxP3+ cells” individually influences survival time (p = 0.007). Peripheral accumulation of Treg cells in lymphoid clusters surrounding the tumor bed is consequently associated with significantly less overall survival time than central accumulation within the tumor bed.
In order to quantify the influence generally accepted prognostic factors have on the prognostic model, statistical analysis was also done for common prognostic variables. “Age” (p = 0.001), “grading” (p = 0.001) and “optimal surgical debulking” (p = 0.007) showed significant effects on survival time, while neither the “employed neo-adjuvant therapy” nor “histological subtype” did. The lack of influence the parameter “histological subtype” shows is probably due to the lack of homogeneity of histological subtypes within the population.
c) Cox Proportional Hazard Model
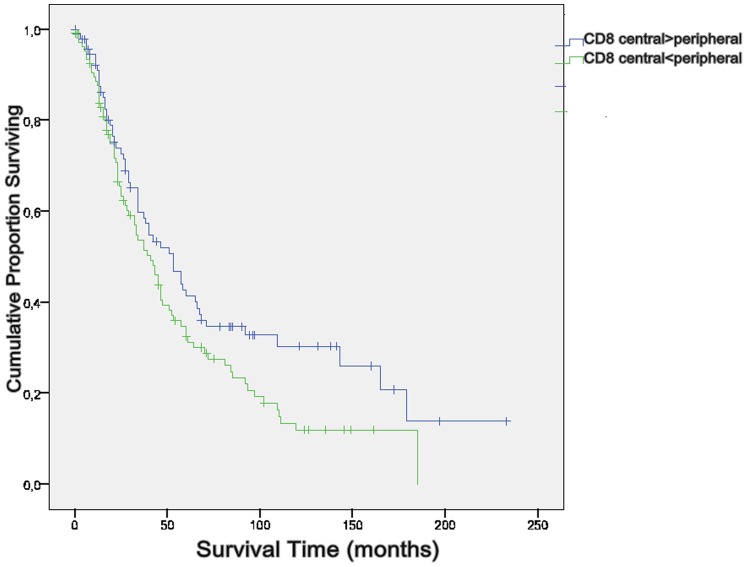
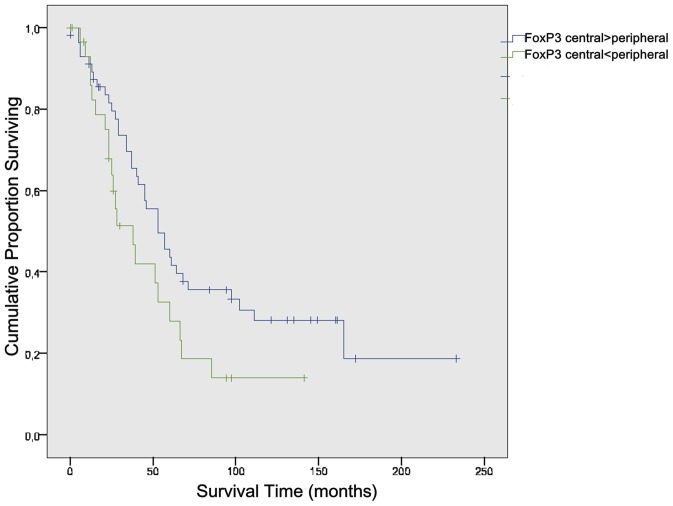
Using the Cox Proportional Hazard Model eliminated the statistical effects of the prognostic factors age, grading and surgical debulking. Three major individual prognostic factors for patients with ovarian carcinoma were then revealed. Firstly, the location of CD8+ T-cells within the specimen is an individual prognostic factor for patients with ovarian carcinoma (p = 0.001). Centralized accumulation of CD8+ effector cells in the tumor bed leads to prolonged survival time. Secondly, peripheral accumulation of FoxP3+ Treg cells in lymphoid clusters is a strongly significant negative prognostic factor for patients suffering from ovarian carcinoma (Table 7).
Table 7. Biomarkers and their influence on overall survival.
| Biomarkers | No. Positive (%) | Overall survival (P) | Morphological pattern |
| CD8+ cells | |||
| central | 46.2 | 0.049 | Central Location of CD8+ cells increases survival |
| peripheral | 53.8 | NS | |
| FoxP3+ cells | |||
| central | 63.3 | NS | Peripheral Location of FoxP3+ cells reduces survival |
| peripheral | 36.7 | 0.056 | |
NS: Not significant.
d) Kaplan-Meier Curves and Log-Rank Test
The significant influence the location of CD8+ T effector cells as well as the location of FoxP3+ Treg cells within the specimen have on the overall survival time of a patient was reinforced by using the Kaplan-Meier Model (p = 0.049 and p = 0.056) (Figures 7 and 8).
Figure 7. Log-Rank-Test CD8+.
Central accumulation of CD8+ T cells is significally associated with survival (p = 0.049).
Figure 8. Log-Rank-Test FoxP3+.
Peripheral accumulation of FoxP3+ Cells leads to reduced survival (p = 0.056).
Discussion
This study examined the tissue of 210 patients with ovarian carcinoma for the infiltration of CD8+ effector T-cells and FoxP3+ T regulatory cells (Treg). In addition to the calculation of the respective frequencies, special attention was paid to the exact locations of the immune cells and to their capacity to infiltrate into the tumor bed. In order to adjust for known prognostic factors, multivariate analysis was done using the Cox Proportional Hazards Model introducing classical histophathological parameters such as grading, age at diagnosis, and surgical debulking success.
The current paradigm in tumor immunity suggests that tumor-associated antigens are captured by professional dendritic cells, which in turn prime naive T-cells to become antigen-specific anti tumor effector T-cells [48]. Ultimately, a large number of activated CD8+ effector T-cells should thus be able to attack the tumor tissue and eradicate the tumor. Unfortunately, as tumors actively fight to suppress effector cell function by producing immunosuppressive factors such as IL-10, TGFß, and VEGF, effective tumor eradication is rarely successful [49]–[52]. Moreover, the immunosuppressive function Treg cells exert on CD4+ and CD8+ T-cells have been identified as a crucial variable limiting an effective anti- tumor immune response. Yet, the mechanisms of suppression Treg cells make use of still remain to be fully understood.
The results of our study signify that the invasion of great numbers of CD8+ T effector cells is in fact one of the major prognostic factors for patients with ovarian carcinoma. This has previously been suggested for ovarian carcinoma as well as breast cancer by numerous authors [10], [14], [28], [53], but the focus of attention has so far not been placed on the location of the cells within the examined material, but on the mere amount of CD8+ T-cells and the ratio of CD8+ to other immune cells, respectively. The location, however, seems to be of greatest importance for an effective tumor attack. High numbers of CD8+ effector cells are also strongly associated with lower levels of histopathological grading, which strengthens the case that sufficient numbers of CD8+ T-cells within the tumor bed are actually able to keep tumor growth in check.
FoxP3+ Treg cells were mainly present within the tumor area, but less frequently they gathered in groups surrounding the tumor. In order to determine what cell types comprise these aggregates of immune cells we performed additional single serial staining for CD4 and CD20. We thereby could identify these peripheral immune cell aggregates as lymphoid structures. FoxP3+ expression in these lymphoid aggregates surrounding the tumor bed was found to be an independent prognostic factor for patients with ovarian carcinoma. Therefore, the presence of Treg cells within these lymphoid infiltrates is associated with a significantly higher risk of relapse and death. This finding has previously been reported for patients with breast carcinoma [31] as well as for follicular lymphoma [30]. Supposedly, this clinical observation results from the selective activation of Treg cells within these aggregates surrounding the tumor bed. Here, mature dendritic cells present tumor-specific antigens to peripheral naive FoxP3+ Treg cells, which then proliferate in situ and are thereafter capable of suppressing the anti tumor immune response of CD8+ effector T-cells through heterogeneous mechanisms including IL-10 and TGF-ß [32], [48], [51], [54]. This thesis was further strengthened by Gobert's finding that only Treg cells located in these lymphoid aggregates actually expressed activation markers such as HCA-DR, GITR and ICOS, while FoxP3+Treg cells located within the tumor tissue itself did not [31]. Previously, other authors have reported the expression of B7-H1 by dendritic cells within these aggregates, a receptor by which dendritic cells are able to prime the conversion of peripheral T-cells to functional Treg cells [48]. The accumulation of FoxP3+Treg cells within lymphocyte clusters surrounding the tumor, as well as abundant B7-H1 expression within this region, have lately also been reported for patients with prostate cancer [29]. Thus, it seems to be crucial not only to determine the density of FoxP3+ cells, but their exact location in the examined tissue. In order to influence the tumor microenvironment, the B7-H1 receptor seems to be one key mechanism which controls Treg cell activation.
On a different note but in accordance with the findings of this study, Jaffee et al. revealed that CD8+FoxP3+ cells are present in tumors only if there is an existing pool of tumor-rejecting effector CD8+ T-cells. Therefore, the accumulation and likely the tumor infiltration of FoxP3+ T-cells mark the presence of tumor-rejecting antigen-specific CD8+ T cells, which in turn serves as a marker for an effective T-cell response [55]. Similar results were presented by Nishikawa et al. as well as Rahir et al. [56], [57]. Overall, recent data is suggesting that a unique effector subset of FoxP3+ cells may exist which influences the tumor microenvironment in a favorable way and contributes to overall antitumor response. Given the multifaceted influence Tregs play in cancer progression, further research is urgently needed to develop targeted therapies.
Acknowledgments
We thank Andrea Sendelhofert and Anja Heier for expert technical assistance.
Data Availability
The authors confirm that all data underlying the findings are fully available without restriction. All relevant data are within the Supporting Information files.
Funding Statement
The authors have no funding or support to report.
References
- 1.WHO WHO (2009) World Health Observatory. Geneva: World Health Organization.
- 2.Fachgesellschaften AdWM (2007) Diagnostik und Therapie maligner Ovarialtumoren. AWMF.
- 3.Tavassoli FA, Devilee P, editors (2004) Pathology& Genetics: Tumours of the Breast and Female Genital Organs: World Health Organization Classification of Tumours.
- 4.Koch-Institut R (2010) Verbreitung von Krebserkrankungen in Deutschland. Entwicklung der Prävalenzen zwischen 1990 und 2010. Beiträge zur Gesundheitsberichterstattung des Bundes. Berlin: Robert Koch Institut.
- 5. Woodward ER, Sleightholme HV, Considine AM, Williamson S, McHugo JM, et al. (2007) Annual surveillance by CA125 and transvaginal ultrasound for ovarian cancer in both high-risk and population risk women is ineffective. Bjog-an International Journal of Obstetrics and Gynaecology 114: 1500–1509. [DOI] [PubMed] [Google Scholar]
- 6.DeutscheKrebsgesellschaft (2006) Interdisziplinäre S2k- Leitlinie für die Diagnostik und Therapie maligner Ovarialtumore. München: W. Zuckschwerdt Verlag. pp. 76.
- 7.Schmalfeldt B, editor (2007) Manual maligne Ovarialtumore. München: Tumorzentrum München und W. Zuckschwerdt Verlag München. 124 p. [Google Scholar]
- 8. Jacobs I, Davies AP, Bridges J, Stabile I, Fay T, et al. (1993) Prevalence Screening for Ovarian-Cancer in Postmenopausal Women by Ca 125 Measurement and Ultrasonography. British Medical Journal 306: 1030–1034. [DOI] [PMC free article] [PubMed] [Google Scholar]
- 9. Zhang L, Conejo-Garcia JR, Katsaros D, Gimotty PA, Massobrio M, et al. (2003) Intratumoral T cells, recurrence, and survival in epithelial ovarian cancer. New England Journal of Medicine 348: 203–213. [DOI] [PubMed] [Google Scholar]
- 10. Milne K, Kobel M, Kalloger SE, Barnes RO, Gao D, et al. (2009) Systematic analysis of immune infiltrates in high-grade serous ovarian cancer reveals CD20, FoxP3 and TIA-1 as positive prognostic factors. PLoS One 4: e6412. [DOI] [PMC free article] [PubMed] [Google Scholar]
- 11. North RJ, Bursuker I (1984) Generation and decay of the immune response to a progressive fibrosarcoma. I. Ly-1+2- suppressor T cells down-regulate the generation of Ly-1-2+ effector T cells. J Exp Med 159: 1295–1311. [DOI] [PMC free article] [PubMed] [Google Scholar]
- 12. Awwad M, North RJ (1988) Immunologically mediated regression of a murine lymphoma after treatment with anti-L3T4 antibody. A consequence of removing L3T4+ suppressor T cells from a host generating predominantly Lyt-2+ T cell-mediated immunity. J Exp Med 168: 2193–2206. [DOI] [PMC free article] [PubMed] [Google Scholar]
- 13. Ropponen KM, Eskelinen MJ, Lipponen PK, Alhava E, Kosma VM (1997) Prognostic value of tumour-infiltrating lymphocytes (TILs) in colorectal cancer. J Pathol 182: 318–324. [DOI] [PubMed] [Google Scholar]
- 14. Sato E, Olson SH, Ahn J, Bundy B, Nishikawa H, et al. (2005) Intraepithelial CD8(+) tumor-infiltrating lymphocytes and a high CD8(+)/regulatory T cell ratio are associated with favorable prognosis in ovarian cancer. Proceedings of the National Academy of Sciences of the United States of America 102: 18538–18543. [DOI] [PMC free article] [PubMed] [Google Scholar]
- 15. Curiel TJ, Coukos G, Zou LH, Alvarez X, Cheng P, et al. (2004) Specific recruitment of regulatory T cells in ovarian carcinoma fosters immune privilege and predicts reduced survival. Nature Medicine 10: 942–949. [DOI] [PubMed] [Google Scholar]
- 16. Sakaguchi S, Sakaguchi N, Asano M, Itoh M, Toda M (1995) immunological self-tolerance maintained by activated t-cells expressing il-2 receptor alpha-chains (cd25) - breakdown of a single mechanism of self-tolerance causes various autoimmune-diseases. Journal of Immunology 155: 1151–1164. [PubMed] [Google Scholar]
- 17. Fontenot JD, Gavin MA, Rudensky AY (2003) Foxp3 programs the development and function of CD4(+)CD25(+) regulatory T cells. Nature Immunology 4: 330–336. [DOI] [PubMed] [Google Scholar]
- 18. Hori S, Nomura T, Sakaguchi S (2003) Control of regulatory T cell development by the transcription factor Foxp3. Science 299: 1057–1061. [DOI] [PubMed] [Google Scholar]
- 19. Shimizu Y, Kamoi S, Amada S, Hasumi K, Akiyama F, et al. (1998) Toward the development of a universal grading system for ovarian epithelial carcinoma - I. Prognostic significance of histopathologic features - Problems involved in the architectural grading system. Gynecologic Oncology 70: 2–12. [DOI] [PubMed] [Google Scholar]
- 20. Wang L, Ma Q, Chen X, Guo K, Li J, et al. (2010) Clinical significance of b7-h1 and b7-1 expressions in pancreatic carcinoma. World J Surg 34: 1059–1065. [DOI] [PubMed] [Google Scholar]
- 21. Oleinika K, Nibbs RJ, Graham GJ, Fraser AR (2013) Suppression, subversion and escape: the role of regulatory T cells in cancer progression. Clinical and Experimental Immunology 171: 36–45. [DOI] [PMC free article] [PubMed] [Google Scholar]
- 22. Clarke SL, Betts GJ, Plant A, Wright KL, El-Shanawany TM, et al. (2006) CD4+CD25+FOXP3+ regulatory T cells suppress anti-tumor immune responses in patients with colorectal cancer. PLoS One 1: e129. [DOI] [PMC free article] [PubMed] [Google Scholar]
- 23. Galon J, Costes A, Sanchez-Cabo F, Kirilovsky A, Mlecnik B, et al. (2006) Type, density, and location of immune cells within human colorectal tumors predict clinical outcome. Science 313: 1960–1964. [DOI] [PubMed] [Google Scholar]
- 24. Facciabene A, Motz GT, Coukos G (2012) T-Regulatory Cells: Key Players in Tumor Immune Escape and Angiogenesis. Cancer Research 72: 2162–2171. [DOI] [PMC free article] [PubMed] [Google Scholar]
- 25. Chaput N, Louafi S, Bardier A, Charlotte F, Vaillant JC, et al. (2009) Identification of CD8(+)CD25(+)Foxp3(+) suppressive T cells in colorectal cancer tissue. Gut 58: 520–529. [DOI] [PubMed] [Google Scholar]
- 26. Mizukami Y, Kono K, Kawaguchi Y, Akaike H, Kamimura K, et al. (2008) CCL17 and CCL22 chemokines within tumor microenvironment are related to accumulation of Foxp3(+) regulatory T cells in gastric cancer. International Journal of Cancer 122: 2286–2293. [DOI] [PubMed] [Google Scholar]
- 27. Ahmadzadeh M, Felipe-Silva A, Heemskerk B, Powell DJ, Wunderlich JR, et al. (2008) FOXP3 expression accurately defines the population of intratumoral regulatory T cells that selectively accumulate in metastatic melanoma lesions. Blood 112: 4953–4960. [DOI] [PMC free article] [PubMed] [Google Scholar]
- 28. Anz D, Koelzer VH, Moder S, Thaler R, Schwerd T, et al. (2010) Immunostimulatory RNA Blocks Suppression by Regulatory T Cells. Journal of Immunology 184: 939–946. [DOI] [PubMed] [Google Scholar]
- 29. Ebelt K, Babaryka G, Frankenberger B, Stief CG, Eisenmenger W, et al. (2009) Prostate cancer lesions are surrounded by FOXP3(+), PD-1(+) and B7-H1(+) lymphocyte clusters. European Journal of Cancer 45: 1664–1672. [DOI] [PubMed] [Google Scholar]
- 30. Farinha P, Al-Tourah A, Gill K, Klasa R, Connors JM, et al. (2010) The architectural pattern of FOXP3-positive T cells in follicular lymphoma is an independent predictor of survival and histologic transformation. Blood 115: 289–295. [DOI] [PubMed] [Google Scholar]
- 31. Gobert M, Treilleux I, Bendriss-Vermare N, Bachelot T, Goddard-Leon S, et al. (2009) Regulatory T Cells Recruited through CCL22/CCR4 Are Selectively Activated in Lymphoid Infiltrates Surrounding Primary Breast Tumors and Lead to an Adverse Clinical Outcome. Cancer Research 69: 2000–2009. [DOI] [PubMed] [Google Scholar]
- 32. Menetrier-Caux C, Gobert M, Caux C (2009) Differences in Tumor Regulatory T-Cell Localization and Activation Status Impact Patient Outcome. Cancer Research 69: 7895–7898. [DOI] [PubMed] [Google Scholar]
- 33. Beyer M, Schultze JL (2006) Regulatory T cells in cancer. Blood 108: 804–811. [DOI] [PubMed] [Google Scholar]
- 34. Wing K, Sakaguchi S (2010) Regulatory T cells exert checks and balances on self tolerance and autoimmunity. Nature Immunology 11: 7–13. [DOI] [PubMed] [Google Scholar]
- 35. Hinz S, Pagerols-Raluy L, Oberg H-H, Ammerpohl O, Grussel S, et al. (2007) Foxp3 expression in pancreatic carcinoma cells as a novel mechanism of immune evasion in cancer. Cancer Res 67: 8344–8350. [DOI] [PubMed] [Google Scholar]
- 36. Ebert LM, Tan BS, Browning J, Svobodova S, Russell SE, et al. (2008) The regulatory T cell-associated transcription factor FoxP3 is expressed by tumor cells. Cancer Res 68: 3001–3009. [DOI] [PubMed] [Google Scholar]
- 37. Karanikas V, Speletas M, Zamanakou M, Kalala F, Loules G, et al. (2008) Foxp3 expression in human cancer cells. J Transl Med 6: 19. [DOI] [PMC free article] [PubMed] [Google Scholar]
- 38. Zhang H-Y, Sun H (2010) Up-regulation of Foxp3 inhibits cell proliferation, migration and invasion in epithelial ovarian cancer. Cancer Letters 287: 91–97. [DOI] [PubMed] [Google Scholar]
- 39. Zuo T, Wang L, Morrison C, Chang X, Zhang H, et al. (2007) FOXP3 is an X-linked breast cancer suppressor gene and an important repressor of the HER-2/ErbB2 oncogene. Cell 129: 1275–1286. [DOI] [PMC free article] [PubMed] [Google Scholar]
- 40. Wu YQ, Borde M, Heissmeyer V, Feuerer M, Lapan AD, et al. (2006) FOXP3 controls regulatory T cell function through cooperation with NFAT. Cell 126: 375–387. [DOI] [PubMed] [Google Scholar]
- 41. Shevach EM (2006) From vanilla to 28 flavors: Multiple varieties of T regulatory cells. Immunity 25: 195–201. [DOI] [PubMed] [Google Scholar]
- 42. Sakaguchi S (2008) Regulatory T cells in the past and for the future. European Journal of Immunology 38: 901–903. [DOI] [PubMed] [Google Scholar]
- 43. Kryczek I, Zou L, Rodriguez P, Zhu G, Wei S, et al. (2006) B7-H4 expression identifies a novel suppressive macrophage population in human ovarian carcinoma. Journal of Experimental Medicine 203: 871–881. [DOI] [PMC free article] [PubMed] [Google Scholar]
- 44. Clarke B, Tinker AV, Lee C-H, Subramanian S, van de Rijn M, et al. (2009) Intraepithelial T cells and prognosis in ovarian carcinoma: novel associations with stage, tumor type, and BRCA1 loss. Modern Pathology 22: 393–402. [DOI] [PubMed] [Google Scholar]
- 45. Feyler S, von Lilienfeld-Toal M, Jarmin S, Marles L, Rawstron A, et al. (2009) CD4(+)CD25(+)FoxP3(+) regulatory T cells are increased whilst CD3(+)CD4(−)CD8(−)alpha beta TCR+ Double Negative T cells are decreased in the peripheral blood of patients with multiple myeloma which correlates with disease burden. British Journal of Haematology 144: 686–695. [DOI] [PubMed] [Google Scholar]
- 46. Chen WJ, Jin WW, Hardegen N, Lei KJ, Li L, et al. (2003) Conversion of peripheral CD4(+)CD25(−) naive T cells to CD4(+)CD25(+) regulatory T cells by TGF-beta induction of transcription factor Foxp3. Journal of Experimental Medicine 198: 1875–1886. [DOI] [PMC free article] [PubMed] [Google Scholar]
- 47.Kmieciak M, Gowda M, Graham L, Godder K, Bear HD, et al.. (2009) Human T cells express CD25 and Foxp3 upon activation and exhibit effector/memory phenotypes without any regulatory/suppressor function. Journal of Translational Medicine 7. [DOI] [PMC free article] [PubMed]
- 48. Curiel TJ (2007) Tregs and rethinking cancer immunotherapy. Journal of Clinical Investigation 117: 1167–1174. [DOI] [PMC free article] [PubMed] [Google Scholar]
- 49. Dunn GP, Bruce AT, Ikeda H, Old LJ, Schreiber RD (2002) Cancer immunoediting: from immunosurveillance to tumor escape. Nat Immunol 3: 991–998. [DOI] [PubMed] [Google Scholar]
- 50. Dunn GP, Ikeda H, Bruce AT, Koebel C, Uppaluri R, et al. (2005) Interferon-gamma and cancer immunoediting. Immunol Res 32: 231–245. [DOI] [PubMed] [Google Scholar]
- 51. Larmonier N, Marron M, Zeng Y, Cantrell J, Romanoski A, et al. (2007) Tumor-derived CD4(+)CD25(+) regulatory T cell suppression of dendritic cell function involves TGF-beta and IL-10. Cancer Immunol Immunother 56: 48–59. [DOI] [PMC free article] [PubMed] [Google Scholar]
- 52. Liu VC, Wong LY, Jang T, Shah AH, Park I, et al. (2007) Tumor evasion of the immune system by converting CD4(+) CD25(−) T cells into CD4(+) CD25(+) T regulatory cells: Role of tumor-derived TGF-beta. Journal of Immunology 178: 2883–2892. [DOI] [PubMed] [Google Scholar]
- 53. Clarke B, Tinker AV, Lee CH, Subramanian S, van de Rijn M, et al. (2009) Intraepithelial T cells and prognosis in ovarian carcinoma: novel associations with stage, tumor type, and BRCA1 loss. Modern Pathology 22: 393–402. [DOI] [PubMed] [Google Scholar]
- 54. Zou WP (2005) Immunosuppressive networks in the tumour environment and their therapeutic relevance. Nature Reviews Cancer 5: 263–274. [DOI] [PubMed] [Google Scholar]
- 55. Le DT, Ladle BH, Lee T, Weiss V, Yao XS, et al. (2011) CD8(+)Foxp3(+) tumor infiltrating lymphocytes accumulate in the context of an effective anti-tumor response. International Journal of Cancer 129: 636–647. [DOI] [PMC free article] [PubMed] [Google Scholar]
- 56. Nishikawa H, Sakaguchi S (2010) Regulatory T cells in tumor immunity. International Journal of Cancer 127: 759–767. [DOI] [PubMed] [Google Scholar]
- 57. Rahir G, Moser M (2012) Tumor microenvironment and lymphocyte infiltration. Cancer Immunology Immunotherapy 61: 751–759. [DOI] [PMC free article] [PubMed] [Google Scholar]
Associated Data
This section collects any data citations, data availability statements, or supplementary materials included in this article.
Data Availability Statement
The authors confirm that all data underlying the findings are fully available without restriction. All relevant data are within the Supporting Information files.


