The authors of Li-Yu D. Liu, Li-Yun Chang, Wen-Hung Kuo et al. Prognostic features of signal transducer and activator of transcription 3 in an ER(+) breast cancer model system. Cancer Informatics. 2014;13:21–45. doi: 10.4137/CIN.S12493. recently brought to the attention of the Editor in Chief, Dr. J. T. Efird, corrections they wished to make to the paper. The Editor in Chief reviewed these with reference to applicable Committee on Publication Ethics guidelines and determined that publication of a separate corrigendum was an appropriate response to the authors’ request. The authors’ full statement is given hereafter.
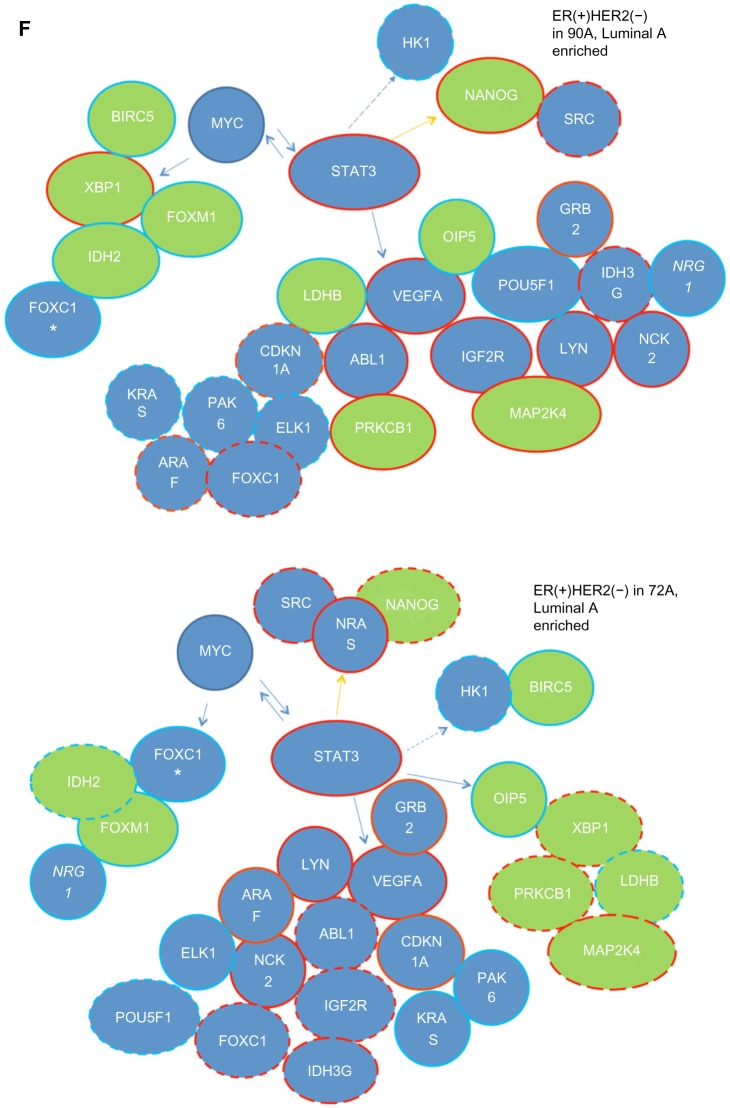
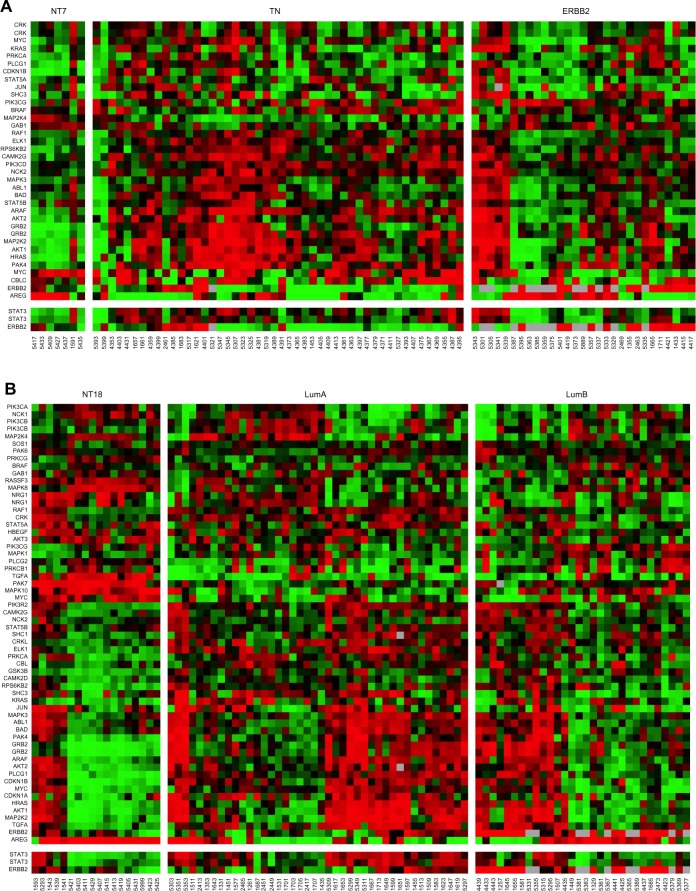
We, as the authors of the paper “Prognostic features of signal transducer and activator of transcription 3 in an ER (+) breast cancer model system”, published in Cancer Informatics 2014:13 21–45, wish to correct Figures 3F, 7A, 7B, S6.2–6.3, S7.1–7.5 and Tables 2, 3.
Figure 3F.
Figure 7A,B.
Table 2.
| GENE SYMBOL (FEATURE NO.) | INCREASED EXPRESSION LEVEL | P VALUE | PATHWAYS |
|---|---|---|---|
| ABL1 (8019) | poor prognosis | 0.046 | ERBB2, PDGFRB, cell cycle and angiogenesis |
| IGF2R (1723) | poor prognosis | 0.048 | angiogenesis |
| PRKCB1 (6676) | good prognosis | 0.033 | ERBB2 and VEGF |
| MAP2 K4 (18964) | good prognosis | 0.034 | ERBB2 |
| NRG1 (11559) | good prognosis | 0.011 | ERBB2 |
| LYN (19236) | poor prognosis | 0.001 | PDGFRB and angiogenesis |
| STAT3 (4386) | poor prognosis | 0.028 | PDGFRB and angiogenesis |
| STAT3 (15013) | poor prognosis | 0.002 | PDGFRB and angiogenesis |
| VEGFA (1135) | poor prognosis | 0.02 | VEGF and angiogenesis |
| VEGFA (15367) | poor prognosis | 0.008 | VEGF and angiogenesis |
| OIP5 (16433) | poor prognosis | 0.013 | FOXC1 network |
| NCK2 (3851) | poor prognosis | 0.029 | ERBB2 and PDGFRB |
| LDHB (20259) | poor prognosis | 0.038 | Warburg effect |
| GRB2 (16731) | poor prognosis | 0.019 | ERBB2 and PDGFRB |
| *NANOG (C12928.2) | good prognosis | 0.024 | EMT |
| POU5F1 (6057) | good prognosis | 0.02 | EMT |
| GRB2 (1952) | poor prognosis | 0.03 | ERBB2 and PDGFRB |
Table 3.
| GENE SYMBOL | REGULATION STATUS | BIOCHEMICAL PATHWAY | PROGNOSIS | REGULATORS |
|---|---|---|---|---|
| GRB2 | up | ERBB2 and PDGFRB | poor | MYC and STAT3 |
| CDKN1A | up | p53, cell cycle and ERBB2 | poor | MYC and STAT3 |
| ARAF | up | ERBB2 | poor | MYC and STAT3 |
| NCK2 | up | ERBB2 and PDGFRB | poor | MYC and STAT3 |
| PAK6 | up | ERBB2 | good | MYC and STAT3 |
| KRAS | up | ERBB2 and VEGF | good | MYC and STAT3 |
| STAT3 | up | PDGFRB and angiogenesis | poor | MYC and STAT3 |
| ELK1 | up | FOXC1 network and ERBB2 | good | MYC and STAT3 |
| OIP5 | down | FOXC1 network | good | MYC and STAT3 |
| *NRAS | up | ERBB2 | poor | STAT3 |
| LYN | up | PDGFRB and angiogenesis | poor | MYC and STAT3 |
| VEGFA | up | angiogenesis | poor | MYC and STAT3 |
We made unexpected mistakes during generating genome-wide data of 90th percentile Kaplan-Meier survival analysis on the gene of interest using R package. We have generated multiple sets of survival curves beginning with the earlier publications. To the best of our knowledge, all of them are correct except for 72 A cohort and a few data in 90 A cohort in this paper. The new Figure 3F, Tables 2–3 and Figures S6.2–6.3 have the corrected data, marked in red in Tables 2–3.
Additionally, we have made new Figures 7A and B to replace the old ones to be consistent with the original text.
In some instances, the text of the article also reflects errors in the data, and is hereby corrected as follows:
Page 23, right column.
This sentence from the original article:
Kaplan-Meier survival analyses21 were done using the “survival” package in R (version 2.15.1) for the gene profiles of 90 A cohort, 91 A cohort, 181 A cohort or the extracted gene pools of interest in the assigned cohorts.
is corrected to read as follows:
Kaplan-Meier survival analyses21 were done using the “survival” package in R (version 2.15.1) for the gene profiles of 90 A cohort, 72 A cohort, 181 A cohort or the extracted gene pools of interest in the assigned cohorts.
Page 30, legends of tables 2 and 3
To be consistent with new Figure 3F, the legend of Table 2 from the original article:
Table 2. The prognostic values for inferred target genes of STAT3 and MYC in the 90 A cohort.
is corrected to read as follows:
Table 2. The prognostic values for inferred target genes of STAT3 and MYC or of *STAT3 in the 90 A cohort (Fig. 3F).
To be consistent with new Figure 3F, the legend of Table 3 from the original article:
Table 3. The prognostic values for inferred target genes of STAT3 and MYC in the 72 A cohort.
is corrected to read as follows:
Table 3. The prognostic values for inferred target genes of STAT3 and MYC or of *STAT3 in the 72 A cohort (Fig. 3F).
Page 31, right column.
This sentence from the original article:
High levels of IDH3G are a favorable prognosis predictor in 72 A cohort (Table 3).
should be regarded as deleted.
Page 35, left column
This sentence from the original article:
Surprisingly, STAT3 regulates 59% (60/101) of ERBB2 signaling molecules in the 90 A cohort.
is corrected to read as follows:
Surprisingly, STAT3 regulates 59% (60/101) of ERBB2 signaling molecules in the 90 A cohort (Table S4.12).
This sentence from the original article:
The expression patterns of these signaling molecules shown in heatmaps (Fig. 7B) indicate that STAT3 mediated regulation of these 6 signaling molecules (PRKCB1, MAP2K4, NRG1, NCK2, ABL1 and GRB2) provides a good prognostic indicator in the 90 A cohort (Table 2).
is corrected to read as follows:
The expression patterns of these signaling molecules shown in heatmaps (Fig. 7B) indicate that STAT3 mediated regulation of these 5 signaling molecules (MAP2K4, NRG1, NCK2, ABL1 and GRB2) provides a poor prognostic indicator in the 90 A cohort (Table 2).
Page 36, left column
This sentence from the original article: For instance, we found the expression levels of GRB2, NCK2, STAT3, PRKCB1, MAP2K4, ABL1, IGF2R, LYN, and VEGFA in the STAT3 network to be predictors for poor clinical outcome in the 90 A cohort.
is corrected to read as follows:
For instance, we found the expression levels of NANOG, GRB2, NCK2, STAT3, PRKCB1, MAP2K4, ABL1, IGF2R, LYN, and VEGFA in the STAT3 network to be predictors for poor clinical outcome in the 90 A cohort.
This sentence from the original article:
Alternately, the expression levels of NANOG, OIP5, LDHB, NRG1 and POU5F1 in the STAT3 network are predicted to be good prognostic factors in the 90 A cohort (Fig. 3F and Table 2).
is corrected to read as follows:
Alternately, the expression levels of OIP5, LDHB, NRG1 and POU5F1 in the STAT3 network are predicted to be good prognostic factors in the 90 A cohort (Fig. 3F and Table 2).
This sentence from the original article:
Moreover, there are 6 poor and 5 good prognostic factors in the STAT3 network of 72 A cohort (Fig. 3F and Table 3).
is corrected to read as follows:
Moreover, there are 8 poor and 4 good prognostic factors in the STAT3 network of 72 A cohort (Fig. 3F and Table 3).
Page 37, right column
This sentence from the original article:
We found 9 poor prognostic factors and 5 good prognostic factors of the STAT3 network in the 90 A cohort (Fig. 3F and Table 2).
is corrected to read as follows:
We found 10 poor prognostic factors and 4 good prognostic factors of the STAT3 network in the 90 A cohort (Fig. 3F and Table 2).
Page 41, right column
These sentences from the original article:
It contains relatively high levels of GRB2, LYN, IGF2R, VEGFA, STAT3, NCK2, OIP5 and ABL1 and low levels of MAP2K4, PRKCB, POU5F1 and NRG1, indicating poor prognosis. Low levels of LDHB and NANOG predict good prognosis.
are corrected to read as follows:
It contains relatively high levels of GRB2, LYN, IGF2R, VEGFA, STAT3, NCK2, OIP5 and ABL1 and low levels of MAP2K4, PRKCB, POU5F1, NRG1 and NANOG, indicating poor prognosis. Relative low levels of LDHB predict good prognosis.
Supplementary Files
Please also view the Supplementary Files PDF, which contains corrected versions of Supplementary Figures S6.2–S6.3 and S7.1–S7.5.
Footnotes
ACADEMIC EDITOR: JT Efird, Editor in Chief
FUNDING: The original article was funded by grants (NSC95-2314-B-002-255-MY3 and NSC982314-B-002-093-MY2) to Fon-Jou Hsieh.
COMPETING INTERESTS: Authors disclose no potential conflicts of interest.
Associated Data
This section collects any data citations, data availability statements, or supplementary materials included in this article.


