

Abstract
Background
Acoustic radiation force impulse (ARFI) elastography is a reliable diagnostic device for quantitative non-invasive assessment of liver fibrosis in patients with chronic liver disease. The aim of our prospective study was to evaluate the impact of ARFI in patients after orthotopic liver transplantation (OLT). Therefore, we compared ARFI shear wave velocities with clinical features, non-invasive markers, and the histology of patients following OLT.
Material/Methods
Post-transplant patients underwent a clinical examination and blood samples were taken. B-mode and Doppler ultrasound (US) of the portal vein and the hepatic artery were performed. Subsequently, a minimum of 10 valid ARFI values were measured in the left and right liver lobe. Liver biopsy was performed if indicated.
Results
Between May 2012 and May 2014, 58 Patients after OLT were included in the prospective study. Laboratory markers and aspartate aminotransferase-to-platelet ratio index (APRI) correlated with ARFI values (r=0.44, p<0.001). The histological (n=22) fibrosis score (Ludwig) was significantly correlated with the ARFI of the biopsy site (r=0.55, p=0.008). The mean shear-wave velocities were significantly increased in advanced fibrosis (F≤2 1.57±0.57 m/s; F≥3 2.85±0.66 m/s; p<0.001), obstructive cholestasis and active viral hepatitis. The area under the receiver operating characteristic (AUROC) curves for the accuracy of ARFI were 74% (F≥1), 73% (F≥2), 93% (F≥3), and 80% (=F4).
Conclusions
ARFI elastography correlates well with laboratory values and with noninvasive and invasive markers of fibrosis in patients after OLT. In this regard, elevated ARFI-velocities should be interpreted with caution in the context of obstructive cholestasis and active viral disease.
MeSH Keywords: Elasticity Imaging Techniques, Liver Cirrhosis, Liver Transplantation, Ultrasonography
Background
Noninvasive imaging techniques for staging of liver fibrosis have become increasingly popular in patients with chronic liver disease. Although liver biopsy is the criterion standard for assessment of morphological liver alterations, it has the disadvantages of an invasive procedure with rare but clinically relevant complications. In addition, technical aspects such as sampling errors, small portal tract count, and variabilities among pathologists must also be taken into account. It has been shown that transient elastography (TE) and acoustic radiation force impulse (ARFI) are reliable techniques for diagnosing and excluding liver cirrhosis. In the clinical management of transplant patients, the value of these techniques, especially the role of ARFI, is not yet well established. Continuous improvements in surgical techniques and immunosuppression regimens have greatly improved the long-term results after liver transplantation. However, some patients develop acute complications after surgery (e.g., stricture of anastomosis, infections, acute rejection) or chronic complications during immunosuppressive treatment (e.g., chronic rejection, disease-relapse, drug-induced renal or hepatic complications) [1,2]. High liver stiffness (TE) due to advanced fibrosis is accompanied by hepatic complications, mortality, and potentially the need for re-transplantation [3,4]. Postoperative B-mode and Doppler US are standard procedures for the assessment of liver graft complications. Based on the combined information of abnormal laboratory findings, US findings and clinical symptoms liver biopsy (LB) can be indicated. Whether the assessment of liver stiffness is helpful for the management of post-OLT patients is currently unknown. Some studies have shown a correlation of TE with non-viral graft disease, rejection, and grade of fibrosis in patients with recurrent viral hepatitis C with or without antiviral treatment after OLT [5–7]. ARFI imaging is a promising US-based elastography device, which is based on short experience in the follow-up of post-OLT patients [8–11]. In contrast to TE, ARFI is not limited in patients with ascites and severe obesity due to technical failures [12]. ARFI is included in a conventional ultrasound machine and it can therefore be performed during a conventional B-mode examination of post-OLT patients (Figure 1). In this prospective study we analyzed ARFI-values in asymptomatic and symptomatic patients following OLT and correlated the results with invasive and non-invasive parameters of fibrosis and clinical condition.
Figure 1.
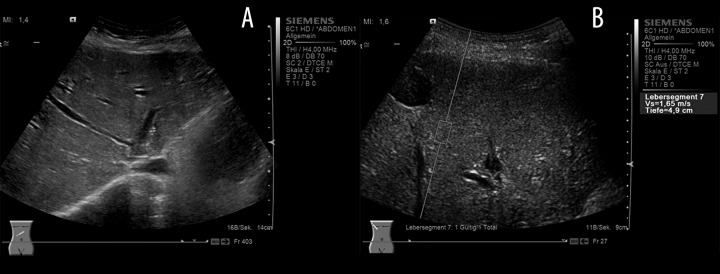
Ultrasound examination in a patient after orthotopic liver transplantation [Fibrosis stage (Ludwig) F2] (A) B-mode US showing irregular hepatic veins, inhomogeneous parenchyma, and an irregular liver surface. (B) ARFI elastometry during real-time B-mode US. Placement of the quadratic cursor in the region-of-interest by an intercostal approach in the right liver lobe (Segment VII). ARFI shear-wave-velocities (Vs) are displayed in m/s and the depth of measurement in centimeters (cm).
Material and Methods
Patients
Between May 2012 and May 2014, consecutive patients after OLT were recruited for the study during their follow-up visits. Patients were asked to participate in additional assessment of ARFI elastography. One patient had to be excluded because the ARFI-examination was unable to produce reliable values. A total of 58 patients were able to be considered for further evaluations. Prior to patient enrollment, the local ethics committee approved the project and the prospective study was registered (ClincalTrials.gov Identifier: NCT01664780). Written informed consent was obtained from all the patients. Descriptive data (sex, age, body-mass-index (BMI), period of time since the OLT, cause of liver failure or end-stage liver disease prior to OLT, and current immunosuppression) and blood samples (total bilirubin, AST, ALT, γ-GT, AP, albumin, and platelet count) were evaluated. Thereafter, the aspartate aminotransferase-to-platelet ratio index (APRI) was calculated as a non-invasive parameter for liver fibrosis [13] (Table 1). B-mode US examination of the abdomen and Doppler measurements (peak systolic velocity and resistance index (RI) in the hepatic artery and the mean portal vein velocity) were performed prior to ARFI by 1 experienced sonographer with more than 9 years of experience in US (German Society of Ultrasound in Medicine [DEGUM] Level 2).
Table 1.
Patient characteristics (laboratory standard value or value range in parentheses). Correlation of individual parameters with mean ARFI-velocity in the right liver lobe.
| Patient characteristics | r* | p-value | |
|---|---|---|---|
| Total (n) | 58 (100%) | ||
| Male (n) | 37 (64%) | −0.10 | n.s. |
| Female (n) | 21 (36%) | 0.10 | n.s. |
| Age (years; mean, SD) | 55±12 | −0.35 | p<0.05 |
| BMI (kg/m2 mean, SD) | 25.9±4.1 | −0.40 | p<0.05 |
| Years since OLT (mean, SD) | 11.6±23.2 | −0.25 | n.s. |
| Causes of liver failure or end-stage liver disease | n | ||
| Hepatocellular carcinoma | 15 (26%) | ||
| Alcoholic liver disease | 13 (22%) | ||
| Drug-induced liver failure | 6 (10%) | ||
| Hepatitis C | 5 (9%) | ||
| Hepatitis B | 4 (7%) | ||
| Morbus Wilson | 3 (5%) | ||
| Primary sclerosing cholangitis | 3 (5%) | ||
| Others | 9 (16%) | ||
| Immunosuppression | |||
| None | 1 (2%) | ||
| CSA or TAC mono | 35 (60%) | ||
| EVE + Steroid | 1 (2%) | ||
| TAC or CSA + MMF | 12 (20%) | ||
| TAC or CSA + MMF + Steroid | 8 (14%) | ||
| EVE + MMF + Steroid | 1 (2%) | ||
| Laboratory values and APRI-Score | Mean ±SD | r* | p-value |
| Total bilirubin (<1.1 mg/dl) | 1.15±1.6 | 0.45 | p<0.001 |
| AST (<50 U/l) | 48.9±60.6 | 0.52 | p<0.001 |
| ALT (<50 U/l) | 50.4±75.4 | 0.44 | p<0.001 |
| γ-GT (<60 U/l) | 146.6±234.9 | 0.33 | p<0.05 |
| AP (40–130 U/l) | 150.4±146 | 0.42 | p<0.05 |
| Albumin (35–55 mg/dl) | 41.5±8.2 | −0.30 | p<0.05 |
| Platelet count (140–400×103/μl) | 191.0±856 | 0.06 | n.s. |
| APRI-Score | 0.83±1.35 | 0.44 | p<0.001 |
Correlation coefficient (r);
BMI – Body Mass Index; OLT – orthotopic liver transplantation; CSA – cyclosporin A; TAC – Tacrolimus; EVE – Everolimus; MMF – Mycophenolate mofetil.
ARFI-assessment
ARFI is a device integrated in a conventional US system. Elastometry can be performed during real-time B-mode US with a single transducer of the Acuson S2000 US system (Virtual Touch™ Tissue Quantification, Siemens Acuson S2000, Siemens Medical Solutions, Erlangen, Germany). A quadratic cursor with a size of 10×5 mm representing the anatomic region of interest to be measured is placed in the requested area of the liver parenchyma. At the push of a button a short-duration acoustic pulse is transmitted, which leads to localized tissue displacement and consecutive shear wave propagation away from the area of excitation. The share wave propagation velocity (expressed in m/s) is proportional to the square root of tissue elasticity within the cursor [12,14].
All patients in our study were in the fasting state and followed the instruction for a relaxed breathing arrest. ARFI imaging was performed on the same day as the clinical examination and blood withdrawal with a curved array transducer (6C1HD; 4 MHz) of the Acuson S2000 US system. Ten valid measurements in the left (Segment III) and right (Segment VII) hepatic lobe could be achieved in all patients, avoiding large vessels or bile ducts [15]. The time needed to perform all ARFI measurements was approximately 5–10 min.
Liver biopsy, histological grading, and staging
Liver fibrosis shows slow progression and implies potential complications (e.g., risk of significant bleeding, pain). Therefore consistent LB was not an inherent part of the study protocol due to ethical reasons (especially for asymptomatic patients) and was performed if indicated in patients with suspected graft damage. The histological data of 22 patients was available for further analysis. Biopsy had been performed sonographically guided with a core tissue needle (external diameter 18G; 2.2 cm sample notch) in our department. Biopsy specimens of all patients were fixed in formalin (10%) and analyzed by an experienced pathologist, in the Institute of Pathology, University Hospital Erlangen. The Ludwig score [16] classification was used for graduation of the degree of fibrosis (F0=no fibrosis, F1=minimal portal fibrosis, F2=moderate periportal fibrosis with no architectural distortion, F3=substantial septal fibrosis with architectural distortion, and F4=liver cirrhosis).
Statistical analysis
Statistical analysis was performed using the Statistical Package for the Social Sciences (Version 19.0.0.1, IBM SPSS statistics, New York, USA). Clinical and laboratory data of the patients and ARFI-values are expressed as mean ± standard deviation (SD), counts, and percentages, as appropriate. The relationships between variables were examined using Spearman’s two-tailed pairwise correlation coefficient (r). Continuous variables of independent groups were calculated with the t-Test. Non-parametric tests were chosen to compare median values of 2 independent samples by Mann-Whitney U test in non-normally distributed data. Diagnostic accuracy and ARFI cutoff values were evaluated by using receiver-operating characteristic curves (ROC). All tests were two-sided. A p-value <0.05 indicated a significant correlation or difference.
Results
A total of 58 post-transplant patients [37 men (64%) and 21 women (36%); age 55 years ±11.9; mean BMI 25.9kg/m2 ±4.10; years since OLT 11.6±23.16] gave written informed consent and were included in the prospective study. The main causes of liver failure or end-stage liver disease were hepatocellular carcinoma (26%), alcoholic liver disease (22%), and viral hepatitis (17%). Patient characteristics and laboratory values are described in Table 1. Most patients had several conspicuous findings of B-mode US of the abdomen but normal findings by means of Doppler US parameters. Splenomegaly [n=36 (62%)], an irregular surface [n= 27 (47%)], irregular course of the hepatic veins [n=22 (38%)], and an inhomogeneous texture of the parenchyma [n=23 (40%)] were most commonly found. The peak systolic velocity of the hepatic artery was 60.1 cm/s ± 21.4 (range 30–138) with a mean RI of 0.69±0.10 (range 0.4–0.9), and a mean portal vein velocity of 28.7 cm/s ±12.8 (range 13–78). A statistically significant correlation of mean ARFI values was found with the age (r=−0.35, p<0.05) and BMI (r=−0.40, p<0.05). In addition, a good correlation of the most important laboratory parameters such as bilirubin (r=0.45, p<0.001), AST (r=0.52, p<0.001), ALT (r=0.44, p<0.001), γ-GT (r=0.33, p<0.05), and AP (r=0.42, p<0.05) could be proven. The APRI score as a non-invasive parameter for liver fibrosis correlated well with the mean ARFI velocity in the right liver lobe (r=0.44, p<0.001). The mean ARFI shear-wave velocity in our cohort (n=58) was 2.00±0.93 m/s (range 0.71–4.31) in the left liver lobe and 1.39±0.63 m/s (range 0.75–3.74) in the right liver lobe, and a significant difference of shear-wave velocity between both liver lobes was detected (p<0.001). Out of all patients, ARFI values were significantly increased in case of cholestasis and active viral hepatitis (Figure 2). Histopathological findings of 22 patients were available for further analysis in our cohort. Nine patients (15.5%) had a rejection, 10 patients (11%) had a distinct inflammation, and 5 patients (7%) had a significant fibrosis (≥F3). The histological fibrosis score [16] correlated significantly with ARFI results of the biopsy site (r=0.55, p=0.008). No significant difference could be found in comparison of the subgroups with existence or absence of rejection, steatosis, or portal/lobular inflammation in histology. The mean shear-wave velocity in cases with advanced fibrosis was significantly increased [F0–2: 1.57±0.57 m/s vs. F≥3: 2.85±0.66 m/s; p<0.001)]. ARFI correlations and distribution of values throughout the subgroups are displayed in Tables 1 and 2, and Figure 2. The results of ROC analysis for the assessment of diagnostic accuracy of ARFI considering staging of liver fibrosis are displayed in Table 3 and Figure 3. The diagnostic performance of ARFI for the prediction of advanced fibrosis (≥F3) was significant, assuming an ARFI cutoff value of 2.02 m/s (AUC 92.9%; p=0.004; sensitivity 100%, specificity 88%).
Figure 2.

Acoustic radiation force impulse imaging elastometry in patients following OLT. Box plots [median as thick line through each box which represents interquartile range within which 50% of values are located, first and third quartile, error bars mark minimum and maximum values (range), * outlier] showing the significantly increased ARFI-values in patients with (A) an advanced degree of fibrosis ≥F3 (Ludwig Score); (B) cholestasis and (C) active viral hepatitis.
Table 2.
ARFI shear-wave velocities (mean ± standard deviation): distribution of values dependent on the site of determination, cholestasis, presence of active viral hepatitis, and histological classification after LB.
| Total (n=58) | ARFI-velocity (m/s) | Intra-individual Standard Deviation | p-value |
|---|---|---|---|
| Segment III (n=58) | 2.00±0.93 | 0.31±0.19 | p<0.001 |
| Segment VII (n=58) | 1.39±0.63 | 0.16±0.11 | |
| Cholestasis No (n=51) | 1.33±0.59 | 0.15±0.09 | p<0.05 |
| Cholestasis Yes (n=7) | 1.83±0.84 | 0.23±0.19 | |
| Active viral hepatitis No (n=48) | 1.26±0.46 | 0.15±0.09 | p<0.001 |
| Active viral hepatitis Yes (n=10) | 2.03±0.94 | 0.22±0.15 | |
| Histological classification (n=22) | |||
| Rejection No (n=13) | 2.04±0.92 | 0.25±0.17 | n.s. |
| Rejection Yes (n=9) | 1.60±0.49 | 0.17±0.07 | |
| Inflammation No (n=12) | 1.68±0.67 | 0.20±0.15 | n.s. |
| Inflammation Yes (n=10) | 2.08±0.90 | 0.23±0.14 | |
| Fibrosis stage 0–2 (n=17) | 1.57±0.57 | 0.17±0.07 | p<0.001 |
| Fibrosis stage ≥3 (n=5) | 2.85±0.66 | 0.38±0.20 |
Table 3.
ROC analysis for the diagnostic accuracy and cut-offs of ARFI velocities for evaluating the stage of liver fibrosis.
| Fibrosis stage | AUC | Standard error | p-value | 95% Confidence Interval | Cutoff value (m/s) | Sensitivity (%) | Specificity (%) | |
|---|---|---|---|---|---|---|---|---|
| Lower bound | Upper bound | |||||||
| ≥F1 | 0.741 | 0.124 | 0.108 | 0.499 | 0.984 | 1.48 | 65 | 80 |
| ≥F2 | 0.727 | 0.111 | 0.071 | 0.510 | 0.945 | 1.75 | 64 | 82 |
| ≥F3 | 0.929 | 0.056 | 0.004 | 0.819 | 1.000 | 2.02 | 100 | 88 |
| =F4 | 0.800 | 0.089 | 0.171 | 0.625 | 0.975 | 2.29 | 100 | 80 |
Figure 3.

Receiver operating characteristic curves for the determination of different stages of liver fibrosis by ARFI.
Discussion
The results of our study show the significant correlation between ARFI values and liver fibrosis during follow-up examinations of post-OLT patients. We demonstrated the distribution of ARFI values for the distinction of different fibrosis stages. Furthermore, a clear correlation of ARFI and noninvasive laboratory markers of inflammation and fibrosis was found.
Non-invasive methods such as the ARFI or TE have increasing importance in the surveillance of patients following OLT as part of the daily routine and also as a supplement for clinical examination and laboratory diagnostics [7]. Assessment of fibrosis can be examined quickly and non-invasively for this group of patients by elastography. There is an extensive amount of data published on this subject, especially in patients with existing hepatitis C infection; TE was primarily used for investigation in post-OLT patients [6,17–22]. However, it should be noted that TE has some limitations. It is dedicated to specific equipment not included in an US machine, measurements are based on M- and A-mode imaging, but no B-mode information is available. Measurements of TE are difficult in patients with severe obesity and impossible in patients with ascites. ARFI is included in a conventional US machine; therefore, B-Mode information and the elastography measurement can be performed quickly using a single device and can thus expand the range of statement against TE [8,23]. The US-guided device makes it possible to identify the most appropriate place for the elastographic measurements and thereby enables valid results to be achieved in the majority of patients [24] (Figure 1). Thus, it seems to be obvious to apply ARFI imaging in the post-transplantation settings. A combination with noninvasive parameters may even improve sensitivity and specificity [10,25].
The aim of this prospective study was to evaluate the ARFI method on a routine collective of patients with successful liver transplant due to different underlying diseases and to correlate these findings with clinical parameters such as laboratory results and histology. US is the most frequently used imaging modality to assess acute or chronic post-transplantation complications. Beside the presentation of the parenchymal pattern, the structure of the biliary and vascular system shows various postoperative alterations. In the early postoperative condition, foreign material and reperfusion of the donor organ might lead to a temporary reduced gray-scale texture and inhomogeneity of the liver parenchyma. Echogenic reflexes might appear as a result of air-trapping, hemorrhage, or thrombotic material along the portal venous system. These factors also have an influence on objective parameters of Doppler US. In the most common biliary complications of anastomotic stenosis, ischemic type biliary lesions and postoperative biliary leakage are the focus of the sonographer. Although high-resolution imaging in real-time is feasible by US and despite the fact that it is able to provide a high level of specificity, low sensitivities of approximately 60% are reported, with limitations to its application in this regard [26]. Many of the structural changes are reversible or are not representable by US (e.g., the recipients’ part of the common bile duct or hepatic artery). They therefore might provide unreliable parameters for the estimation of a possible graft injury and lead to a high rate of false-positive results and the need for further diagnostics [8,17,23,27]. In our study, 47% of the allografts showed an irregular surface, 40% showed inhomogeneous parenchyma, 38% showed irregular hepatic veins, 31% showed an enlarged liver, and 12% showed cholestasis (10 patients with anastomotic stenosis, including 7 with obstruction of the bile ducts and consecutive cholestasis). ARFI-values correlated well with laboratory markers of cholestasis and sonographic cholestasis (r=0.29; p<0.05). ARFI-velocity was significantly increased in patients with cholestasis in our collective (no cholestasis 1.33±0.59 m/s vs. cholestasis 1.83±0.84 m/s; p<0.05). Comparable results could be derived in active viral hepatitis. Our data illustrates significantly increased ARFI values in active viral hepatitis (Table 2). Therefore, increased ARFI-values in patients with cholestasis or active viral hepatitis could be misinterpreted as existence of significant liver fibrosis [23]. On the other hand, this could be an advantage in the follow-up of patients with a surprising increase in ARFI values. Since the appearance of significant obstructive cholestasis or viral activity could be detected early, further treatment could be initiated in time.
In the current study, the ARFI values also correlated significantly with patient characteristics such as BMI and age, but especially with the level of liver enzymes (AST, ALT, γ-GT, AP, bilirubin) and APRI. These expected results could be verified because the liver stiffness correlated in previous studies using ARFI or TE following OLT not only with the fibrosis stage, but also with necroinflammatory activity, cholestasis, steatosis, and cellular rejection [7,8,28,29]. In patients with HCV-infected liver transplants (n=56) Corradi et al. [21] prospectively compared non-invasive fibrosis tests, such as ARFI, Forns, Benlloch, and the Doppler resistance test with TE. Here, a correlation with the test results and elastography measurements was observed, leading to the identification of ≥F2 fibrosis in the elastography with very high accuracy. This superiority of elastography compared with non-invasive laboratory tests has also been confirmed in other studies [17,18,20]. In a study of 124 patients with successful liver transplantation for chronic hepatitis C, an excellent correlation between the histological stage of fibrosis and liver stiffness could be determined by means of TE, showing a cut-off of 8.7 kPa with a sensitivity and negative predictive value of >0.90 in all cases [30]. These results were confirmed by several complementary studies and 2 systematic reviews. Based on these study results, the cut-off values for the detection of patients with >F2 fibrosis vary between 7.9 and 10.1 kPa, while the cut-off values for cirrhotic transplanted with cadaver donation range from 12.0 to 12.5 kPa [6,17–22,31,32]. Adebajo et al. showed an even higher level of accuracy in HCV patients as regards the prediction of F2–4 fibrosis in patients with transplants as compared to those without [17]. Here, we could also identify a correlation between the measured ARFI values and the examined APRI-Score in our cohort, which reflects a correlation between the ARFI values and liver fibrosis [correlation between APRI value and ARFI velocity in the right liver lobe: (r=0.44, p<0.001)]. Although APRI as a noninvasive marker of fibrosis correlated well with advanced fibrosis and cirrhosis, ARFI elastometry performed better than noninvasive markers (correlation for ≥F3: APRI: r=0.446, p=0.038; ARFI: r=0.620, p=0.002) in the present study. In conclusion, the initial absolute ARFI values and their changes during the clinical follow-up must be interpreted in combination with anamnestic information and laboratory values.
The ARFI-elastography in transplanted patients showed higher absolute values compared to previously published data of patients without transplantation. A shear wave velocity of 1.39±0.63 m/s in the right and of 2.00±0.93 m/s in the left lobe of the liver could be measured in the currently examined transplanted collective (n=58). This difference of values from measurements in the left and right liver lobe is in accordance with data from non-transplant patients (Goertz RS et al. [23] right liver lobe 1.07±0.18 m/s, left liver lobe 1.48±0.44). Therefore, the recommendations for ARFI measurements in the right liver lobe (in Segment VII) should also be respected in post-OLT patients [23].
In our cohort we found mean ARFI values of 2.85±0.90 m/s for patients with ≥F3 fibrosis, while the shear wave velocities in patients with F0–2 fibrosis were significantly lower (1.57±0.57 m/s). Thus, a clear differentiation between low- and high-grade fibrosis after OLT seems to be possible. Several studies in non-transplant patients have reported that ARFI imaging provides good diagnostic performance and excellent accuracy for assessing hepatic fibrosis in chronic liver disease [33,34]. For fibrosis staging by ARFI elastography in post-OLT patients, only short experience is available [8–11]. Heterogeneous patient collectives (etiology, comorbidity, and disease course) in the post-transplant cohort hinder the comparison and realization of large prospective clinical studies. However, Liao et al. [11] recently presented a satisfactory correlation of ARFI values and fibrosis stage. The AUC for early fibrosis (≥F1) was 72.1%, assuming the ARFI cutoff value of 1.058 m/s (sensitivity 95.5% and specificity 25.7%). A limitation of the study is the small amount of advanced fibrosis (n=3 for ≥F2; total n=57) and the absence of cirrhotic (n=0 for F4) patients after OLT. Focusing on the results of our study, the areas under the ROC curves for patients with advanced fibrosis (≥F3) and cirrhosis (≥F4) were 92.9% and 80%, respectively (Figure 3). Thereby, the cutoff values are arranged discretely higher (Table 3).
On the basis of our data, we can show that post-OLT patients present higher absolute ARFI values compared to the normal population. OLT patients with elevated liver enzymes, cholestasis, acute viral hepatitis, and fibrosis show significantly increased ARFI velocities. Therefore, ARFI-values must be interpreted within the context of serum tests and the clinical condition.
Conclusions
In patients after OLT, ARFI imaging quickly provides information on liver fibrosis during on-site examination, irrespective of unclear grey-scale or Doppler US parameters. Therefore, unnecessary diagnostics and interventions in cases involving low values might be reduced in the clinical context. In summary, ARFI is a promising additional tool in the daily routine care of patients after OLT. For this to be verified, it is necessary that further validations in patients after OLT should be carried out in larger collectives.
Acknowledgements
Andrea Haas, Ines Straßburger, Draženko Paurevič, and Claudia Schiffer are acknowledged for patient scheduling and preparation of examinations.
Footnotes
Source of support: Departmental sources
References
- 1.Lucey MR, Terrault N, Ojo L, et al. Long-term management of the successful adult liver transplant: 2012 practice guideline by the American Association for the Study of Liver Diseases and the American Society of Transplantation. Liver Transpl. 2013;19(1):3–26. doi: 10.1002/lt.23566. [DOI] [PubMed] [Google Scholar]
- 2.Singh AK, Nachiappan AC, Verma HA, et al. Postoperative imaging in liver transplantation: what radiologists should know. Radiographics. 2010;30(2):339–51. doi: 10.1148/rg.302095124. [DOI] [PubMed] [Google Scholar]
- 3.Pang JX, Zimmer S, Niu S, et al. Liver stiffness by transient elastography predicts liver-related complications and mortality in patients with chronic liver disease. PloS one. 2014;9(4):e95776. doi: 10.1371/journal.pone.0095776. [DOI] [PMC free article] [PubMed] [Google Scholar]
- 4.Carrion JA, Navasa M, Forns X. Retransplantation in patients with hepatitis C recurrence after liver transplantation. J Hepatol. 2010;53(5):962–70. doi: 10.1016/j.jhep.2010.06.006. [DOI] [PubMed] [Google Scholar]
- 5.Bellido-Munoz F, Giraldez-Gallego A, Roca-Oporto C, et al. Monitoring the natural evolution and response to treatment of post liver transplant recurrent hepatitis C using transient elastography: preliminary results. Transplant Proc. 2012;44(7):2082–86. doi: 10.1016/j.transproceed.2012.07.090. [DOI] [PubMed] [Google Scholar]
- 6.Harada N, Soejima Y, Taketomi A, et al. Assessment of graft fibrosis by transient elastography in patients with recurrent hepatitis C after living donor liver transplantation. Transplantation. 2008;85(1):69–74. doi: 10.1097/01.tp.0000297248.18483.16. [DOI] [PubMed] [Google Scholar]
- 7.Rigamonti C, Fraquelli M, Bastiampillai AJ, et al. Transient elastography identifies liver recipients with nonviral graft disease after transplantation: a guide for liver biopsy. Liver Transpl. 2012;18(5):566–76. doi: 10.1002/lt.23391. [DOI] [PubMed] [Google Scholar]
- 8.Crespo G, Fernandez-Varo G, Marino Z, et al. ARFI, FibroScan, ELF, and their combinations in the assessment of liver fibrosis: a prospective study. J Hepatol. 2012;57(2):281–87. doi: 10.1016/j.jhep.2012.03.016. [DOI] [PubMed] [Google Scholar]
- 9.Tomita H, Hoshino K, Fuchimoto Y, et al. Acoustic radiation force impulse imaging for assessing graft fibrosis after pediatric living donor liver transplantation: a pilot study. Liver Transpl. 2013;19(11):1202–13. doi: 10.1002/lt.23708. [DOI] [PubMed] [Google Scholar]
- 10.Pinto J, Matos H, Nobre S, et al. Comparison of acoustic radiation force impulse/serum noninvasive markers for fibrosis prediction in liver transplant. J Pediatr Gastroenterol Nutr. 2014;58(3):382–86. doi: 10.1097/MPG.0000000000000226. [DOI] [PubMed] [Google Scholar]
- 11.Liao CC, Chen TY, Tsang LC, et al. The acoustic radiation force impulse elastography evaluation of liver fibrosis in posttransplantation dysfunction of living donor liver transplantation. Transplant Proc. 2014;46(3):876–79. doi: 10.1016/j.transproceed.2013.12.012. [DOI] [PubMed] [Google Scholar]
- 12.Bamber J, Cosgrove D, Dietrich CF, et al. EFSUMB guidelines and recommendations on the clinical use of ultrasound elastography. Part 1: Basic principles and technology. Ultraschall Med. 2013;34(2):169–84. doi: 10.1055/s-0033-1335205. [DOI] [PubMed] [Google Scholar]
- 13.Lin ZH, Xin YN, Dong QJ, et al. Performance of the aspartate aminotransferase-to-platelet ratio index for the staging of hepatitis C-related fibrosis: an updated meta-analysis. Hepatology. 2011;53(3):726–36. doi: 10.1002/hep.24105. [DOI] [PubMed] [Google Scholar]
- 14.Nightingale K. Acoustic Radiation Force Impulse (ARFI) Imaging: a Review. Curr Med Imaging Rev. 2011;7(4):328–39. doi: 10.2174/157340511798038657. [DOI] [PMC free article] [PubMed] [Google Scholar]
- 15.Goertz RS, Egger C, Neurath MF, Strobel D. Impact of food intake, ultrasound transducer, breathing maneuvers and body position on acoustic radiation force impulse (ARFI) elastometry of the liver. Ultraschall Med. 2012;33(4):380–85. doi: 10.1055/s-0032-1312816. [DOI] [PubMed] [Google Scholar]
- 16.Ludwig J. The nomenclature of chronic active hepatitis: an obituary. Gastroenterology. 1993;105(1):274–78. doi: 10.1016/0016-5085(93)90037-d. [DOI] [PubMed] [Google Scholar]
- 17.Adebajo CO, Talwalkar JA, Poterucha JJ, et al. Ultrasound-based transient elastography for the detection of hepatic fibrosis in patients with recurrent hepatitis C virus after liver transplantation: a systematic review and meta-analysis. Liver Transpl. 2012;18(3):323–31. doi: 10.1002/lt.22460. [DOI] [PubMed] [Google Scholar]
- 18.Beckebaum S, Iacob S, Klein CG, et al. Assessment of allograft fibrosis by transient elastography and noninvasive biomarker scoring systems in liver transplant patients. Transplantation. 2010;89(8):983–93. doi: 10.1097/TP.0b013e3181cc66ca. [DOI] [PubMed] [Google Scholar]
- 19.Carrion JA, Torres F, Crespo G, et al. Liver stiffness identifies two different patterns of fibrosis progression in patients with hepatitis C virus recurrence after liver transplantation. Hepatology. 2010;51(1):23–34. doi: 10.1002/hep.23240. [DOI] [PubMed] [Google Scholar]
- 20.Cholongitas E, Tsochatzis E, Goulis J, Burroughs AK. Noninvasive tests for evaluation of fibrosis in HCV recurrence after liver transplantation: a systematic review. Transpl Int. 2010;23(9):861–70. doi: 10.1111/j.1432-2277.2010.01142.x. [DOI] [PubMed] [Google Scholar]
- 21.Corradi F, Piscaglia F, Flori S, et al. Assessment of liver fibrosis in transplant recipients with recurrent HCV infection: usefulness of transient elastography. Dig Liver Dis. 2009;41(3):217–25. doi: 10.1016/j.dld.2008.06.009. [DOI] [PubMed] [Google Scholar]
- 22.Rigamonti C, Donato MF, Fraquelli M, et al. Transient elastography predicts fibrosis progression in patients with recurrent hepatitis C after liver transplantation. Gut. 2008;57(6):821–27. doi: 10.1136/gut.2007.135046. [DOI] [PubMed] [Google Scholar]
- 23.Goertz RS, Zopf Y, Jugl V, et al. Measurement of liver elasticity with acoustic radiation force impulse (ARFI) technology: an alternative noninvasive method for staging liver fibrosis in viral hepatitis. Ultraschall Med. 2010;31(2):151–55. doi: 10.1055/s-0029-1245244. [DOI] [PubMed] [Google Scholar]
- 24.Berzigotti A, Abraldes JG, Tandon P, et al. Ultrasonographic evaluation of liver surface and transient elastography in clinically doubtful cirrhosis. J Hepatol. 2010;52(6):846–53. doi: 10.1016/j.jhep.2009.12.031. [DOI] [PubMed] [Google Scholar]
- 25.Castera L, Vergniol J, Foucher J, et al. Prospective comparison of transient elastography, Fibrotest, APRI, and liver biopsy for the assessment of fibrosis in chronic hepatitis C. Gastroenterology. 2005;128(2):343–50. doi: 10.1053/j.gastro.2004.11.018. [DOI] [PubMed] [Google Scholar]
- 26.Potthoff A, Hahn A, Kubicka S, et al. Diagnostic value of ultrasound in detection of biliary tract complications after liver transplantation. Hepat Mon. 2013;13(1):e6003. doi: 10.5812/hepatmon.6003. [DOI] [PMC free article] [PubMed] [Google Scholar]
- 27.Sanyal R, Lall CG, Lamba R, et al. Orthotopic liver transplantation: reversible Doppler US findings in the immediate postoperative period. Radiographics. 2012;32(1):199–211. doi: 10.1148/rg.321115006. [DOI] [PubMed] [Google Scholar]
- 28.Yoon KT, Lim SM, Park JY, et al. Liver stiffness measurement using acoustic radiation force impulse (ARFI) elastography and effect of necroinflammation. Dig Dis Sci. 2012;57(6):1682–91. doi: 10.1007/s10620-012-2044-4. [DOI] [PubMed] [Google Scholar]
- 29.Chen SH, Li YF, Lai HC, et al. Effects of patient factors on noninvasive liver stiffness measurement using acoustic radiation force impulse elastography in patients with chronic hepatitis C. BMC Gastroenterol. 2012;12:105. doi: 10.1186/1471-230X-12-105. [DOI] [PMC free article] [PubMed] [Google Scholar]
- 30.Carrion JA, Navasa M, Bosch J, et al. Transient elastography for diagnosis of advanced fibrosis and portal hypertension in patients with hepatitis C recurrence after liver transplantation. Liver Transpl. 2006;12(12):1791–98. doi: 10.1002/lt.20857. [DOI] [PubMed] [Google Scholar]
- 31.Kamphues C, Lotz K, Rocken C, et al. Chances and limitations of non-invasive tests in the assessment of liver fibrosis in liver transplant patients. Clin Transplant. 2010;24(5):652–59. doi: 10.1111/j.1399-0012.2009.01152.x. [DOI] [PubMed] [Google Scholar]
- 32.Masuzaki R, Yamashiki N, Sugawara Y, et al. Assessment of liver stiffness in patients after living donor liver transplantation by transient elastography. Scand J Gastroenterol. 2009;44(9):1115–20. doi: 10.1080/00365520903078810. [DOI] [PubMed] [Google Scholar]
- 33.Nierhoff J, Chavez Ortiz AA, Herrmann E, et al. The efficiency of acoustic radiation force impulse imaging for the staging of liver fibrosis: a meta-analysis. Eur Radiol. 2013;23(11):3040–53. doi: 10.1007/s00330-013-2927-6. [DOI] [PubMed] [Google Scholar]
- 34.Friedrich-Rust M, Nierhoff J, Lupsor M, et al. Performance of Acoustic Radiation Force Impulse imaging for the staging of liver fibrosis: a pooled meta-analysis. J Viral Hepat. 2012;19(2):e212–9. doi: 10.1111/j.1365-2893.2011.01537.x. [DOI] [PubMed] [Google Scholar]