

Abstract
Schizophrenia is characterized by loss of brain volume, which may represent an ongoing pathophysiological process. This loss of brain volume may be explained by reduced neuropil rather than neuronal loss, suggesting abnormal synaptic plasticity and cortical microcircuitry. A possible mechanism is hypofunction of the NMDA-type of glutamate receptor, which reduces the excitation of inhibitory GABAergic interneurons, resulting in a disinhibition of glutamatergic pyramidal neurons. Disinhibition of pyramidal cells may result in excessive stimulation by glutamate, which in turn could cause neuronal damage or death through excitotoxicity.
In this study, GABA/creatine ratios, and glutamate, NAA, creatine and choline concentrations in the prefrontal and parieto-occipital cortices were measured in 17 patients with schizophrenia and 23 healthy controls using proton magnetic resonance spectroscopy at an ultra-high magnetic field strength of 7 T. Significantly lower GABA/Cr ratios were found in patients with schizophrenia in the prefrontal cortex as compared to healthy controls, with GABA/Cr ratios inversely correlated with cognitive functioning in the patients. No significant change in the GABA/Cr ratio was found between patients and controls in the parieto-occipital cortex, nor were levels of glutamate, NAA, creatine, and choline differed in patients and controls in the prefrontal and parieto-occipital cortices. Our findings support a mechanism involving altered GABA levels distinguished from glutamate levels in the medial prefrontal cortex in schizophrenia, particularly in high functioning patients. A (compensatory) role for GABA through altered inhibitory neurotransmission in the prefrontal cortex may be ongoing in (higher functioning) patients with schizophrenia.
Keywords: Schizophrenia, GABA, Glutamate, 1H-MRS, 7 T
Highlights
-
•
GABA and glutamate were measured in schizophrenia patients and healthy controls using 1H-MRS at 7 T.
-
•
Patients showed significantly lower prefrontal GABA levels, and no changes were found for glutamate.
-
•
Prefrontal GABA levels were inversely correlated with total IQ in patients.
-
•
This suggests a mechanism involving GABA distinguished from glutamate in the prefrontal cortex.
-
•
GABA may have a compensatory role in the prefrontal cortex in (higher functioning) patients.
1. Introduction
Schizophrenia is characterized by loss of brain volume that is at least in part progressive in nature, and which may represent an ongoing pathophysiological process (Hulshoff Pol et al., 2008). This loss of brain volume may be explained by reduced neuropil rather than neuronal loss, suggesting abnormal synaptic plasticity and cortical microcircuitry (Harrison, 1999). The mechanisms underlying brain volume loss in schizophrenia are not known, although it has been suggested that the glutamatergic system may be involved (Harrison and Weinberger, 2005). A recent cross-sectional study showed that increased hippocampal glutamatergic levels in unmedicated schizophrenia patients were correlated with hippocampal volume reductions (Kraguljac et al., 2013). Glutamate (Glu) is the most abundant excitatory neurotransmitter in the central nervous system (CNS) (Fonnum, 1984). Recent meta-analyses of cross-sectional studies show that glutamate levels are decreased in chronic schizophrenia patients and elevated in medication-naïve and medication free patients (Marsman et al., 2013a; Poels et al., 2014). It may thus be that glutamate is elevated in the early stages of schizophrenia and decreases after treatment with antipsychotic medication. Indeed, pharmacologically induced NMDA receptor hypofunction causes increases in glutamate levels (Moghaddam et al., 1997). Also, a longitudinal study (De la Fuente-Sandoval et al., 2013) and a cross-sectional study (Kegeles et al., 2012) showed that antipsychotic medication decreases the elevated glutamate levels in the unmedicated state. Altered glutamate levels may be a result of hypofunction of the NMDA-type of glutamate receptor (Olney et al., 1999; Kondziella et al., 2007; Stone et al., 2009). NMDA-receptor hypofunction reduces the excitation of inhibitory GABAergic interneurons, resulting in a disinhibition of glutamatergic pyramidal neurons, which may drive a hyperdopaminergic state that produces psychosis. A major effect of NMDA receptor antagonism may be to produce disinhibition of pyramidal cells (Lisman et al., 2008; Lewis and Moghaddam, 2006). Disinhibition of pyramidal cells may result in excessive stimulation by glutamate, which in turn could cause neuronal damage or death through excitotoxicity. One of the meta-analyses showed an increase in glutamine, the precursor of glutamate, in schizophrenia, which may lead to increased glutamate levels as reported in medication-naïve and medication free patients (Marsman et al., 2013a; Poels et al., 2014). However, in case of decreased glutamate as seen in chronic patients, it could also suggest a deficiency in glutaminase, the enzyme that converts glutamine into glutamate (Marsman et al., 2013a).
GABA has indeed been implicated in schizophrenia based on postmortem and animal studies showing reduced expression of pre- and postsynaptic markers of GABAergic neurotransmission in subpopulations of GABAergic interneurons in the prefrontal cortex in postmortem and animal studies (Benes and Berretta, 2001; Lewis et al., 2004; Coyle, 2004). However, postmortem studies generally include patients who have been ill for many years. To examine glutamate and GABA levels in the early stages of the disease, in vivo measurements using magnetic resonance spectroscopy (MRS) are the method of choice (De la Fuente-Sandoval et al., 2011; Goto et al., 2009).
So far, a total of seven studies investigated GABA levels in vivo in the brains of patients with schizophrenia, using proton MRS (1H -) (Kegeles et al., 2012; De la Fuente-Sandoval et al., 2011; Goto et al., 2009; Ongür et al., 2010; Tayoshi et al., 2010; Yoon et al., 2010; Rowland et al., 2013), which reported increased (Kegeles et al., 2012; Ongür et al., 2010), decreased (Goto et al., 2009; Yoon et al., 2010), and normal (Kegeles et al., 2012; Goto et al., 2009; Tayoshi et al., 2010; Yoon et al., 2010; Rowland et al., 2013) GABA levels dependent on disease stage, medication intake and brain area studied. The only study of GABA in unmedicated patients found elevated GABA levels in the medial prefrontal cortex in unmedicated patients, but not in medicated patients, suggesting that antipsychotic medication decreases the elevated GABA levels (Kegeles et al., 2012). However, since these studies have been done at conventional magnetic field strengths (such as 3 T) subtle changes in these metabolite levels may have remained concealed.
Performing 1H-MRS at ultra-high magnetic field strength (7 T) has two clear advantages. The sensitivity of the measurements of metabolite concentrations is increased because of the increased signal-to-noise ratio (SNR) and the increased spectral resolution allows for a better separation of the individual metabolite spectra. For instance, at a magnetic field strength of 7 T it is now possible to adequately separate the glutamate and glutamine signals resulting in a higher accuracy of glutamate measurement (Tkác et al., 2001). However, detection of metabolites at a higher magnetic field strength is complicated by reduced accuracy in localization of the region of interest (Boer et al., 2011; Andreychenko et al., 2012). The sLASER (semi-localized by adiabatic selective refocusing) sequence enables 1H-MRS of the human brain at 7 T with increased localization accuracy, SNR and reliability (Boer et al., 2011; Marsman et al., submitted). Despite the increased SNR, the measurement of GABA is not straightforward because the concentration of GABA is low compared to other brain metabolites and the GABA signal is obscured by other overlapping metabolites with higher signal intensity. To overcome this problem, spectral editing techniques can be applied to isolate the GABA signal (Puts and Edden, 2012). In this study we used the sLASER sequence combined with editing techniques (MEGA-sLASER) which allows for accurate and time-efficient detection of GABA (Andreychenko et al., 2012).
The purpose of this study was to measure GABA and glutamate levels in patients with schizophrenia and healthy control subjects at ultra-high field (7 T). We collected data from the medial prefrontal region, which is known to show structural abnormalities in schizophrenia (Harrison, 1999), and the medial parieto-occipital region as a control area. Based on prior MRS studies of medicated schizophrenia patients, and structural MRI studies of schizophrenia patients which suggest alterations in the frontal brain region and only to a limited extent in the occipital brain region (Harrison, 1999; Haijma et al., 2013), we hypothesized that frontal GABA and glutamate levels are reduced, and parieto-occipital GABA and glutamate levels are unchanged in schizophrenia (Goto et al., 2009; Ongür et al., 2010; Yoon et al., 2010). To our knowledge this is the first study in schizophrenia patients using 1H-MRS at a magnetic field strength of 7 T.
2. Methods
2.1. Subjects
A total of 40 individuals participated in the study, including 17 patients with schizophrenia, and 23 healthy control participants matched to the patients for age, sex and their parents' socio-economic status. Healthy participants had no major psychiatric or neurological history, no history of drug or alcohol abuse, and no first-degree relatives with psychiatric or neurological disorders. The study was approved by the Medical Ethics Committee of the University Medical Center Utrecht, The Netherlands, and performed according to the directives of the Declaration of Helsinki (amendment of Seoul, 2008). All participants provided written informed consent prior to the examination.
All individuals underwent psychiatric assessment using the Comprehensive Assessment of Symptoms and History (Andreasen et al., 1992). Symptom severity was assessed using the Positive and Negative Syndrome Scale (PANSS) (Kay et al., 1987). Current daily dosage and cumulative life-time dosage of antipsychotic medication in haloperidol equivalents were calculated (Andreasen et al., 2010). In addition, current or prior use of benzodiazepines was established. All individuals underwent a general cognitive assessment using the full Wechsler Adult Intelligence Scale (WAIS) — III (Wechsler, 1997), which revealed a total intelligence quotient (TIQ) as well as a verbal and performance IQ, and working memory, perceptual reasoning, and verbal comprehension indices. Cognitive assessment could be successfully completed in all but three healthy subjects because of logistical reasons. One patient was not able to complete the MR acquisition because of a relapse in symptoms.
No differences between the groups were found for age, parental completed level of education and sex. Groups differed significantly in completed level of education, with patients having lower education, and on general cognitive functioning, with patients having a lower level of intelligence, as compared to the controls (Table 1).
Table 1.
Demographic characteristics.
| Characteristic | Patients | Controls | Statistic (p-value based on t, χ2) |
|---|---|---|---|
| Sex, M/F, N | 13/4 | 16/7 | 0.45 |
| Age, mean (SD), min–max, years | 27.6 (6.1), 20.6–41. 7 | 27.7 (5.3), 21.5–40. 9 | 0.97 |
| Years of education, mean (SD) | |||
| Participants | 13.3 (1.9) | 14.1 (2.1) | 0.08 |
| Parents | 14.3 (3.0) | 15.0 (1.3) | 0.61 |
| Total IQ, mean (SD) | 92.8 (14.5) | 108.3 (13.0) | 0.002 |
| Duration of illness, mean (SD), min–max, months | 77.4 (82.1), 1–213 | ||
| PANSS, mean (SD) | |||
| Total | 53.1 (12.7) | ||
| Negative | 12.9 (4.5) | ||
| Positive | 12.7 (5.1) | ||
| General | 27.5 (7.3) | ||
| Antipsychotic medication | |||
| Current daily dosage in haloperidol equivalentsa, N, mean (SD) | |||
| Typical | |||
| Clozapine | 7, 4.26 (2.15) | ||
| Atypical | 14, 5.48 (2.92) | ||
| Olanzapine | 8, 6.84 (2.79) | ||
| Risperidone | 1, 5.56 | ||
| Aripiprazole | 4, 4.04 (1.41) | ||
| Sulpiride | 1, 0.29 | ||
| Antipsychotic medication | |||
| Cumulative dosage in haloperidol equivalentsb, N, mean (SD) | |||
| Typical | 5, 572 (483) | ||
| Clozapine | 8, 6031 (6846) | ||
| Atypical | 16, 3903 (4003) | ||
| Olanzapine | 15, 2647 (3904) | ||
| Risperidone | 5, 1934 (3219) | ||
| Aripiprazole | 7, 1590 (1418) | ||
| Quetiapine | 4, 445 (638) | ||
| Benzodiazepines current N (%), cumulative N (%) | 6 (35%), 11 (65%) |
The significance of bold values indicates level was set at 0.05.
4 patients were using two or more types of antipsychotic medication at the time of the study.
13 patients had used two or more types of antipsychotic medication during their lifespan.
2.2. MR acquisition
All investigations were performed on a 7 T whole body MR scanner (Philips, Cleveland, OH, USA). A birdcage transmit head coil was used in dual transmit driven by 2 × 4 kW amplifiers, in combination with a 32-channel receive coil (both Nova Medical, Inc., Burlington, MA, USA). MR acquisition took approximately 50 min per participant.
For anatomical reference and gray and white matter tissue classification a T1-weighted magnetization prepared rapid gradient echo (MP-RAGE) sequence was obtained (450 slices, slice thickness = 0.8 mm, TR = 7 ms, TE = 3 ms, flip angle = 8°, FOV = 250 × 200 × 180 mm, 312 × 312 acquisition matrix, SENSE factor 2.7, scan duration = 408 s).
For the assessment of glutamate and the major spectral components NAA, creatine and choline, 1H-MRS experiments were conducted using a sLASER sequence (semi-localized by adiabatic selective refocusing; TE = 28 ms, 32 averages, TR = 5 s, acquisition time = 2 min 40 s, 4 kHz acquisition bandwidth, 2048 datapoints) (Fig. 1). Voxels (2 × 2 × 2 cm3) were located in the medial prefrontal and medial parieto-occipital lobes (Fig. 2). Non-water-suppressed spectra were obtained for quantification (carrier frequency was set to the chemical shift of H2O, acquisition time = 10 s).
Fig. 1.
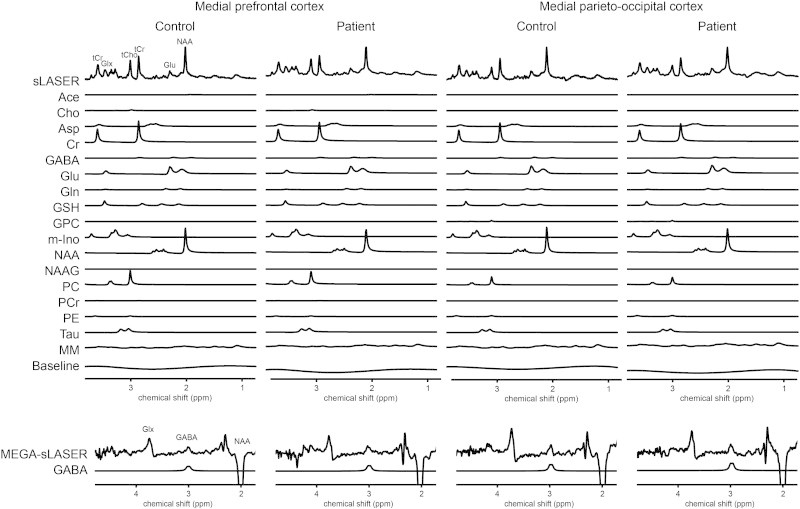
Typical metabolite spectra and fits.
Fig. 2.

Voxel placement. A: Medial prefrontal sLASER voxel: (A) sagittal view, (B) axial view, and (C) coronal view. Medial prefrontal MEGA-sLASER voxel: (D) sagittal view, (E) axial view, and (F) coronal view. Medial parieto-occipital sLASER voxel: (G) sagittal view, (H) axial view, and (I) coronal view. Medial parieto-occipital MEGA-sLASER voxel: (J) sagittal view, (K) axial view, and (L) coronal view.
GABA-edited 1H-MRS experiments were conducted using a MEGA-sLASER sequence (TE = 74 ms, 64 averages, TR = 4 s, acquisition time = 4 min 16 s, 4 kHz acquisition bandwidth, 2048 datapoints) (Fig. 1). Voxels (2.5 × 2.5 × 2.5 cm3) were located in the medial frontal and medial parieto-occipital regions (Fig. 2). GABA-editing with macromolecule suppression was performed by shifting the editing pulse between 1.9 (edit-on) and 1.4 ppm (edit-off) in subsequent scans (Andreychenko et al., 2012). After frequency and phase alignment the subtraction of edit-on and edit-off scans yielded a GABA spectrum where the summation of all scans resulted in a non-edited spectrum which was used for the determination of the creatine peak (Andreychenko et al., 2012). Prior to the MRS exams, second order B0 shimming was applied using the FASTERMAP algorithm at the voxel of interest (Gruetter, 1993; Gruetter and Boesch, 1992). Second, at this location, a high B1 field was generated to minimize chemical shift displacement artifacts (Versluis et al., 2010). The highest possible B1 field was generated by optimizing the phase of both transmit channels to locally assure constructive B1 interferences (Boer et al., 2011).
Spectral quality measures, i.e. signal-to-noise ratio (SNR), Cramèr–Rao lower bounds (CRLBs) of the major spectral components, and linewidth, were calculated and addressed for differences between groups and voxel locations. The SNR of the MEGA-sLASER was even higher than reported in the initial paper for this sequence, which also showed standard deviations of only 7% for GABA/Cr ratios (Andreychenko et al., 2012). Small significant differences between groups were found for SNR of the frontal sLASER spectra, linewidth of the parieto-occipital spectra and CRLB of frontal NAA (Table 2). High SNRs, low CRLBs and small linewidths were found, hence overall quality of the obtained spectra can be regarded as excellent.
Table 2.
Spectral quality (mean (SD)).
| Medial prefrontal cortex |
Medial parieto-occipital cortex |
|||||
|---|---|---|---|---|---|---|
| Patients | Controls | Statistic (p-value based on t, χ2) | Patients | Controls | Statistic (p-value based on t, χ2) | |
| SNR sLASERa | 51.9 (15.2) | 64.8 (19.7) | 0.046 | 50.5 (12.9) | 61.0 (22.8) | n.s. |
| SNR MEGA-sLASERa | 9.0 (3.2) | 11.5 (5.2) | n.s. | 10.7 (4.0) | 9.0 (3.4) | n.s. |
| Linewidth (Hz) | 9.0 (1.2) | 8.4 (1.4) | n.s. | 9.5 (1.1)a | 8.5 (0.9) | 0.009 |
| CRLB (%) GABA/Cr | 3.6 (1.0) | 3.1 (1.6) | n.s. | 3.2 (1.8) | 3.5 (1.6) | n.s. |
| CRLB (%) Glu | 2.7 (0.8) | 2.2 (0.9) | n.s. | 2.8 (1.1) | 2.7 (1.6) | n.s. |
| CRLB (%) NAA | 2.3 (0.6) | 1.8 (0.7) | 0.049 | 2.2 (1.0) | 1.9 (0.8) | n.s. |
| CRLB (%) Cr | 1.2 (0.3) | 1.0 (0.3) | n.s. | 1.3 (0.5) | 1.3 (0.6) | n.s. |
| CRLB (%) Cho | 2.0 (0.6) | 1.7 (0.5) | n.s. | 3.2 (1.4) | 3.4 (2.8) | n.s. |
The significance of bold values indicates level was set at 0.05.
Signal-to-noise ratios are based on non-apodized spectra.
2.3. Spectral fitting and quantification
Retrospective phase and frequency alignment was performed on all data sets of each measurement (Waddell et al., 2007). Fitting of the sLASER spectra was performed with LCModel-based software implemented in Matlab (De Graaf, 1999), which uses a priori knowledge of the spectral components to fit metabolite resonances (Govindaraju et al., 2000). A fifth-order polynomial baseline was used. The following 16 metabolites and a measured macromolecular baseline (Behar et al., 1994) were fitted to the spectra: acetate, aspartate, choline (Cho), phosphorylcholine (PC), glycerophosphorylcholine (GPC), phosphorylethanolamine (PE), creatine (Cr), phosphocreatine (PCr), N-acetyl aspartate (NAA), N-acetyl aspartyl glutamate (NAAG), GABA, Glu, glutamine (Gln), glutathione (GSH), myo-inositol (mIns), and taurine (Tau). Levels of Glu, total NAA (NAA + NAAG), total creatine (Cr + PCr) and total choline (Cho + PC + GPC + PE) were estimated using the water signal as an internal reference and calculated as follows (Gasparovic et al., 2009):
where [met] is the metabolite concentration, signalmet is the fitted signal intensity of the metabolite, accounting for the number of protons, and signalwater is the fitted signal intensity of water, accounting for the number of protons; volGM, volWM and volCSF are respectively the gray matter fraction, white matter fraction and cerebrospinal fluid (CSF) fraction in the voxel; and [waterGM], [waterWM], and [waterpure] are respectively the water concentration in gray matter, white matter or CSF. For determining the contribution of gray matter, white matter and CSF of each voxel, the software package SPM8 was used to segment the T1-weighted image. In the T1-weighted image, the position of the 1H-MRS voxel was determined, after which the amount of gray matter, white matter and CSF in the 1H-MRS voxel was computed. To account for differences in transverse relaxation between water and metabolites, a correction was applied based on reported T2 values at 7 T of 47 ms on average for water and 107 ms assumed for the metabolites (Marjańska et al., 2012). Statistical analysis of the gray and white matter fractions in the frontal and parieto-occipital MEGA-sLASER (GABA/Cr) and sLASER (glutamate, NAA, creatine, choline) revealed correlations >0.95 for both gray and white matter fractions in the two voxels.
Fitting of the MEGA-sLASER spectra was performed by frequency-domain fitting of the GABA and creatine resonances to a Lorentzian line-shape function in Matlab. GABA levels were expressed as the ratios of their peak areas relative to the peak areas of the creatine resonance.
Because of poor quality of the T1-weighted MP-RAGE sequence, in two healthy subjects the gray and white matter separation could not be estimated reliably in the frontal cortex, and in two healthy subjects the parieto-occipital cortex. For analyses with correction for gray and white matter fractions these subjects were not included in the analyses.
Because of poor spectral quality as established by a Cramér–Rao lower bound (CRLB) of more than 20% and visual inspection, some data were excluded from the study. Frontal sLASER spectra were excluded for three healthy controls and two patients; parieto-occipital sLASER spectra were excluded for three healthy subjects and one patient; frontal MEGA-sLASER spectra were excluded for four healthy subjects and three patients; and parieto-occipital MEGA-sLASER spectra were excluded for four healthy subjects and one patient. Spectra were mainly excluded because of poor shimming or technical issues. CRLBs of Glu, NAA, Cr and Cho never exceeded 20% and CRLBs of GABA/Cr exceeded 20% in only two instances.
Thus, frontal MRS results are based on 18 healthy subjects and 14 patients and parieto-occipital MRS results are based on 17 healthy subjects and 15 patients. Frontal GABA-edited MRS results are based on 19 healthy subjects and 13 patients and parieto-occipital GABA-edited MRS results are based on 19 healthy subjects and 15 patients.
2.4. Statistical analysis
Statistical analyses were performed using SPSS 21.0 (2012, Chicago, IL). Demographic characteristics were addressed for differences between the groups using Student's t-tests and χ2-tests. Data were checked for normality of their distributions. No transformations were required on any of the data. Multiple univariate analyses of variance were done with metabolite level as dependent variable and with group (schizophrenia patients, healthy controls), age, sex and gray and white matter fractions in the voxel as independent variables. In the case of a main significant effect for group, age-by-group, sex-by-group, intelligence, and intelligence-by-group were added separately to the model to assess interaction effects.
In patients, possible dependencies of metabolite concentrations depended on clinical symptomatology, or on current and cumulative antipsychotic medication intake were measured through post-hoc analyses.
3. Results
3.1. GABA
A significant main effect of group on the GABA/Cr ratio was found in the medial prefrontal cortex (F(1,24) = 7.33, p = 0.012), with the patients having lower GABA/Cr ratios as compared to the healthy controls (Table 3; Fig. 3A). This effect remained significant when corrections for gray and white matter fractions were removed from the analyses (thus adding the GABA/Cr ratio data from an additional two healthy subjects, with F(1,28) = 4.91, p = 0.035). There were no significant effects of age or age-by-group interaction on the GABA/Cr ratio in the prefrontal cortex.
Table 3.
Metabolite levels and gray and white matter fractions (mean (SD))a.
| Medial prefrontal cortex |
Medial parieto-occipital cortex |
|||||
|---|---|---|---|---|---|---|
| Patients | Controls | Statistic (F, p) | Patients | Controls | Statistic (F, p) | |
| GABA/Cr ratio | 0.12 (0.02) | 0.14 (0.03) | 7.33, 0.012 | 0.15 (0.04) | 0.14 (0.03) | 2.59, n.s. |
| Glutamate (mM) | 8.48 (1.34) | 8.65 (1.14) | 0.97, n.s. | 8.45 (1.07) | 8.48 (1.26) | 0.00, n.s. |
| NAA (mM) | 9.36 (1.23) | 9.85 (1.39) | 1.04, n.s. | 10.35 (1.26) | 10.85 (1.13) | 2.67, n.s. |
| Creatine (mM) | 8.35 (1.45) | 8.26 (1.43) | 0.08, n.s. | 8.48 (1.24) | 8.28 (1.25) | 0.13, n.s. |
| Choline (mM) | 5.02 (1.96) | 5.14 (1.51) | 0.49, n.s. | 3.48 (1.12) | 3.35 (1.23) | 0.00, n.s. |
| GM (%) sLASER | 72.1 (10.3) | 71.4 (13.6) | 0.47, n.s. | 72.1 (7.4) | 70.1 (12.1) | 1.79, n.s. |
| WM (%) sLASER | 12.9 (8.8) | 19.5 (14.9) | 2.29, n.s. | 22.1 (6.8) | 25.2 (13.9) | 4.37, n.s. |
| GM (%) MEGA-sLASER | 68.4 (9.5) | 68.1 (10.8) | 0.06, n.s. | 69.2 (7.8) | 68.0 (10.4) | 0.06, n.s. |
| WM (%) MEGA-sLASER | 18.5 (7.0) | 24.0 (11.2) | 1.46, n.s. | 24.5 (7.4) | 27.7 (12.2) | 1.20, n.s. |
The significance of bold values indicates level was set at 0.05.
Data are based on two separate 1H-MRS measurements each done in two brain areas (prefrontal and parieto-occipital). A MEGA-sLASER sequence was performed for assessment of GABA/Cr ratios and successfully completed in 13 patients and 19 controls in the medial prefrontal cortex and in 15 patients and 19 controls in the medial parieto-occipital cortex. A sLASER sequence was performed for assessment of glutamate, NAA, creatine, and choline levels (corrected for gray and white matter fractions in the voxel) and successfully completed in 14 patients and 18 controls in the medial prefrontal cortex and in 15 patients and 17 controls in the medial parieto-occipital cortex.
Fig. 3.
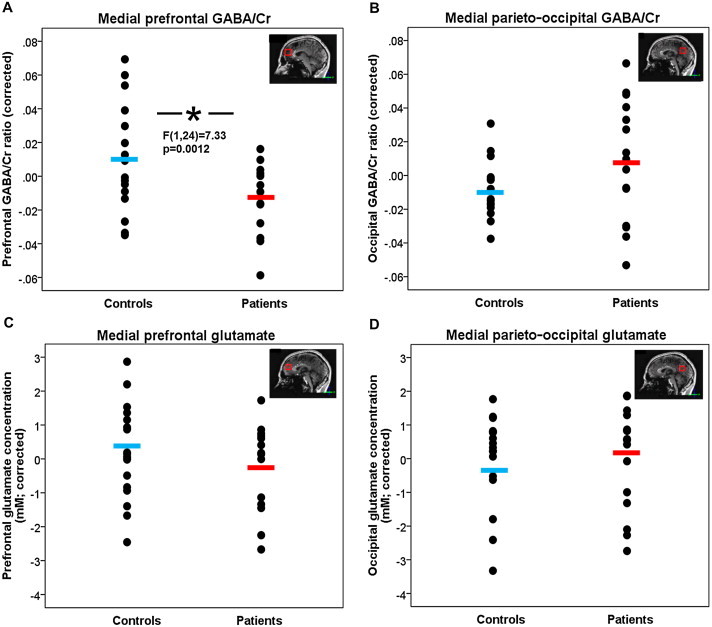
GABA/Cr ratios and glutamate concentrations in healthy controls and patients with schizophrenia. The blue (controls) and red (patients) bars indicate group averages. (A) Patients show significantly lower medial prefrontal GABA/Cr ratios as compared to healthy controls (F(1,24) = 7.33, p = 0.012), when correcting for age, sex, and gray and white matter fractions. (B) There is no significant difference in medial parieto-occipital GABA/Cr ratio between patients and controls (F(1,24) = 2.35, p = n.s.). (C) There is no significant difference in medial prefrontal glutamate concentration between patients and controls (F(1,26) = 0.97, p = n.s.). (D) There is no significant difference in medial parieto-occipital glutamate concentration between patients and controls (F(1,26) = 0.002, p = n.s.).
GABA/Cr ratio did not reveal significant differences between patients and controls in the parieto-occipital cortex (F(1,24) = 2.35, p = n.s.) (Fig. 3B). A significant main effect of age on the GABA/Cr ratio in the parieto-occipital cortex was found (F(1,24) = 7.88, p = 0.01), with older individuals having lower ratios, irrespective of disease.
In the parieto-occipital cortex a significant correlation was found between the GABA/Cr ratio and glutamate level in controls (r(10) = −0.56, p = 0.03), with higher GABA/Cr ratios being associated with lower levels of glutamate, an association not reaching significance inpatients (r(9) = −0.25, p = n.s.).
There were no significant effects for sex on GABA/Cr ratios in the frontal and parieto-occipital cortices.
3.2. Glutamate
In the medial prefrontal cortex these was no significant main effect of group on glutamate level (F(1,26) = 0.97, p = n.s.) (Table 3; Fig. 3C). There were significant main effects of age and sex on glutamate levels, with older individuals having lower levels than younger individuals (F(1,26) = 11.16, p = 0.003), and with higher glutamate levels in females as compared to males (F(1,26) = 4.64, p = 0.04), irrespective of disease.
Glutamate did not show any significant effects for group, age, and sex on glutamate level in the parieto-occipital cortex (Fig. 3D).
3.3. Other metabolites
No significant findings were revealed for any of the other metabolites, except for significant effects of age on prefrontal NAA levels (F(1,26) = 7.22, p = 0.01) and prefrontal creatine levels (F(1,26) = 5.21, p = 0.03), with lower levels being found in older individuals, irrespective of disease; and for a significant effect of sex on parieto-occipital NAA levels with higher levels in females than in males (F(1,26) = 6.18, p = 0.02), irrespective of disease.
3.4. Associations with intelligence
GABA/Cr ratio showed a significant interaction effect of intelligence-by-group in the prefrontal cortex (F(1,20) = 4.77, p = 0.04), when intelligence and intelligence-by-group interaction were added to the model. This effect remained significant when corrections for gray and white matter fractions were removed from the analyses (adding the GABA/Cr ratio data from an additional one healthy subject) with F(1,23) = 4.79, p = 0.039. This interaction effect was due to patients with a higher intelligence level having a lower GABA/Cr ratio (r = −0.92, p < 0.001) (Fig. 4), whereas in healthy individuals no significant association between intelligence level and GABA/Cr was found. In patients, the correlation between higher level of intelligence and lower GABA/Cr ratio was found for all aspects of intelligence but was most prominently reflected in performance IQ (r = −0.89, p < 0.001), followed by working memory index (r = −0.76, p = 0.02), verbal IQ (r = −0.74, p = 0.02), perceptual reasoning index (r = −0.72, p = 0.03), and verbal comprehension index (r = −0.70, p = 0.04).
Fig. 4.

Medial prefrontal GABA/Cr ratios in patients with schizophrenia significantly decrease with increasing total IQ, when correcting for age, sex, and gray and white matter fractions. (r = −0.91, p = 0.001).
3.5. Associations with symptomatology, medication intake and substance use
Post-hoc analyses revealed that parieto-occipital glutamate (r = −0.85, p = 0.003), parieto-occipital NAA (r = −0.84, p = 0.005), and parieto-occipital choline (r = −0.79, p = 0.012) levels were negatively correlated with the severity of negative symptoms.
No significant associations between any of the metabolite levels in the prefrontal and parieto-occipital cortices with current or cumulative dosage of classical or atypical antipsychotic medication were found. Also, no significant associations were found between metabolite levels and benzodiazepine use.
Smoking status, alcohol use in the past month, and cannabis use in the past month could be retrieved in 34 individuals (85%). 7 (41%) patients and 2 (9%) healthy subjects were smokers. Smoking did not alter the findings when added as a covariate to the significant analyses. 7 (41%) patients and 13 (57%) healthy subjects consumed alcohol in the past month. Alcohol use did not alter the significant findings when added to the analyses as a covariate. Cannabis was used in the past month by 2 (9%) patients and were not used by any of the healthy subjects. Cannabis use did not alter the findings when added as a covariate in the significant analyses.
4. Discussion
To our knowledge, this study presents the first proton magnetic resonance spectroscopy (MRS) measurements of GABA and glutamate levels in vivo in the brains of patients with schizophrenia at a magnetic field strength of 7 T. The main finding is a significantly lower GABA/Cr ratio in the prefrontal cortex in patients with schizophrenia as compared to healthy controls. In addition, the lower prefrontal GABA/Cr ratios were associated with higher levels of general cognitive functioning in the patients. No significant difference in the GABA/Cr ratio was found between patients and controls in the parieto-occipital cortex. Also, no significant differences in glutamate, NAA, creatine, and choline, were found in patients and controls in the prefrontal and parieto-occipital cortices.
The main finding of this study is a significantly lower GABA/Cr ratio in the prefrontal cortex in patients as compared to healthy controls based on a GABA dedicated MRS sequence operating at 7 T. Our finding is consistent with postmortem studies in schizophrenia, suggesting diminished GABA production based on decreased levels of mRNA encoding for GAD67 (Olney et al., 1999; Kondziella et al., 2007; Stone et al., 2009; Lisman et al., 2008) — the enzyme that facilitates GABA synthesis from glutamate, decreased levels of mRNA encoding for GAT-1 (De la Fuente-Sandoval et al., 2011; Goto et al., 2009) – the transporter that removes GABA from the synaptic cleft – and increased expression of the α2 subunits of the GABAA receptor — the major inhibitory receptor in the brain mediating most of the physiological actions of GABA (Sieghart et al., 1999). Moreover, the finding of lower GABA/Cr ratios in patients agrees with the hypothesis that NMDA-receptor hypofunction reduces the excitation of GABAergic interneurons (Kondziella et al., 2007; Stone et al., 2009). However, we found an inverse correlation between GABA/Cr ratios and glutamate levels in the parieto-occipital cortex in healthy controls but not in patients. Considering the tight coupling of GABA and glutamate through GAD, this is unexpected and contrasts with previous studies reporting positive correlations between GABA and glutamate in patients in the anterior cingulate and parieto-occipital cortices (Ongür et al., 2010) and in a mixed sample of patients and healthy controls in the prefrontal cortex (Kegeles et al., 2012).
Interestingly, we find the decrease in GABA/Cr ratios in patients with schizophrenia to be associated with a higher level of general cognitive functioning. In patients, the association between higher general level of intelligence and lower GABA/Cr ratio was found for all aspects of intelligence. Since we find an association between GABA and intelligence in the patients and not in the healthy controls, it could reflect a compensatory mechanism to (continue) functioning at an (above) average level. When separated out for several aspects of IQ, the decreased GABA/Cr ratio in patients was associated with performance IQ, followed by higher working memory functioning, perceptual reasoning, and verbal comprehension (all ≥0.70). The medial prefrontal cortex serves as a hub in (performance) IQ as part of the brain's functional network (Van den Heuvel et al., 2009). Moreover, this brain area revealed disruption of brain connectivity in schizophrenia, as one of the brain's hub areas potentially leading to a reduced communication capacity and altered functional brain dynamics (Van den Heuvel et al., 2013). As observed in many earlier studies, we also found a lower intelligence level in patients with schizophrenia, which possibly exists prior to the disease onset (Hedman et al., 2013) and is associated with genetic risk for schizophrenia (Toulopoulou et al., 2007), thus confirming contributions from the medial prefrontal cortex to both schizophrenia and intelligence. However, the inverse correlation between GABA and intelligence contrasts with findings that GABA deficits occur as part of the impairment of schizophrenia (Enomoto et al., 2011; Menzies et al., 2007). An alternative explanation might be that patients with a higher IQ are more adherent to treatment, which may lower GABA/Cr ratios to a greater extent. Although there were no correlations found between GABA/Cr ratios and medication intake in this study, a previous study reports an inverse correlation between GABA levels and antipsychotic medication intake (Tayoshi et al., 2010).
We found no significant changes in glutamate levels in patients with schizophrenia as compared to healthy controls based on 1H-MRS at 7 T. This is consistent with a recent large study in which no changes in glutamate levels were found in schizophrenia (Bustillo et al., 2014). A recent meta-analysis showed an overall reduction of frontal glutamate levels in patients as compared to healthy controls (Fonnum, 1984). However, in that study it was also suggested that glutamate levels are increased in the early stage of the disease and begin to decrease below control levels around the age of 25 years when most patients have been ill for a few years. Moreover, another meta-analysis suggested that glutamatergic levels are elevated in medication-naïve and medication free patients (Poels et al., 2014). Since the average age of the schizophrenia patients in this study is 27.6 years with an average illness duration of 77 months (Table 2), it is possible that glutamate levels in these patients are approaching control levels because of their disease stage. Other levels of brain metabolites, including those of prefrontal and parieto-occipital NAA, a marker of neuronal integrity, and of creatine, a marker of energy metabolism, did not differ significantly between patients and healthy controls. Although meta-analyses showed reduced NAA levels in patients with schizophrenia in the frontal lobe (Steen et al., 2005), most of the studies that were included in these meta-analyses were in patients who had been ill for many years (Hulshoff Pol and Kahn, 2008; Harrison, 1999; Steen et al., 2005; Brugger et al., 2011; Kraguljac et al., 2012). We did find that parieto-occipital glutamate, NAA and choline were negatively correlated with negative symptom severity. An inverse relationship between negative symptoms and NAA has been reported before (Brugger et al., 2011). The correlation between glutamate and negative symptoms agrees with previous findings of correlations between negative symptoms and measures of abnormal glutamatergic neurotransmission (Pilowsky et al., 2006; Szulc et al., 2005). Moreover, NAA and glutamatergic neurotransmission are probably closely related (Reynolds and Harte, 2007).
Antipsychotic medication may alter metabolite levels in the brain (McLoughlin et al., 2009); including reductions in GABA and Glx (the sum of glutamate and glutamine) levels in the medial prefrontal cortex (Kegeles et al., 2012). However, antipsychotic use and metabolite levels did not reveal significant associations in our study. The intake of benzodiazepines may increase GABA levels, since benzodiazepines are GABAA receptor agonists (Sieghart and Sperk, 2002) (but see Goddard et al., 2004 for a decrease in GABA levels by down-modulation of GAD function and gene expression). Two-thirds of the patients had used benzodiazepines since they had become ill and one-third of the patients were currently taking benzodiazepines. However, we found no significant associations with cumulative or current intake, although we did observe that patients that were currently taking benzodiazepines had (non-significantly) higher GABA/Cr ratios compared to those who did not. Thus, it seems unlikely that medication intake explained our finding of decreased GABA/Cr ratio in the frontal cortex in patients. This is however in contrast with a previous study which found a negative correlation between frontal GABA and antipsychotic medication intake (Tayoshi et al., 2010).
Irrespective of disease and with increasing age, we find significantly lower parieto-occipital GABA and prefrontal glutamate, NAA and creatine levels in the current 7 T 1H-MRS study. Parieto-occipital but not frontal GABA levels decreased with increasing age in these relatively young adult individuals, whereas for all the other metabolites the frontal but not parieto-occipital levels were lower with older age. Possibly high levels of the inhibitory neurotransmitter GABA are still important for development and plasticity of the prefrontal cortex in young adulthood (Ben-Ari et al., 2007). Decreases in glutamate level with age are consistent with previous studies (Marsman et al., 2013a;2013b) and may be associated with age-dependent neuronal pruning (Marsman et al., 2013b; Segovia et al., 2001). Lower NAA levels with increasing age have been reported before (Angelie et al., 2001; Raininko and Mattsson, 2010; Sailasuta et al., 2008) and may reflect a reduction of brain volume (Raininko and Mattsson, 2010) or neuronal function. A lower creatine level with increasing age may be a sign of maturation of neural systems in the brain (Steen et al., 2005). More likely, the decreasing levels reflect different aspects of neural system integrity and energy. However, there have been reports on increased creatine and choline levels with age in healthy subjects and increased Gln/Glu ratios and choline levels in schizophrenia patients (Bustillo et al., 2014; Maudsley et al., 2009). Thus, overall there were significant lower levels of all metabolites with older age, particularly in the prefrontal and not in the parieto-occipital cortex, with the exception of GABA which had lower levels in the parieto-occipital but not prefrontal cortex with increasing age. We found no significant differences in the extent of decline with age in patients with schizophrenia as compared to controls, although some levels (NAA) did seem to decline disproportionally in the patients.
Irrespective of disease, significant differences between the sexes were found in prefrontal glutamate and parieto-occipital NAA levels, with males having lower levels as compared to females. We did not find any differential findings for males and females in patients as compared to controls. Thus, GABA/Cr differences between patients and controls could not be explained by differences between the sexes.
Although there were no significant associations found between medication use and metabolite levels, a limitation of this study is the lack of control for medication use during the lifespan. Also, this study has a rather small sample size. Substance use, in particular smoking (Gallinat et al., 2007), has been found to affect neurometabolite levels. Therefore, in a post-hoc analysis we added smoking, alcohol and cannabis intake as a covariate. Smoking, alcohol and cannabis intake did not alter the findings. In vivo MRS measurements have some limitations to take into account. One, with MRS one cannot distinguish between intracellular and extracellular metabolite levels. Two, because of its low concentration a large voxel size is needed to reliably and time-efficiently measure GABA. Hence the voxel contained both gray and white matter. However, the gray and white matter fractions in the individual voxels were controlled for in the analyses making a large influence on the findings unlikely. The findings did not alter considerably when leaving out the corrections for gray and white matter fractions from the analyses. Three, the creatine peak that is derived from the MEGA-sLASER sequence to calculate the GABA/Cr ratio, contains contributions of GABA and macromolecules that were not accounted for since it is difficult to determine the relative contribution of macromolecules. However, the contributions of GABA and macromolecules to the creatine peak are relatively small. Unlike the water signal, the creatine signal is obtained at exactly the same time as the GABA signal, so in the presence of subtle instability artifacts. Also, because of the long TE in the MEGA-sLASER sequence, the water signal is partially decayed due to T2 relaxation. The creatine signal is also partially decayed due to T2 relaxation, but this effect is smaller compared to the effect T2 relaxation has on the water signal. Moreover, the T2 relaxation of water differs between white matter, gray matter and CSF, thus it is more difficult to calculate a correction factor because fractions of white matter, gray matter and CSF differ among individuals. For the data to be as accurate as possible, creatine was used as a reference instead of water. Although there were no differences in creatine levels found between patients and healthy controls in this study, one study does report changes in creatine levels in schizophrenia (Ongür et al., 2009).
Despite the use of the sensitivity optimized sLASER technique, in some of the spectra glutamine and NAAG, which are important components in glutamatergic metabolism, could not be assessed accurately. While the relatively short scan time could have been increased to improve SNR, our current study shows that in 9% of the spectra the CRLB for glutamine was above 20% and 53% the CRLB for NAAG was above 20%.
In conclusion, using 1H-MRS at 7 T, prefrontal GABA/Cr ratios appear to be decreased in medicated patients with schizophrenia as compared to healthy controls, in contrast to previously reported elevations in unmedicated patients. Moreover, GABA/Cr ratios are associated with the level of cognitive functioning, with high functioning patients having lower GABA/Cr ratios. This suggests a role for GABA in the earlier stages of the disease in schizophrenia, and replication studies are needed to assess the effects of antipsychotic medication use, aging, and symptomatology.
Conflict of interest
All authors declare that they have no conflicts of interest.
Funding
This research was funded by the Netherlands Organisation for Scientific Research (NWO) VIDI Grant 917-46-370 (to H.H.); and Utrecht University High Potential Grant (to H.H.).
References
- Hulshoff Pol H.E., Kahn R.S. What happens after the first episode? A review of progressive brain changes in chronically ill patients with schizophrenia. Schizophrenia Bulletin. 2008;34(2):354–366. doi: 10.1093/schbul/sbm168. 18283048 [DOI] [PMC free article] [PubMed] [Google Scholar]
- Harrison P.J. The neuropathology of schizophrenia. A critical review of the data and their interpretation. Brain: A Journal of Neurology. 1999;122(4):593–624. doi: 10.1093/brain/122.4.593. 10219775 [DOI] [PubMed] [Google Scholar]
- Harrison P.J., Weinberger D.R. Schizophrenia genes, gene expression, and neuropathology: on the matter of their convergence. Molecular Psychiatry. 2005;10(1):40–68. doi: 10.1038/sj.mp.4001558. 15263907 [DOI] [PubMed] [Google Scholar]
- Kraguljac N.V., White D.M., Reid M.A., Lahti A.C. Increased hippocampal glutamate and volumetric deficits in unmedicated patients with schizophrenia. JAMA Psychiatry. 2013;70(12):1294–1302. doi: 10.1001/jamapsychiatry.2013.2437. 24108440 [DOI] [PMC free article] [PubMed] [Google Scholar]
- Fonnum F. Glutamate: a neurotransmitter in mammalian brain. Journal of Neurochemistry. 1984;42(1):1–11. doi: 10.1111/j.1471-4159.1984.tb09689.x. 6139418 [DOI] [PubMed] [Google Scholar]
- Marsman A., van den Heuvel M.P., Klomp D.W.J., Kahn R.S., Luijten P.R., Hulshoff Pol H.E. Glutamate in schizophrenia: a focused review and meta-analysis of 1H-MRS studies. Schizophrenia Bulletin. 2013;39(1):120–129. doi: 10.1093/schbul/sbr069. 21746807 [DOI] [PMC free article] [PubMed] [Google Scholar]
- Poels E.M.P., Kegeles L.S., Kantrowitz J.T., Javitt D.C., Lieberman J.A., Abi-Dargham A., Girgis R.R. Glutamatergic abnormalities in schizophrenia: a review of proton MRS findings. Schizophrenia Research. 2014;152(2-3):325–332. doi: 10.1016/j.schres.2013.12.013. 24418122 [DOI] [PMC free article] [PubMed] [Google Scholar]
- Moghaddam B., Adams B., Verma A., Daly D. Activation of glutamatergic neurotransmission by ketamine: a novel step in the pathway from NMDA receptor blockade to dopaminergic and cognitive disruptions associated with the prefrontal cortex. Journal of Neuroscience: the Official Journal of the Society for Neuroscience. 1997;17(8):2921–2927. doi: 10.1523/JNEUROSCI.17-08-02921.1997. 9092613 [DOI] [PMC free article] [PubMed] [Google Scholar]
- De la Fuente-Sandoval C., León-Ortiz P., Azcárraga M., Stephano S., Favila R., Díaz-Galvis L., Alvarado-Alanis P., Ramírez-Bermúdez J., Graff-Guerrero A. Glutamate levels in the associative striatum before and after 4 weeks of antipsychotic treatment in first-episode psychosis: a longitudinal proton magnetic resonance spectroscopy study. JAMA Psychiatry. 2013;70(10):1057–1066. doi: 10.1001/jamapsychiatry.2013.289. 23966023 [DOI] [PMC free article] [PubMed] [Google Scholar]
- Kegeles L.S., Mao X., Stanford A.D., Girgis R., Ojeil N., Xu X., Gil R., Slifstein M., Abi-Dargham A., Lisanby S.H., Shungu D.C. Elevated prefrontal cortex {gamma}-aminobutyric acid and glutamate–glutamine levels in schizophrenia measured in vivo with proton magnetic resonance spectroscopy. Archives of General Psychiatry. 2012;69(5):449–459. doi: 10.1001/archgenpsychiatry.2011.1519. 22213769 [DOI] [PubMed] [Google Scholar]
- Olney J.W., Newcomer J.W., Farber N.B. NMDA receptor hypofunction model of schizophrenia. Journal of Psychiatric Research. 1999;33(6):523–533. doi: 10.1016/s0022-3956(99)00029-1. 10628529 [DOI] [PubMed] [Google Scholar]
- Kondziella D., Brenner E., Eyjolfsson E.M., Sonnewald U. How do glial–neuronal interactions fit into current neurotransmitter hypotheses of schizophrenia? Neurochemistry International. 2007;50(2):291–301. doi: 10.1016/j.neuint.2006.09.006. 17084946 [DOI] [PubMed] [Google Scholar]
- Stone J.M., Day F., Tsagaraki H., Valli I., McLean M.A., Lythgoe D.J., O'Gorman R.L., Barker G.J., McGuire P.K. Glutamate dysfunction in people with prodromal symptoms of psychosis: relationship to gray matter volume. Biological Psychiatry. 2009;66(6):533–539. doi: 10.1016/j.biopsych.2009.05.006. 19559402 [DOI] [PubMed] [Google Scholar]
- Lisman J.E., Coyle J.T., Green R.W., Javitt D.C., Benes F.M., Heckers S., Grace A.A. Circuit-based framework for understanding neurotransmitter and risk gene interactions in schizophrenia. Trends in Neurosciences. 2008;31(5):234–242. doi: 10.1016/j.tins.2008.02.005. 18395805 [DOI] [PMC free article] [PubMed] [Google Scholar]
- Lewis D.A., Moghaddam B. Cognitive dysfunction in schizophrenia: convergence of {gamma}-aminobutyric acid and glutamate alterations. Archives of Neurology. 2006;63(10):1372–1376. doi: 10.1001/archneur.63.10.1372. 17030651 [DOI] [PubMed] [Google Scholar]
- Benes F.M., Berretta S. GABAergic interneurons: implications for understanding schizophrenia and bipolar disorder. Neuropsychopharmacology: Official Publication of the American College of Neuropsychopharmacology. 2001;25(1):1–27. doi: 10.1016/S0893-133X(01)00225-1. 11377916 [DOI] [PubMed] [Google Scholar]
- Lewis D.A., Volk D.W., Hashimoto T. Selective alterations in prefrontal cortical GABA neurotransmission in schizophrenia: a novel target for the treatment of working memory dysfunction. Psychopharmacology. 2004;174(1):143–150. doi: 10.1007/s00213-003-1673-x. 15205885 [DOI] [PubMed] [Google Scholar]
- Coyle J.T. The GABA–glutamate connection in schizophrenia: which is the proximate cause? Biochemical Pharmacology. 2004;68(8):1507–1514. doi: 10.1016/j.bcp.2004.07.034. 15451393 [DOI] [PubMed] [Google Scholar]
- De la Fuente-Sandoval C., León-Ortiz P., Favila R., Stephano S., Mamo D., Ramírez-Bermúdez J., Graff-Guerrero A. Higher levels of glutamate in the associative-striatum of subjects with prodromal symptoms of schizophrenia and patients with first-episode psychosis. Neuropsychopharmacology: Official Publication of the American College of Neuropsychopharmacology. 2011;36(9):1781–1791. doi: 10.1038/npp.2011.65. 21508933 [DOI] [PMC free article] [PubMed] [Google Scholar]
- Goto N., Yoshimura R., Moriya J., Kakeda S., Ueda N., Ikenouchi-Sugita A., Umene-Nakano W., Hayashi K., Oonari N., Korogi Y. Reduction of brain gamma-aminobutyric acid (GABA) concentrations in early-stage schizophrenia patients: 3 T Proton MRS study. Schizophrenia Research. 2009;112(1–3):192–193. doi: 10.1016/j.schres.2009.04.026. 19464152 [DOI] [PubMed] [Google Scholar]
- Ongür D., Prescot A.P., McCarthy J., Cohen B.M., Renshaw P.F. Elevated gamma-aminobutyric acid levels in chronic schizophrenia. Biological Psychiatry. 2010;68(7):667–670. doi: 10.1016/j.biopsych.2010.05.016. 20598290 [DOI] [PMC free article] [PubMed] [Google Scholar]
- Tayoshi S., Nakataki M., Sumitani S., Taniguchi K., Shibuya-Tayoshi S., Numata S., Iga J., Ueno S., Harada M., Ohmori T. GABA concentration in schizophrenia patients and the effects of antipsychotic medication: a proton magnetic resonance spectroscopy study. Schizophrenia Research. 2010;117(1):83–91. doi: 10.1016/j.schres.2009.11.011. 20022731 [DOI] [PubMed] [Google Scholar]
- Yoon J.H., Maddock R.J., Rokem A., Silver M.A., Minzenberg M.J., Ragland J.D., Carter C.S. GABA concentration is reduced in visual cortex in schizophrenia and correlates with orientation-specific surround suppression. Journal of Neuroscience: the Official Journal of the Society for Neuroscience. 2010;30(10):3777–3781. doi: 10.1523/JNEUROSCI.6158-09.2010. 20220012 [DOI] [PMC free article] [PubMed] [Google Scholar]
- Rowland L.M., Kontson K., West J., Edden R.A., Zhu H., Wijtenburg S.A., Holcomb H.H., Barker P.B. In vivo measurements of glutamate, GABA, and NAAG in schizophrenia. Schizophrenia Bulletin. 2013;39(5):1096–1104. doi: 10.1093/schbul/sbs092. 23081992 [DOI] [PMC free article] [PubMed] [Google Scholar]
- Tkác I., Andersen P., Adriany G., Merkle H., Ugurbil K., Gruetter R. In vivo 1H NMR spectroscopy of the human brain at 7 T. Magnetic Resonance in Medicine: Official Journal of the Society of Magnetic Resonance in Medicine / Society of Magnetic Resonance in Medicine. 2001;46(3):451–456. doi: 10.1002/mrm.1213. 11550235 [DOI] [PubMed] [Google Scholar]
- Boer V.O., van Lier A.L., Hoogduin J.M., Wijnen J.P., Luijten P.R., Klomp D.W. 7-T (1) H MRS with adiabatic refocusing at short TE using radiofrequency focusing with a dual-channel volume transmit coil. NMR in Biomedicine. 2011;24(9):1038–1046. doi: 10.1002/nbm.1641. 21294206 [DOI] [PubMed] [Google Scholar]
- Andreychenko A., Boer V.O., Arteaga de Castro C.S., Luijten P.R., Klomp D.W. Efficient spectral editing at 7 T: GABA detection with MEGA-sLASER. Magnetic Resonance in Medicine: Official Journal of the Society of Magnetic Resonance in Medicine / Society of Magnetic Resonance in Medicine. 2012;68(4):1018–1025. doi: 10.1002/mrm.24131. 22213204 [DOI] [PubMed] [Google Scholar]
- Marsman A., Boer V.O., Luijten P.R., Hulshoff Pol H.E., Klomp D.W.J., Mandl R.C.W. Detection of glutamate alterations in the human brain using 1H-MRS with sLASER at 7 T (submitted) [DOI] [PMC free article] [PubMed]
- Puts N.A., Edden R.A. In vivo magnetic resonance spectroscopy of GABA: a methodological review. Progress in Nuclear Magnetic Resonance Spectroscopy. 2012;60:29–41. doi: 10.1016/j.pnmrs.2011.06.001. 22293397 [DOI] [PMC free article] [PubMed] [Google Scholar]
- Haijma S.V., Van Haren N., Cahn W., Koolschijn P.C.M.P., Hulshoff Pol H.E., Kahn R.S. Brain volumes in schizophrenia: a meta-analysis in over 18 000 subjects. Schizophrenia Bulletin. 2013;39(5):1129–1138. doi: 10.1093/schbul/sbs118. 23042112 [DOI] [PMC free article] [PubMed] [Google Scholar]
- Andreasen N.C., Flaum M., Arndt S. The comprehensive assessment of symptoms and history (CASH). An instrument for assessing diagnosis and psychopathology. Archives of General Psychiatry. 1992;49(8):615–623. doi: 10.1001/archpsyc.1992.01820080023004. 1637251 [DOI] [PubMed] [Google Scholar]
- Kay S.R., Fiszbein A., Opler L.A. The positive and negative syndrome scale (PANSS) for schizophrenia. Schizophrenia Bulletin. 1987;13(2):261–276. doi: 10.1093/schbul/13.2.261. 3616518 [DOI] [PubMed] [Google Scholar]
- Andreasen N.C., Pressler M., Nopoulos P., Miller D., Ho B.C. Antipsychotic dose equivalents and dose–years: a standardized method for comparing exposure to different drugs. Biological Psychiatry. 2010;67(3):255–262. doi: 10.1016/j.biopsych.2009.08.040. 19897178 [DOI] [PMC free article] [PubMed] [Google Scholar]
- Wechsler D. Wechsler adult intelligence scale. 3rd ed (1997). Lisse, The Netherlands. [Dutch version (2005)].
- Gruetter R. Automatic, localized in vivo adjustment of all first- and second-order shim coils. Magnetic Resonance in Medicine: Official Journal of the Society of Magnetic Resonance in Medicine / Society of Magnetic Resonance in Medicine. 1993;29(6):804–811. doi: 10.1002/mrm.1910290613. 8350724 [DOI] [PubMed] [Google Scholar]
- Gruetter R., Boesch C. Fast, non-iterative shimming on spatially localized signals: in vivo analysis of the magnetic field along axes. Journal of Magnetic Resonance. 1992;96:323–334. [Google Scholar]
- Versluis M.J., Kan H.E., van Buchem M.A., Webb A.G. Improved signal to noise in proton spectroscopy of the human calf muscle at 7 T using localized B1 calibration. Magnetic Resonance in Medicine: Official Journal of the Society of Magnetic Resonance in Medicine / Society of Magnetic Resonance in Medicine. 2010;63(1):207–211. doi: 10.1002/mrm.22195. 19918906 [DOI] [PubMed] [Google Scholar]
- Waddell K.W., Avison M.J., Joers J.M., Gore J.C. A practical guide to robust detection of GABA in human brain by J-difference spectroscopy at 3 T using a standard volume coil. Magnetic Resonance Imaging. 2007;25(7):1032–1038. doi: 10.1016/j.mri.2006.11.026. 17707165 [DOI] [PMC free article] [PubMed] [Google Scholar]
- De Graaf R.A. NMR Processing Software for Spectroscopy, Imaging and Spectroscopic Imaging. 1999. [Google Scholar]
- Govindaraju V., Young K., Maudsley A.A. Proton NMR chemical shifts and coupling constants for brain metabolites. NMR in Biomedicine. 2000;13(3):129–153. doi: 10.1002/1099-1492(200005)13:3<129::aid-nbm619>3.0.co;2-v. 10861994 [DOI] [PubMed] [Google Scholar]
- Behar K.L., Rothman D.L., Spencer D.D., Petroff O.A. Analysis of macromolecule resonances in 1H NMR spectra of human brain. Magnetic Resonance in Medicine: Official Journal of the Society of Magnetic Resonance in Medicine / Society of Magnetic Resonance in Medicine. 1994;32(3):294–302. doi: 10.1002/mrm.1910320304. 7984061 [DOI] [PubMed] [Google Scholar]
- Gasparovic C., Yeo R., Mannell M., Ling J., Elgie R., Phillips J., Doezema D., Mayer A.R. Neurometabolite concentrations in gray and white matter in mild traumatic brain injury: an 1H-magnetic resonance spectroscopy study. Journal of Neurotrauma. 2009;26(10):1635–1643. doi: 10.1089/neu.2009.0896. 19355814 [DOI] [PMC free article] [PubMed] [Google Scholar]
- Marjańska M., Auerbach E.J., Valabrègue R., Van de Moortele P.F., Adriany G., Garwood M. Localized 1H NMR spectroscopy in different regions of human brain in vivo at 7 T: T2 relaxation times and concentrations of cerebral metabolites. NMR in Biomedicine. 2012;25(2):332–339. doi: 10.1002/nbm.1754. 21796710 [DOI] [PMC free article] [PubMed] [Google Scholar]
- Sieghart W., Fuchs K., Tretter V., Ebert V., Jechlinger M., Höger H., Adamiker D. Structure and subunit composition of GABA(A) receptors. Neurochemistry International. 1999;34(5):379–385. doi: 10.1016/s0197-0186(99)00045-5. 10397365 [DOI] [PubMed] [Google Scholar]
- Van den Heuvel M.P., Stam C.J., Kahn R.S., Hulshoff Pol H.E. Efficiency of functional brain networks and intellectual performance. Journal of Neuroscience: the Official Journal of the Society for Neuroscience. 2009;29(23):7619–7624. doi: 10.1523/JNEUROSCI.1443-09.2009. 19515930 [DOI] [PMC free article] [PubMed] [Google Scholar]
- Van den Heuvel M.P., Sporns O., Collin G., Scheewe T., Mandl R.C., Cahn W., Goñi J., Hulshoff Pol H.E., Kahn R.S. Abnormal rich club organization and functional brain dynamics in schizophrenia. JAMA Psychiatry. 2013;70(8):783–792. doi: 10.1001/jamapsychiatry.2013.1328. 23739835 [DOI] [PubMed] [Google Scholar]
- Hedman A.M., van Haren N.E., van Baal C.G., Kahn R.S., Hulshoff Pol H.E. IQ change over time in schizophrenia and healthy individuals: a meta-analysis. Schizophrenia Research. 2013;146(1–3):201–208. doi: 10.1016/j.schres.2013.01.027. 23490758 [DOI] [PubMed] [Google Scholar]
- Toulopoulou T., Picchioni M., Rijsdijk F., Hua-Hall M., Ettinger U., Sham P., Murray R. Substantial genetic overlap between neurocognition and schizophrenia: genetic modeling in twin samples. Archives of General Psychiatry. 2007;64(12):1348–1355. doi: 10.1001/archpsyc.64.12.1348. 18056542 [DOI] [PubMed] [Google Scholar]
- Enomoto T., Tse M.T., Floresco S.B. Reducing prefrontal gamma-aminobutyric acid activity induces cognitive, behavioral, and dopaminergic abnormalities that resemble schizophrenia. Biological Psychiatry. 2011;69(5):432–441. doi: 10.1016/j.biopsych.2010.09.038. 21146155 [DOI] [PubMed] [Google Scholar]
- Menzies L., Ooi C., Kamath S., Suckling J., McKenna P., Fletcher P., Bullmore E., Stephenson C. Effects of gamma-aminobutyric acid-modulating drugs on working memory and brain function in patients with schizophrenia. Archives of General Psychiatry. 2007;64(2):156–167. doi: 10.1001/archpsyc.64.2.156. 17283283 [DOI] [PubMed] [Google Scholar]
- Bustillo J.R., Chen H., Jones T., Lemke N., Abbott C., Qualls C., Canive J., Gasparovic C. Increased glutamine in patients undergoing long-term treatment for schizophrenia: a proton magnetic resonance spectroscopy study at 3 T. JAMA Psychiatry. 2014;71(3):265–272. doi: 10.1001/jamapsychiatry.2013.3939. 24402128 [DOI] [PMC free article] [PubMed] [Google Scholar]
- Steen R.G., Hamer R.M., Lieberman J.A. Measurement of brain metabolites by 1H magnetic resonance spectroscopy in patients with schizophrenia: a systematic review and meta-analysis. Neuropsychopharmacology: Official Publication of the American College of Neuropsychopharmacology. 2005;30(11):1949–1962. doi: 10.1038/sj.npp.1300850. 16123764 [DOI] [PubMed] [Google Scholar]
- Brugger S., Davis J.M., Leucht S., Stone J.M. Proton magnetic resonance spectroscopy and illness stage in schizophrenia — a systematic review and meta-analysis. Biological Psychiatry. 2011;69(5):495–503. doi: 10.1016/j.biopsych.2010.10.004. 21145039 [DOI] [PubMed] [Google Scholar]
- Kraguljac N.V., Reid M., White D., Jones R., Den Hollander J., Lowman D., Lahti A.C. Neurometabolites in schizophrenia and bipolar disorder — a systematic review and meta-analysis. Psychiatry Research. 2012;203(2-3):111–125. doi: 10.1016/j.pscychresns.2012.02.003. 22981426 [DOI] [PMC free article] [PubMed] [Google Scholar]
- Pilowsky L.S., Bressan R.A., Stone J.M., Erlandsson K., Mulligan R.S., Krystal J.H., Ell P.J. First in vivo evidence of an NMDA receptor deficit in medication-free schizophrenic patients. Molecular Psychiatry. 2006;11(2):118–119. doi: 10.1038/sj.mp.4001751. 16189506 [DOI] [PubMed] [Google Scholar]
- Szulc A., Galinska B., Tarasow E., Dzienis W., Kubas B., Konarzewska B., Walecki J., Alathiaki A.S., Czernikiewicz A. The effect of risperidone on metabolite measures in the frontal lobe, temporal lobe, and thalamus in schizophrenic patients. A proton magnetic resonance spectroscopy (1H MRS) Pharmacopsychiatry. 2005;38(5):214–219. doi: 10.1055/s-2005-873156. 16189748 [DOI] [PubMed] [Google Scholar]
- Reynolds G.P., Harte M.K. The neuronal pathology of schizophrenia: molecules and mechanisms. Biochemical Society Transactions. 2007;35(2):433–436. doi: 10.1042/BST0350433. 17371293 [DOI] [PubMed] [Google Scholar]
- McLoughlin G.A., Ma D., Tsang T.M., Jones D.N., Cilia J., Hill M.D., Robbins M.J., Benzel I.M., Maycox P.R., Holmes E., Bahn S. Analyzing the effects of psychotropic drugs on metabolite profiles in rat brain using 1H NMR spectroscopy. Journal of Proteome Research. 2009;8(4):1943–1952. doi: 10.1021/pr800892u. 19714815 [DOI] [PubMed] [Google Scholar]
- Sieghart W., Sperk G. Subunit composition, distribution and function of GABA(A) receptor subtypes. Current Topics in Medicinal Chemistry. 2002;2(8):795–816. doi: 10.2174/1568026023393507. 12171572 [DOI] [PubMed] [Google Scholar]
- Goddard A.W., Mason G.F., Appel M., Rothman D.L., Gueorguieva R., Behar K.L., Krystal J.H. Impaired GABA neuronal response to acute benzodiazepine administration in panic disorder. American Journal of Psychiatry. 2004;161(12):2186–2193. doi: 10.1176/appi.ajp.161.12.2186. 15569888 [DOI] [PubMed] [Google Scholar]
- Ben-Ari Y., Gaiarsa J.L., Tyzio R., Khazipov R. GABA: a pioneer transmitter that excites immature neurons and generates primitive oscillations. Physiological Reviews. 2007;87(4):1215–1284. doi: 10.1152/physrev.00017.2006. 17928584 [DOI] [PubMed] [Google Scholar]
- Marsman A., Mandl R.C.W., Van den Heuvel M.P., Boer V.O., Wijnen J.P., Klomp D.W.J., Luijten P.R., Hilleke E H.P. Glutamate changes in healthy young adulthood. European Neuropsychopharmacology: the Journal of the European College of Neuropsychopharmacology. 2013;23(11):1484–1490. doi: 10.1016/j.euroneuro.2012.11.003. 23245833 [DOI] [PubMed] [Google Scholar]
- Segovia G., Porras A., Del Arco A., Mora F. Glutamatergic neurotransmission in aging: a critical perspective. Mechanisms of Ageing and Development. 2001;122(1):1–29. doi: 10.1016/s0047-6374(00)00225-6. 11163621 [DOI] [PubMed] [Google Scholar]
- Angelie E., Bonmartin A., Boudraa A., Gonnaud P.M., Mallet J.J., Sappey-Marinier D. Regional differences and metabolic changes in normal aging of the human brain: proton MR spectroscopic imaging study. AJNR. American Journal of Neuroradiology. 2001;22(1):119–127. 11158897 [PMC free article] [PubMed] [Google Scholar]
- Raininko R., Mattsson P. Metabolite concentrations in supraventricular white matter from teenage to early old age: a short echo time 1H magnetic resonance spectroscopy (MRS) study. Acta Radiologica (Stockholm, Sweden: 1987) 2010;51(3):309–315. doi: 10.3109/02841850903476564. 20170295 [DOI] [PubMed] [Google Scholar]
- Sailasuta N., Ernst T., Chang L. Regional variations and the effects of age and gender on glutamate concentrations in the human brain. Magnetic Resonance Imaging. 2008;26(5):667–675. doi: 10.1016/j.mri.2007.06.007. 17692491 [DOI] [PMC free article] [PubMed] [Google Scholar]
- Maudsley A.A., Domenig C., Govind V., Darkazanli A., Studholme C., Arheart K., Bloomer C. Mapping of brain metabolite distributions by volumetric proton MR spectroscopic imaging (MRSI) Magnetic Resonance in Medicine: Official Journal of the Society of Magnetic Resonance in Medicine / Society of Magnetic Resonance in Medicine. 2009;61(3):548–559. doi: 10.1002/mrm.21875. 19111009 [DOI] [PMC free article] [PubMed] [Google Scholar]
- Gallinat J., Lang U.E., Jacobsen L.K., Bajbouj M., Kalus P., Von Haebler D., Seifert F., Schubert F. Abnormal hippocampal neurochemistry in smokers: evidence from proton magnetic resonance spectroscopy at 3 T. Journal of Clinical Psychopharmacology. 2007;27(1):80–84. doi: 10.1097/JCP.0b013e31802dffde. 17224719 [DOI] [PubMed] [Google Scholar]
- Ongür D., Prescot A.P., Jensen J.E., Cohen B.M., Renshaw P.F. Creatine abnormalities in schizophrenia and bipolar disorder. Psychiatry Research. 2009;172(1):44–48. doi: 10.1016/j.pscychresns.2008.06.002. 19239984 [DOI] [PMC free article] [PubMed] [Google Scholar]