Abstract
The northern leopard frog Rana (Lithobates) pipiens is an important animal model, being used extensively in cancer, neurology, physiology, and biomechanical studies. R. pipiens is a native North American frog whose range extends from northern Canada to southwest United States, but over the past few decades its populations have declined significantly and is now considered uncommon in large portions of the United States and Canada. To aid in the study and conservation of R. pipiens, this paper describes the first R. pipiens transcriptome. The R. pipiens transcriptome was annotated using Gene Ontology (GO), Kyoto Encyclopedia of Genes and Genomes (KEGG), and Eukaryotic Orthologous Groups (KOG). Differential expression analysis revealed universal and tissue specific genes, and endocrine-related genes were identified. Transcriptome assemblies and other sequence data are available for download.
Keywords: Northern Leopard Frog, Rana pipiens, Transcriptome.
Results and Discussion
General Characteristics of the Rana pipiens Transcriptome
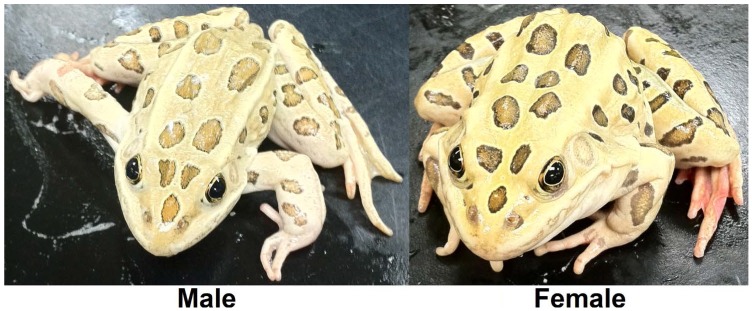
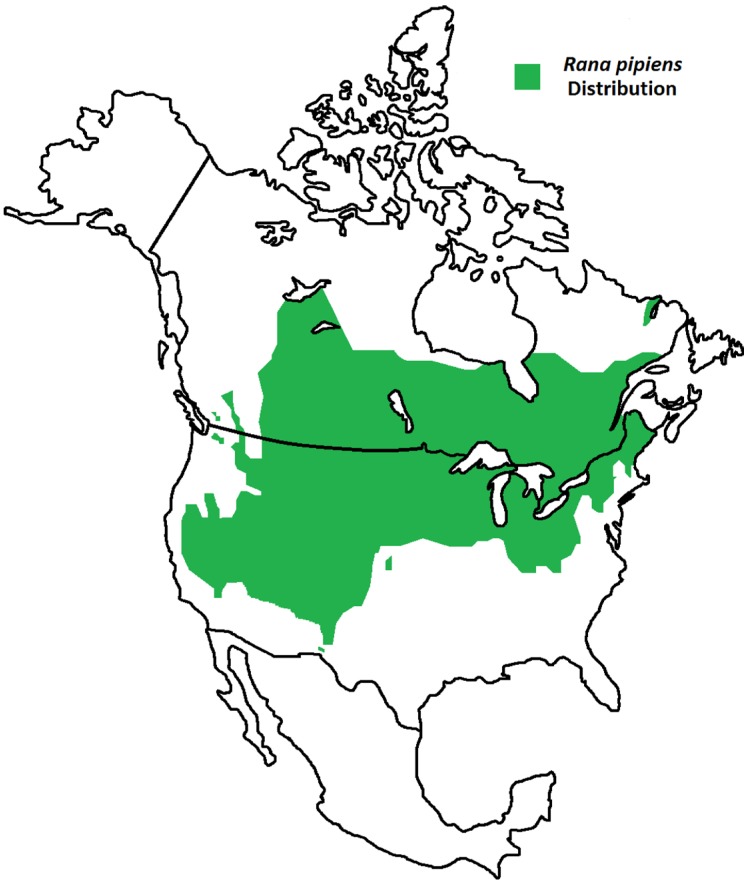
To characterize the transcriptome of the northern leopard frog Rana (Lithobates) pipiens (Figure 1), a widely distributed North American species (Figure 2), cDNA samples were separately prepared from gonad, liver, kidney, brain, and tadpole homogenates and sequenced using paired-end 100 bp reads 1. The resulting 1.166 billion reads, comprising 116.6 Gb of sequence, were used to construct a transcriptome with Velvet and Oases (Table 1 and Table 2) 2,3. Assembled transcriptomes and annotated characteristics are available at http://www.davislab.net/rana/, and raw reads have been deposited at NCBI under BioProject accession PRJNA240240.
Figure 1.
The northern leopard frog Rana pipiens. From March to June mature R. pipiens gather at communal breeding ponds. Each female lays between 2,000 to 6,500 small, black and white eggs that hatch after two to three weeks 1. Tadpoles are greenish or brown, with yellow or black speckles and their bellies are white and somewhat transparent, reaching 84 mm in length 1. Metamorphosis typically occurs after 60 to 80 days, depending on conditions, and froglets are 20 to 30 mm long at metamorphosis 1. Sexual maturity is reached in one to three years and adult R. pipiens are slender, long-legged green or brown with a white or cream underside, prominent, light-colored dorsolateral ridges, and large, dark spots located on its back, sides, and legs and grow to an average length of 68 mm and mass of 38.0 g 1.
Figure 2.
Geographic Distribution of Rana pipiens. R. pipiens is a native North American frog whose range extends from northern Canada to the southwest United States 1. Its life cycle includes an aquatic larval stage and semi-terrestrial juvenile and adult stages; thus, this frog is found residing within grassland, brushland, and forest environments, prefering static or slow-moving water 1.
Table 1.
Information on sequencing reads for Rana pipiens.
| Tissue | Number of Reads | Total Length |
|---|---|---|
| Male Gonad | 32,771,881 | 65,543,762 bp |
| Male Liver | 35,791,829 | 71,583,658 bp |
| Female Gonad | 77,777,594 | 155,555,188 bp |
| Female Liver | 35,527,804 | 71,055,608 bp |
| Female Brain | 111,972,214 | 223,944,428 bp |
| Female Kidney | 108,243,825 | 216,487,650 bp |
| Tadpole | 181,032,472 | 362,064,944 bp |
| Total | 1,166,235,238 | 116,623,523,800 bp |
The seven RNA samples, from both adult and juvenile R. pipiens tissues, were converted into individual libraries and were subsequently run on three sequencing lanes (Lane 1: Male Gonad, Male Liver, Female Gonad, Female Liver; Lane 2: Female Brain and Female Kidney; and Lane 3: Two Tadpole Stages) capturing 100 bp paired end reads.
Table 2.
Statistics for Rana pipiens transcriptome assembly.
| Number of Transcripts | Mean Length | Median Length | N50 | GC Content |
|---|---|---|---|---|
| 33,086 | 2,639 bp | 2,004 bp | 3,783 bp | 44.02 |
The R. pipiens transcriptome was analyzed and the total number of transcripts, mean and median transcript length, N50, and GC content was determined.
Organism Homology and Species Confirmation of Rana pipiens
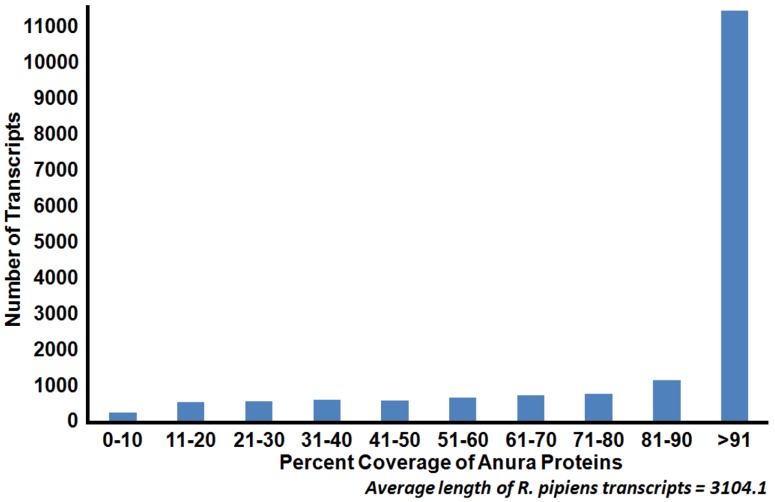
To identify transcript homologs, blastx was used to compare the R. pipiens transcriptome against the NCBI non-redundant (nr) protein database. Of the assembled transcripts, 91.7% (30,364) yielded significant BLAST hits. Among these, the western clawed frog Xenopus tropicalis and African clawed frog Xenopus laevis have the greatest number of top BLAST hits (71.6%). These result are consistent with accepted taxonomy but are strongly influenced by the completeness of protein annotation in the nr database; e.g. X. tropicalis is the closest, fully sequenced relative of R. pipiens. To further identify the completeness of the representative transcriptome, this set was compared via BLASTX against all Anura (frog) sequences in the nr database, resulting in more than 73% of the transcripts exhibiting a length coverage greater than 80% (Figure 3). To validate our transcriptome assembly as being from R. pipiens, we compared several genes (18S and 28S rRNA, rhodopsin, and histone H3) to published sequences. The concatenated results indicate a significant identity (99.42%) to previously published R. pipiens gene sequences, suggesting a preliminary level of genetic variation within the species (Table 3). Assembled sequence data also supported the previously published phylogenic differences between the Rana species established using these genes4.
Figure 3.
Coverage of Anura (frog) proteins by Rana pipiens transcripts. Sequence coverage length of R. pipiens transcripts when compared to available Anura (frog) proteins. The generated representative R. pipiens transcriptome was BLASTed against all available Anura proteins (count=159,284). The length of sequence homology as reported by BLASTx was compared to the length of the Anura protein homolog. The majority of the R. pipiens transcripts (45%) had sequence homology with one or more Anura transcripts which covered at least 90% of the length of the Anura protein.
Table 3.
Percent identity to published Rana species sequences.
| Species | Percent identity |
|---|---|
| Rana pipiens | 99.42 |
| Rana chiricahuensis | 95.69 |
| Rana capito | 94.17 |
| Rana yavapaeniensis | 93.57 |
| Rana sylvatica | 90.57 |
| Rana temoparia | 89.5 |
Transcripts generated in this study were aligned to previously published Rana species sequences and a percent identity matrix was computed (4). This study utilized Rana_pipiens_Transcript_030065, 050213, 496664, and 023205 for 18s rRNA, histone H3, rhodopsin, and 28s rRNA sequences, respectively.
Functional Annotation and Characterization of Rana pipiens Transcripts
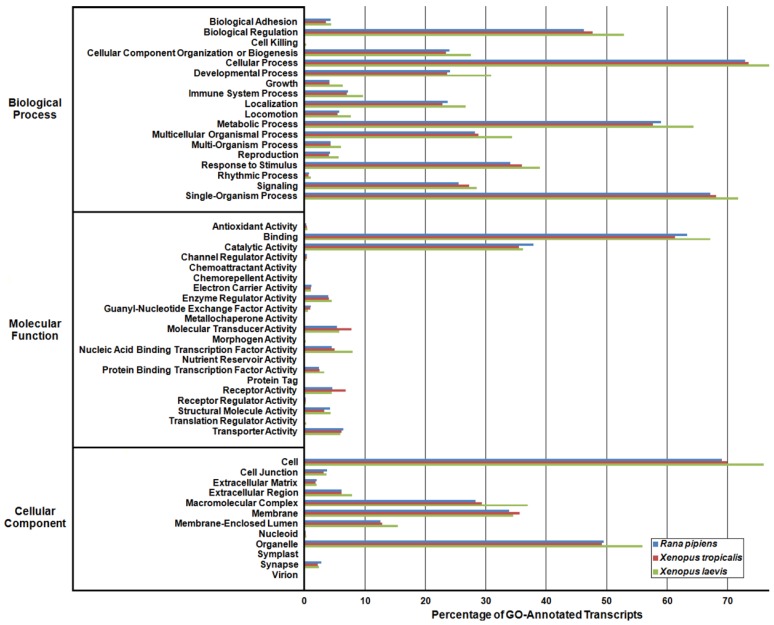
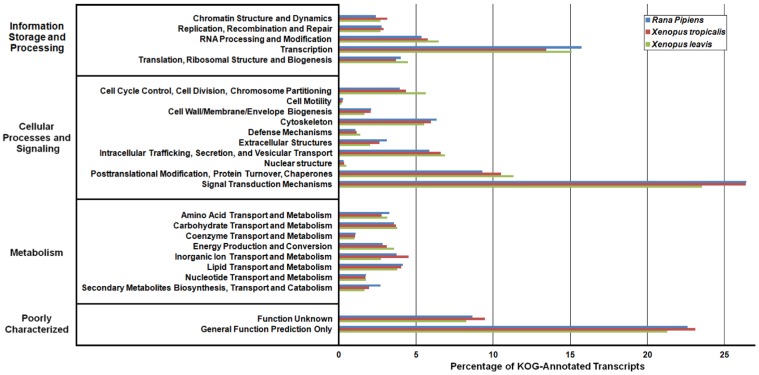
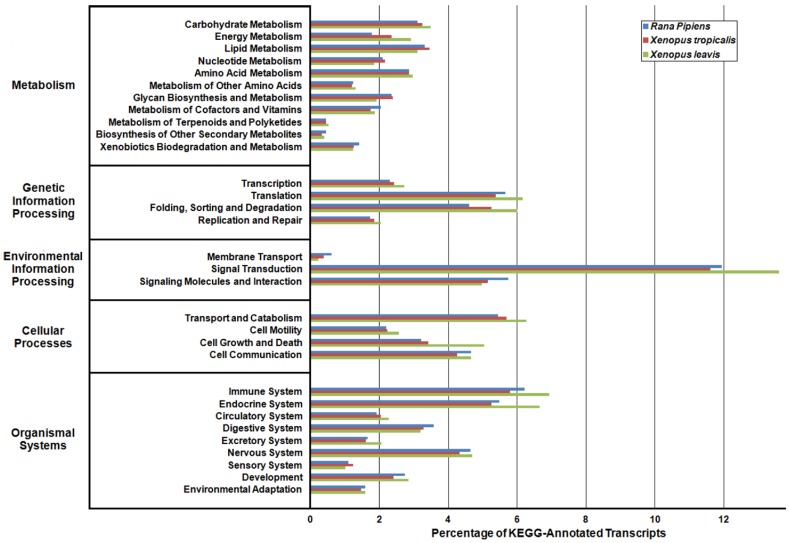
In an effort to both review the putative functions of the R. pipiens transcripts, and to validate the completeness of its transcriptome, multiple functional analyses were performed against R. pipiens and the X. tropicalis and X. laevis transcriptomes. Gene Ontology (GO) analysis was performed with 63.6% (21,056) of the transcripts being assigned GO terms (Figure 4). Importantly, X. tropicalis and X. laevis displayed a similar ontology pattern with the average percent difference in GO categories between R. pipiens and X. tropicalis of 25.03%, as compared to X. tropicalis and X. laevis at 24.42% (calculated by summing the organism differences between each GO category, and dividing by the number of GO categories). Further examination using Eukaryotic Orthologous Groups (KOG) and Kyoto Encyclopedia of Genes and Genomes (KEGG) reveled that 59.8% (19,785) and 33.4% (11,064) of the transcripts were assigned KOG terms and K-numbers, respectively (Figure 5 and Figure 6). Overall, the nearly identical patterns observed in the GO, KOG, and KEGG analyses by R. pipiens, X. tropicalis, and X. laevis suggests the completeness of the R. pipiens transcriptome.
Figure 4.
Gene Ontology (GO) Analysis of the Rana pipiens Transcripts. GO functional analysis was performed to evaluate transcript function and transcriptome completeness. GO terms were assigned to the R. pipiens transcripts and the mRNA RefSeq nucleotide entries of Xenopus tropicalis and Xenopus laevis retrieved from NCBI. The distributions of three transcriptomes closely resemble one another, suggesting the completeness of the R. pipiens transcriptome.
Figure 5.
Eukaryotic Orthologous Groups (KOG) Characterization of Rana pipiens Transcripts. Putative transcript functions were assessed and transcriptome completeness was evaluated using KOG analysis. The R. pipiens transcriptome and mRNA nucleotide entries from NCBI of Xenopus tropicalis and Xenopus laevis were assigned KOG terms. The three transcriptomes have similar distributions, supporting the completeness of the R. pipiens transcriptome.
Figure 6.
Kyoto Encyclopedia of Genes and Genomes (KEGG) Classification of Rana pipiens Transcripts. To review the putative functions of the transcripts and to assess the completeness of the transcriptome, KEGG analysis was performed. The R. pipiens transcripts and the mRNA nucleotide entries of Xenopus tropicalis and Xenopus laevis, retrieved from NCBI, were characterized by assigning K-numbers. The distributions of these three transcriptomes closely mimic one another, suggesting the completeness of the R. pipiens transcriptome.
Differential Expression of Transcripts in the Rana pipiens Tissues
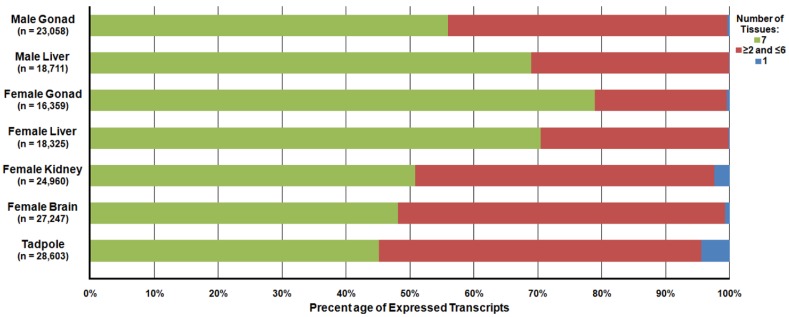
Differential expression analysis was carried out to determine the relative abundance of the R. pipiens transcripts within each tissue. In total, 23,058, 18,711, 16,359, 18,325, 24,960, 27,247, and 28,603 transcripts were detected and 72, 12, 76, 33, 182, 612, and 1,272 transcripts were unique to only that tissue in the male gonad, male liver, female gonad, female liver, female kidney, female brain, and tadpole, respectively (Figure 7). A file containing the relative expression of each transcript in individual tissues is available at http://www.davislab.net/rana/.
Figure 7.
Differential Expression of Transcripts Present in Separate Rana pipiens Tissues. Differential expression analysis was performed to determine the abundance of the transcripts within each R. pipiens tissue. In total, 23,058, 18,711, 16,359, 18,325, 24,960, 27,247, and 28,603 transcripts were detected and 72, 12, 76, 33, 182, 612, and 1,272 transcripts were unique to only that tissue (blue) in the male gonad, male liver, female gonad, female liver, female kidney, female brain, and tadpole, respectively. Moreover, 12,904 transcripts were present in all seven tissues (green) and a varied number of transcripts were present in more than one, but less than six, other tissues (red).
Identification of Rana pipiens Endocrine-Related Genes
Increasing evidence demonstrates that agricultural contaminants, such as veterinary pharmaceuticals, fertilizers, and pesticides, can alter endocrine activities in wildlife and other vertebrates, including humans 5,6. Therefore, because of its range and habitat, R. pipiens can serve as an ideal sentinel organism for monitoring the potential effects of these chemicals on other affected organisms. To this end, putative R. pipiens homologs of major endocrine-related genes were identified and exhibited a high degree of similarity to those genes of X. laevis (Table 4).
Table 4.
Rana pipiens endocrine-related genes.
| Gene Name | Gene Symbol | Gene ID | Query ID | Length (bp) | Subject ID | E-Value | Bit Score |
|---|---|---|---|---|---|---|---|
| Androgen Receptor | ar | 399456 | Rana_pipiens_Transcript_250514 | 7358 | NP_001084353.1 | 0 | 1209 |
| Cytochrome P450, Family 17, Subfamily A, Polypeptide 1 | cyp17a1 | 100036774 | Rana_pipiens_Transcript_280688 | 2963 | AAG42003.1 | 0 | 777 |
| Cytochrome P450, Family 19, Subfamily A, Polypeptide 1 | cyp19a1 | 373656 | Rana_pipiens_Transcript_263865 | 3388 | BAA90529.1 | 0 | 837 |
| Hydroxysteroid (17-beta) Dehydrogenase 12 | hsd17b12-b | 379747 | Rana_pipiens_Transcript_478585 | 1367 | NP_001080055.1 | 9.00E-87 | 264 |
| Estrogen Receptor 1 (alpha) | esr1-a | 398734 | Rana_pipiens_Transcript_057318 | 4278 | AAQ84782.1 | 0 | 924 |
| Estrogen Receptor 2 (beta) | esr2 | 100174814 | Rana_pipiens_Transcript_334780 | 2192 | NP_001124426.1 | 0 | 917 |
| Glucocorticoid Receptor | nr3c1-a | 378598 | Rana_pipiens_Transcript_449022 | 6500 | CAA54804.1 | 0 | 589 |
| Hydroxy-Delta-5-Steroid Dehydrogenase, 3 Beta- and Steroid Delta-Isomerase 1 | hsd3b1 | 734818 | Rana_pipiens_Transcript_284246 | 2143 | NP_001089754.1 | 0 | 536 |
| Hypoxia Inducible Factor 1 Alpha | hif-1a | 445838 | Rana_pipiens_Transcript_190140 | 4052 | ABF71072.1 | 0 | 1264 |
| Steroid 11-Beta-Hydroxylase Protein | - | - | Rana_pipiens_Transcript_141896 | 1464 | AAQ04666.1 | 3.00E-152 | 431 |
| Steroidogenic Acute Regulatory Protein | star | 100381120 | Rana_pipiens_Transcript_388250 | 3776 | NP_001167502.1 | 2.00E-168 | 497 |
| Vitellogenin | vtga2 | 100037071 | Rana_pipiens_Transcript_478090 | 5777 | NP_001152753.1 | 0 | 1126 |
To aid in the use of R. pipiens as a sentinel organism, putative R. pipiens endocrine-related genes were identified and the top BLAST hits are displayed.
Methods
Organism Growth Conditions, RNA Sample Preparation and Generation of Sequence Data
Adult frogs and tadpoles were obtained from Science Kit & Boreal Laboratories, Rochester, NY (Item Number 67496-32 and 67040-12, wild-caught). Adult R. pipiens were sacrificed and their organs, including gonad, liver, kidney, and brain, were isolated according to approved IUCAC protocols. Upon their arrival, the tadpoles were housed overnight (Group 1) and for one week (Group 2) within a 40 gallon tank. Following each period, the tadpoles were starved and placed into a tetracycline (100 mg/L) solution for 24 hours then sacrificed in accordance with approved IUCAC protocols. To preserve the integrity of the RNA, the isolated tissues were stored in RNAlater (Qiagen) for 24 hours at 4°C then placed at -80°C.
Total RNA was extracted from each tissue individually, using the RNeasy Plus Mini Kit (Qiagen). mRNA was purified from the total RNA preparations, using poly-T oligo-attached magnetic beads and converted into cDNA with random primers using the TruSeq® RNA Sample Preparation Kit v2 (Illumina). Libraries were sequenced using paired-end 100 bp reads with an Illumina HiSeq 2000 sequence analyzer at the University of Nebraska Medical Center.
Transcriptome Assembly
To facilitate an accurate transcriptome assembly, reads were processed using PRINSEQ (version 0.17.3 lite) then Khmer (version 181e441) 7,8. The processed reads were then assembled using Velvet (version 1.2.07) and Oases (version 1.2.07) in multi-k fashion 2,3. Putative coding transcripts were identified in the redundant transcriptome by removing any transcript less than 200 bp with PRINSEQ, translating with TransDecoder (release Jan 16, 2014), reducing redundancy of the predicted proteins with CD-HIT and simplicity with PRINSEQ (version 0.17.3 lite), and then using blat (version 35x1) to compare against UniProt (release 2014_02) and the X. tropicalis NCBI proteome (retrieved April 1, 2014). Potential non-coding RNAs were identified using blastn (E-value ≤ 1e-5) and the Rfam (version 11.0) and NONCODE (version 3.0) databases 9,10. Transcripts that closely matched a UniProt or X. tropicalis protein or non-coding RNA were counted and in the case of multiple query matches to a single subject, the transcript with the highest bit-score was selected. The command-line codes used for transcriptome assembly are available at http://www.davislab.net/rana/.
Similarity of Rana pipiens Transcripts to Other Species
Transcripts were analyzed for sequence similarity by scanning the NCBI nr database (retrieved March 30, 2014) using blastx (E-value ≤ 1e-5). The top-hit species for each BLAST query was counted using Blast2GO (version 2.7.1) 11. Representative transcripts were compared to Anura proteins (retrieved August 13, 2014) to determine their coverage using blastx (E-value ≤ 1e-5) and MuSeqBox 12.
Percent Identity Matrix Calculation
Sequences obtained from the current assembly were aligned with sequences previously published to evaluate phylogenic relationships within amphibians 4. Alignments were trimmed with Gblocks, concatenated into a single ordered sequence, and ClustalW alignment used to produce a percent identity matix 13,14.
Gene Ontology (GO), Eukaryotic Orthologous Groups (KOG), and Kyoto Encyclopedia of Genes and Genomes (KEGG)
Multiple functional analyses were performed to assess the putative functions of the R. pipiens transcripts and to validate the transcriptome completeness, with X. tropicalis and X. laevis mRNA nucleotide entries from NCBI (retrieved April 1, 2014). First, blastx (E-value ≤ 1e-5) was used to scan the transcriptome against the NCBI nr database (retrieved March 30, 2014) and GO terms were assigned using B2G4Pipe (version 2.5.0) and Blast2GO (version 2.7.1) with the b2g_may13 GO database 11. Next, transcripts were translated by OrfPredictor (version 2.3) and these results were aligned using rps-blast (E-value of ≤ 1e-5) to the NCBI KOG database (version 3.0) 15,16. Lastly, transcripts were compared to the Eukaryotic and Amphibian GENES datasets using the KEGG Automatic Annotation Server (version 1.68x) 17.
Expression Profile of the Rana pipiens Tissues
To calculate differential expression of transcripts between tissues, reads from each tissue were aligned to the transcriptome with Bowtie (version 2.2.2) and TopHat (version 2.0.11), and then Cuffdiff (version 2.2.0) was used to estimate transcript abundance 18,19,20.
Identification of Endocrine-Related Genes
Endocrine-related genes present within the R. pipiens transcriptome were identified by comparing the transcriptome to a custom BLAST database containing endocrine-related genes from X. laevis (retrieved from NCBI on October 8, 2013) using blastx (E-value ≤ 1e-5).
Acknowledgments
Financial support for the present study was provided by grants from the Nebraska Academy of Sciences and the Minnesota Herpetological Society. The University of Nebraska provided additional support through the Biomedical Research Training Program, the Fund for Investing in the Research Enterprise, the Graduate Research and Creative Activity Fund, the Holland Computing Center, and the Fund for Undergraduate Scholarly Experience.
The following NIH awards supported this work: NCRR RR027754, RR016469-8348, RR018788-08 and NIGMS GM103427, GM103471. This publication's contents are the sole responsibility of the authors and do not necessarily represent the official views of the NIH.
References
- 1.Species Profile: Northern Leopard Frog. US Environmental Protection Agency; http://www.epa.gov/housatonic/thesite/restofriver/reports/final_era/B%20-%20Focus%20Species%20Profiles/EcoRiskProfile_leopard_frog.pdf. [Google Scholar]
- 2.Zerbino DR, Birney E. Velvet: algorithms for de novo short read assembly using de Bruijn graphs. Genome Res. 2008;18:821–829. doi: 10.1101/gr.074492.107. [DOI] [PMC free article] [PubMed] [Google Scholar]
- 3.Schulz MH, Zerbino DR, Vingron M, Birney E. Oases: robust de novo RNA-seq assembly across the dynamic range of expression levels. Bioinformatics. 2012;28:1086–1092. doi: 10.1093/bioinformatics/bts094. [DOI] [PMC free article] [PubMed] [Google Scholar]
- 4.Frost DR, Grant T, Faivovich J, Bain RH, Haas A, Haddad CFB, de Sá RO, Channing A, Wilkinson M, Donnellan SC, Raxworthy CJ, Campbell JA, Blotto BL, Moler P, Drewes RC, Nussbaum RA, Lynch JD, Green DM, Wheeler WC. The Amphibian Tree of Life. Bull Am Mus Nat Hist. 2006;297:1–370. [Google Scholar]
- 5.Knight LA, Christenson MK, Trease AJ, Davis PH, Kolok AS. The spring runoff in Nebraska's (USA) Elkhorn River watershed and its impact on two sentinel organisms. Environ Toxicol Chem. 2013;32:1544–1551. doi: 10.1002/etc.2220. [DOI] [PMC free article] [PubMed] [Google Scholar]
- 6.Hayes TB, Anderson LL, Beasley VR, de Solla SR, Iguchi T, Ingraham H, Kestemont P, Kniewald J, Kniewald Z, Langlois VS, Luque EH, McCoy KA, Muñoz-de-Toro M, Oka T, Oliveira CA, Orton F, Ruby S, Suzawa M, Tavera-Mendoza LE, Trudeau VL, Victor-Costa AB, Willingham E. Demasculinization and feminization of male gonads by atrazine: consistent effects across vertebrate classes. J Steroid Biochem Mol Biol. 2011;127:64–73. doi: 10.1016/j.jsbmb.2011.03.015. [DOI] [PMC free article] [PubMed] [Google Scholar]
- 7.Schmieder R, Edwards R. Quality control and preprocessing of metagenomic datasets. Bioinformatics. 2011;27:863–864. doi: 10.1093/bioinformatics/btr026. [DOI] [PMC free article] [PubMed] [Google Scholar]
- 8.A Reference-free algorithm for computational normalization of shotgun sequencing data. Brown CT, Howe A, Zhang Q, Pyrkosz AB, Brom TH; http://arxiv.org/abs/1203.4802v2. [Google Scholar]
- 9.Burge SW, Daub J, Eberhardt R, Tate J, Barquist L, Nawrocki EP, Eddy SR, Gardner PP, Bateman A. Rfam 11.0: 10 years of RNA families. Nucleic Acids Res. 2013;41:226–232. doi: 10.1093/nar/gks1005. [DOI] [PMC free article] [PubMed] [Google Scholar]
- 10.Bu D, Yu K, Sun S, Xie C, Skogerbø G, Miao R, Xiao H, Liao Q, Luo H, Zhao G, Zhao H, Liu Z, Liu C, Chen R, Zhao Y. NONCODE v3.0: integrative annotation of long noncoding RNAs. Nucleic Acids Res. 2012;40:210–215. doi: 10.1093/nar/gkr1175. [DOI] [PMC free article] [PubMed] [Google Scholar]
- 11.Conesa A, Götz S, García-Gómez JM, Terol J, Talón M, Robles M. Blast2GO: a universal tool for annotation, visualization and analysis in functional genomics research. Bioinformatics. 2005;21:3674–3676. doi: 10.1093/bioinformatics/bti610. [DOI] [PubMed] [Google Scholar]
- 12.Xing L, Brendel V. MuSeqBox: a program for multi-query sequence BLAST output examination. Bioinformatics. 2001;17:744–745. doi: 10.1093/bioinformatics/17.8.744. [DOI] [PubMed] [Google Scholar]
- 13.Larkin MA, Blackshields G, Brown NP, Chenna R, McGettigan PA, McWilliam H, Valentin F, Wallace IM, Wilm A, Lopez R, Thompson JD, Gibson TJ, Higgins DG. Clustal W and Clustal X version 2.0. Bioinformatics. 2007;23:2947–2948. doi: 10.1093/bioinformatics/btm404. [DOI] [PubMed] [Google Scholar]
- 14.Castresana J. Selection of conserved blocks from multiple alignments for their use in phylogenetic analysis. Mol Biol Evol. 2000;17:540–552. doi: 10.1093/oxfordjournals.molbev.a026334. [DOI] [PubMed] [Google Scholar]
- 15.Min XJ, Butler G, Storms R, Tsang A. OrfPredictor: predicting protein-coding regions in EST-derived sequences. Nucleic Acids Res. 2005;33:677–680. doi: 10.1093/nar/gki394. [DOI] [PMC free article] [PubMed] [Google Scholar]
- 16.Tatusov RL, Fedorova ND, Jackson JD, Jacobs AR, Kiryutin B, Koonin EV, Krylov DM, Mazumder R, Mekhedov SL, Nikolskaya AN, Rao BS, Smirnov S, Sverdlov AV, Vasudevan S, Wolf YI, Yin JJ, Natale DA. The COG database: an updated version includes eukaryotes. BMC Bioinformatics. 2003;4:1–14. doi: 10.1186/1471-2105-4-41. [DOI] [PMC free article] [PubMed] [Google Scholar]
- 17.Moriya Y, Itoh M, Okuda S, Yoshizawa AC, Kanehisa M. KAAS: an automatic genome annotation and pathway reconstruction server. Nucleic Acids Res. 2007;35:182–185. doi: 10.1093/nar/gkm321. [DOI] [PMC free article] [PubMed] [Google Scholar]
- 18.Langmead B, Salzberg S. Fast gapped-read alignment with Bowtie 2. Nat Methods. 2012;9:357–359. doi: 10.1038/nmeth.1923. [DOI] [PMC free article] [PubMed] [Google Scholar]
- 19.Kim D, Pertea G, Trapnell C, Pimentel H, Kelley R, Salzberg SL. TopHat2: accurate alignment of transcriptomes in the presence of insertions, deletions and gene fusions. Genome Biol. 2013;14:1–13. doi: 10.1186/gb-2013-14-4-r36. [DOI] [PMC free article] [PubMed] [Google Scholar]
- 20.Trapnell C, Williams BA, Pertea G, Mortazavi A, Kwan G, van Baren MJ, Salzberg SL, Wold BJ, Pachter L. Transcript assembly and quantification by RNA-Seq reveals unannotated transcripts and isoform switching during cell differentiation. Nat Biotechnol. 2010;28:511–515. doi: 10.1038/nbt.1621. [DOI] [PMC free article] [PubMed] [Google Scholar]


