

Summary
Background
The mechanisms by which viruses induce asthma exacerbations are not well understood.
Objective
We characterized fluctuations in nasal aspirate cytokines during naturally occurring respiratory viral infections in children with asthma.
Methods
Sixteen children underwent home collections of nasal aspirates when they were without cold symptoms and again during self‐reported respiratory illnesses. The presence of viral infection was ascertained by multiplex PCR. Cytokines were measured using multiplex immune assay. mRNA expression for selected markers of viral infection was measured using RT‐PCR. A cumulative respiratory symptom score was calculated for each day of measurement. Generalized estimated equations were used to evaluate associations between viral infection and marker elevation, and between marker elevation and symptom score.
Results
The 16 patients completed a total of 37 weeks of assessment (15 ‘well’ weeks; 22 self‐assessed ‘sick’ weeks). Viral infections were detected in 3 of the ‘well’ weeks and 17 of the ‘sick’ weeks (10 rhinovirus, three coronavirus, two influenza A, two influenza B, two respiratory syncytial virus, one parainfluenza). Compared to virus‐negative well weeks, nasal aspirate IFN‐γ, CXCL8/IL‐8, CXCL10/IP‐10, CCL5/RANTES, CCL11/eotaxin‐1, CCL2/MCP‐1, CCL4/MIP‐1β, CCL7/MCP‐3, and CCL20/MIP3α protein levels increased during virus‐positive sick weeks. Only a subset of cytokines (IFN‐γ, CXCL8, CCL2, CCL4, CCL5, and CCL20) correlated with self‐reported respiratory tract symptoms. While many aspirates were dilute and showed no mRNA signal, viral infection significantly increased the number of samples that were positive for IFN‐λ1, IFN‐λ2/3, TLR3, RIG‐I, and IRF7 mRNA.
Conclusions and clinical relevance
We conclude that in children with asthma, naturally occurring viral infections apparently induce a robust innate immune response including expression of specific chemokines, IFNs, and IFN‐responsive genes.
Keywords: asthma, children, cytokines, IRF7, respiratory infection, rhinovirus, virus
Introduction
Epidemiological studies have uncovered a strong association between viral infections, especially those caused by rhinovirus, and exacerbations of asthma attacks 1, 2, 3. However, the mechanisms by which viruses induce exacerbations of chronic airways disease are not well understood. In response to viral infection, the airway epithelium, and to a lesser extent immune cells such as monocytes, macrophages, and dendritic cells 4, 5, 6, 7, release pro‐inflammatory cytokines, interferons (IFNs), and antimicrobial substances, which in turn, promote clearance of microorganisms, and activation of the adaptive immune system. However, in patients with chronic respiratory illnesses, the innate immune response may also be responsible for disease exacerbation 8.
Although the inflammatory response to experimental rhinovirus infection has been monitored 9, 10, 11, 12, 13, 14, few studies have examined the innate immune response of patients with asthma to natural colds. Increases in respiratory tract CXCL8/IL‐8, CCL5/RANTES, CCL19/MIP‐1α, IL‐10, CCL7/MCP‐3, and CCL13/MCP‐4 have been detected 15, 16, 17, 18. To further examine the innate immune response to viral infection in children with asthma, we measured nasal aspirate cytokine levels in 16 asthmatic children before and after upper respiratory tract infections. In contrast to the previous studies, we examined at least three time points before and in association with symptomatic illness. We evaluated the associations between viral infection and cytokine expression, and between cytokine expression and symptom score. We also examined the effects of upper respiratory tract infection on mRNA levels of selected markers of viral infection, including IFNs. Finally, we evaluated a new method of virus detection using a single polymerase chain reaction–ligation detection reaction (PCR‐LDR) multiplex assay. We hypothesized that respiratory viral infection of children with asthma causes robust elaboration of pro‐inflammatory cytokines and IFNs, and that the level of pro‐inflammatory cytokines correlates with symptom severity.
Materials and methods
Study design
We conducted an observational cohort study of 16 children with asthma. Children were eligible for the study if they received care from a University of Michigan physician for asthma, were aged 6–18 years, and lived within a 30 mile radius of Ann Arbor. Outpatients were enrolled for 3–6 months, with the goal of assessing cytokines at baseline and in association with at least one viral‐induced exacerbation during that period. Initial consent and first evaluation was conducted at the University of Michigan, but all subsequent evaluations were performed in the participant's home. This study was approved by the University of Michigan Institutional Review Board (approval number HUM00018442). All clinical investigations were conducted according to principles expressed in the Declaration of Helsinki (http://www.wma.net).
Child characteristics
At the initial assessment, parents or guardians completed an extensive questionnaire, which included standardized questions about presence and frequency of asthma symptoms, an inventory of a child's asthma medications and current usage, and queries about environmental exposures, and child and family demographic information. Baseline asthma severity was assessed using National Asthma Education and Prevention Program Guidelines 19 incorporating an adjustment for asthma controller therapy use 20.
Data and sample collection
We performed home measurements of respiratory symptoms and collected nasal secretions (for detection of viral RNA by PCR and host biomarkers by PCR and ELISA) on 3 days during a week when children were healthy (not reporting upper respiratory tract infection or asthma symptoms), and again during a week when they experienced cold or flu‐like symptoms. Families were given a calendar and a simple respiratory symptom scale and asked to mark the level of their symptoms. We used a modified version of the respiratory symptom score developed by the Child Origins of Asthma Study 21, which assessed fever, cough, nasal symptoms, wheezing, difficulty breathing, waking up at night with cough, and interference with usual activities. When the patient experienced a symptomatic respiratory illness, as defined by a symptom score of two or higher on a scale of 0–13, the family notified the study staff and scheduled a visit within 48 h of the beginning of symptoms (defined as day 1 of the illness). Information regarding impact of respiratory symptoms on daily activities and recent use of asthma medicines was also collected. As noted above, study technicians visited the home every 2–3 days to retrieve additional nasal washing samples, for a total of three visits during the week following reporting of symptoms. The three specific days of the week selected for analysis were based on the convenience of the subjects and laboratory technician. Although specimens were most often collected on days 1, 4, and 7 of a given week, specimen collection was sometimes compressed into a 5 or 6‐day period.
To collect a nasal lavage sample, we utilized a protocol developed by Powell and Shorr 22 and modified by James Gern (University of Wisconsin, personal communication). Two squirts of isotonic 0.65% sodium chloride were instilled into the child's nostrils (estimated at < 1 mL per nostril) using a commercially available nasal saline spray (B.F. Ascher, Lenexa, KS, USA). The subject then blew their nose into a zippered plastic bag, and 3 ml of M4RT viral transport medium (Remel, Lenexa, KS, USA) was added. In general, samples were collected in the presence of study staff and were transported from homes to the laboratory within 3 h of collection in a cooler with ice packs. However, due to logistical issues scheduling home visits, families were also provided with kits for independent collection of nasal washings specimens at home. If a visit could not be scheduled within 48 h, families were instructed to collect the sample, double bag the sample, place in a tightly sealed collection box, and to keep it in the refrigerator until the staff could collect the sample. We required a 1 week interval between sample collections for sequential illnesses.
Detection of respiratory viruses
Nasal aspirates were homogenized using a handheld homogenizer to allow pipetting of viscous samples and frozen at −70°C to allow for batched analysis. Viral RNA and DNA were extracted using a MinElute kit (Qiagen, Valencia, CA, USA). Samples were assessed for the presence of viral RNA or DNA via PCR using the Seegene Seeplex RV‐12 detection kit (Seegene, Rockville, MD, USA). This kit detects human parainfluenza viruses 1, 2, and 3, human metapneumovirus, human coronavirus 229E/NL63, and OC43, human adenovirus, influenza viruses A and B, human respiratory syncytial virus (RSV) A and B, and human rhinovirus A.
We also analysed specimens for respiratory viruses using a novel polymerase chain PCR‐LDR multiplex assay 23. The original system, which was designed to detect influenza viruses, was expanded to include parainfluenza 1, 2, 3, 4A and 4B, coronaviruses 229E and OC43, influenza A and B, rhinoviruses A, B, and C, adenoviruses A–E, metapneumovirus, and RSV A and B. We have detected all the viruses included in this multiplex system in clinical samples (i.e. nasal aspirates), with the exception of the adenoviruses, for which we used laboratory positive controls. The viral sequences for the multiplex assay are listed in Table 1.
Table 1.
Unique ligation probes employed for respiratory viral detection by polymerase chain reaction–ligation detection reaction
| Virus | L1 uppercase, L2 lower case |
|---|---|
| Adenovirus A | TCCCGATATGATGCAAGATCCG |
| gtgacttttcgctcctcgcgt | |
| Adenovirus B | CCGTTACGCAGCAGTATCCGG |
| ggagtccagcgcgtgaccg | |
| Adenovirus C | TCAAAACAATGACTACAGCCCGG |
| gggaggcaagcacacagacca | |
| Adenovirus D | CCCGCGCCCACCATC |
| accaccgtcagtgaaaacgtgc | |
| Coronavirus c229e | CTAACTTTTGATAGCAATGCTTTTAGTTTGGC |
| taatgttactagttttggagattataacctttctagtgtttta | |
| Coronavirus OC43 | CCTTAGCAACAGTCATATAAGCTGGCAAAT |
| ctgccaaagaatagccagtacctagttttatacc | |
| Influenza A | ACCGTGCCCAGTGAGCGA |
| ggactgcagcgtagacgctttg | |
| Influenza B | TGGTCTCAGCTATGAACACAGCAAAAAC |
| aatgaatggaatgggaaaaggagaaga | |
| Human metapneumovirus | CTGATAAAGACTCAATAAGATTGTTTCCATGG |
| aaataattttctctcttatttaagaactgatctgttttctga | |
| Human parainfluenza 1 | TCCGAGTGTAGGAAGTGGGATAAAAATT |
| gaaaatacactcattttcctagggtacggtg | |
| Human parainfluenza 2 | TGTGGCATAATCTTCTTTCTCAGATCTTG |
| tagctacatagcaatacaagacacaacctcc | |
| Human parainfluenza 3 | TAATTGACAATATCAAGTACAATATCTTCTATGCCTG |
| atgatgcataatctgatctttcatcaactttg | |
| Human parainfluenza 4A | TTGTTACTGGTAACGGACAC |
| gtctcaaaatttgttgatcaagacaatacaat | |
| Human parainfluenza 4B | TCGTCACTGGTACTGGCAAT |
| gtctcaaaatttgttgatcaagacaatacaat | |
| Rhinovirus A, C | TGTGAAGAGCCCCGTGTGCT |
| catcttgagtcctccggcccc | |
| Rhinovirus B | GTAAGCTCACCTGATCGAACGCC |
| ctaagaacaacaagatgttactagctgttgcg | |
| RSVa | TCTTAGTGCTTTAAGAACTGGTTGGTATACTAGTGATA |
| taactatagaattaagtaatatcaaggaaaataagtgtaatggaaca | |
| RSVb | TGTTGATTTCCAACAATCTGCTGTTCTT |
| ctgctggaattctataactgtttcaatgttgga |
RSV, respiratory syncytial virus.
This article is being made freely available through PubMed Central as part of the COVID-19 public health emergency response. It can be used for unrestricted research re-use and analysis in any form or by any means with acknowledgement of the original source, for the duration of the public health emergency.
Detection of nasal aspirate cytokine protein levels
Protein levels of IFN‐γ, CXCL8/IL‐8, CXCL10/IP‐10, CCL5/RANTES, CCL11/eotaxin‐1, CCL2/MCP‐1, CCL4/MIP‐1β, CCL7/MCP‐3, CCL19/MIP‐3β, and CCL20/MIP‐3α were determined using a magnetic bead‐based multiplex immune assay (Bio‐Rad, Hercules, CA, USA). Our interest on the above CC chemokines was prompted by gene array results from RV1B‐infected, ovalbumin‐sensitized, and ‐challenged mice (data not shown). IFN‐α and IFN‐β levels were measured using standard ELISA (R&D Systems, Minneapolis, MN, USA).
Detection of nasal aspirate mRNA expression
Aspirates were homogenized and mRNA extracted as described above, using the RNEasy or the RNEasyPlus kit (Qiagen). mRNA was analysed for CXCL8/IL‐8, CXCL10/IP10, CCL5/RANTES, CCL11/eotaxin, IFN‐λ1, IFN‐λ2/3, IFN‐α, IFN‐β, ICAM‐1, TLR3, MDA‐5, RIG‐I, and IRF7 using quantitative real time PCR using specific primers and probes. Signals were normalized to GAPDH.
Fraction of exhaled nitric oxide in exhaled breath (FeNO)
We assessed FeNO in exhaled breath on 3 days during a week when the child was well, and on at least 3 days during a viral infection. To measure FeNO, we employed the NIOX MINO (Aerocrine, New Providence, NJ, USA). Because FeNO measurement can be influenced by diet and exercise, participants were asked to refrain from eating or drinking within 1 h of their exhaled breath assessment. Triplicate samples were obtained to assess reliability.
Statistical design
Mean, standard deviation and interquartile range were used to describe measured values of nasal cytokine levels, nasal mRNA, and symptom score before and during viral illnesses. Box plots were used to represent the change in biomarkers at different points of the cold relative to the baseline. Whiskers of the boxplots represent the minimum and maximum values. Distributions of these continuous outcome variables were examined and appropriate transformations taken to achieve normality. The effects of viral illness, as defined by the Seegene kit results, on biomarker protein levels, and of biomarker level on symptom score were determined using a generalized mixed models (PROC MIXED), with an auto‐regressive correlation structure using SAS statistical software (SAS, Cary, NC, USA). We evaluated and adjusted for relevant covariates such as age, gender, ethnicity/race, and nasal steroid use. Other potential explanatory variables, such as family income, baseline asthma severity, tobacco smoke exposure, and oral antihistamine use were evaluated, but not included in final models as they were not significant predictors. For all mRNA outcomes except IFN‐β, levels were undetectable in a large number of samples. We therefore categorized our results into detectable/non‐detectable levels, and analysed as a binary variable using the generalized estimating equation (GEE) approach with the Tobit link 24. We analysed IFN‐β mRNA levels as a continuous variable using the GEE approach with Identity link. Unadjusted models are shown.
Results
Study participants
Sixteen children with physician‐diagnosed asthma were recruited. Participants ranged in age from 6 to 16 years old, were 69% boys, 36% non‐white, and reported symptoms or medication use consistent with persistent asthma (Table 2).
Table 2.
Characteristics of children reported on carer questionnaire (N = 16)
| Child's age at enrolment, mean (SD) | 10.5 (3.3) |
| Female gender (%) | 5 (31.25) |
| Child's ethnicity (%) | |
| African American | 3 (18.75) |
| Arab/Middle Eastern/Chaldean | 1 (6.25) |
| Caucasian | 10 (62.5) |
| Multiracial | 2 (12.5) |
| Household annual income (%) | |
| Less than $20 000 | 4 (25) |
| $20 001–$60 000 | 6 (37.5) |
| $60 001 or more | 6 (37.5) |
| Anyone around child smokes, yes (%) | 6 (37.5) |
| Asthma severity (%) | |
| Moderate‐to‐severe | 7 (43.75) |
| Mild persistent | 6 (37.5) |
| Mild intermittent | 3 (18.75) |
| Asthma medication use (%) | |
| Inhaled corticosteroid | 13 (81.25) |
| Short acting bronchodilator only | 2 (12.5) |
| Other control medication | 1 (6.25) |
| Nasal steroid, yes (%) | 4 (25) |
| Oral‐histamine, yes (%) | 8 (50) |
This article is being made freely available through PubMed Central as part of the COVID-19 public health emergency response. It can be used for unrestricted research re-use and analysis in any form or by any means with acknowledgement of the original source, for the duration of the public health emergency.
Participant respiratory illnesses
Participants completed a total of 37 weeks of assessment (15 ‘well’ weeks; 22 ‘sick’ weeks). Of the 16 children, one child did not experience any illnesses, 11 children experienced a single illness, two children reported two illnesses, one child reported three illnesses, and one child reported four illnesses. A total of 116 lavage samples were collected (47 during the ‘well’ weeks and 69 during the ‘sick’ weeks). The concordance between family reports of symptoms and detection of virus in nasal lavage specimens using the Seegene kit was generally high. Twelve of the 15 ‘healthy weeks’ (80%) showed no viral infection, whereas three of the well weeks (20%) were virus‐positive. Six of the 22 ‘sick weeks’ (27%) showed no viral infection, whereas 16 were virus‐positive (73%). For the 15 ‘well’ and 22 ‘sick’ weeks, 3 and 16 viral infections were detected respectively (eight rhinovirus, three coronavirus, three influenza A, two influenza B, two RSV, one parainfluenza) (Table 3). The current report focuses on the 28 weeks where there was concordance between self‐reported illness and viral detection using the Seegene kit (16 virus‐positive ‘sick’ weeks, and 12 virus‐negative ‘well’ weeks).
Table 3.
Virus identification in nasal lavage specimens stratified by child self‐reported health status
| Frequency (%) | |||
|---|---|---|---|
| Healthy week | Sick week | Total | |
| Coronavirus OC43 | 0 (0) | 2 (5.4) | 2 (5.4) |
| Coronavirus 229E/NL63 | 0 (0) | 1 (2.7) | 1 (2.7) |
| Influenza A | 0 (0) | 3 (8.1) | 3 (8.1) |
| Influenza B | 0 (0) | 2 (5.4) | 2 (5.4) |
| Parainfluenza 2 | 0 (0) | 1 (2.7) | 1 (2.7) |
| Respiratory syncytial virus | 1 (2.7) | 1 (2.7) | 2 (5.4) |
| Rhinovirus A | 3 (8.1) | 6 (16.2) | 9 (24.3) |
| No virus | 12 (32.4) | 6 (16.2) | 18 (48.6) |
Data represent absolute number of weeks (percentage of total weeks).
This article is being made freely available through PubMed Central as part of the COVID-19 public health emergency response. It can be used for unrestricted research re-use and analysis in any form or by any means with acknowledgement of the original source, for the duration of the public health emergency.
We re‐tested eight positive and seven negative samples (by Seeplex) using the PCR‐ligation detection multiplex assay. Twelve of 15 samples were concordant between the two assays. Two samples were positive by Seeplex and negative by PCR‐LDR. One sample showed RSV by Seeplex assay and coronavirus OC43 by PCR‐LDR.
Symptom scores, which qualitatively evaluated the severity of illness, rose during the sick weeks (Fig. 1a). Respiratory symptoms were highest at the first assessment during sick weeks, 1–3 days after initial report of illness. Children with confirmed viral illnesses experienced significant increases in cough, wheeze, and chest tightness, indicative of asthma exacerbation (Table 4).
Figure 1.
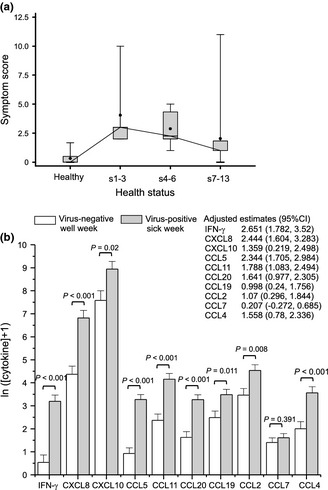
(a) Time course of symptom scores. Skeletal box and whiskers plot shows interquartile range (box), minimum and maximum observations (whiskers), and mean (closed circle). Average symptom scores during the weeks of baseline assessment, when virus was not detected, represent the healthy state. Day 1 of the viral illness was defined as the day families reported a respiratory symptoms score ≥ 2. s1–3 represents average symptoms on days 1–3 of the illness, and so on. Data for sick, virus‐positive weeks are shown. (b) Modelled effect of confirmed virus on cytokine concentration. Cytokine concentration was mathematically transformed ln (y + 1) prior to modelling and estimates are shown on this scale. Models were adjusted for age, gender, race, and nasal steroid use.
Table 4.
Report frequency of daily lower airways symptoms for concordant weeks
| Symptom | Healthy week | Sick week | P‐value |
|---|---|---|---|
| Virus‐negative | Virus‐positive | ||
| N (%) | N (%) | ||
| Cough | |||
| No | 71 (74) | 32 (27.8) | < 0.001 |
| Yes | 25 (26) | 83 (72.2) | |
| Wheeze | |||
| No | 89 (92.7) | 87 (75.7) | 0.007 |
| Yes | 7 (7.3) | 28 (24.3) | |
| Chest tightness | |||
| No | 91 (94.8) | 89 (77.4) | 0.015 |
| Yes | 5 (5.2) | 26 (22.6) | |
| Shortness of breath | |||
| No | 83 (86.5) | 93 (80.9) | 0.2 |
| Yes | 13 (13.5) | 22 (19.1) | |
This article is being made freely available through PubMed Central as part of the COVID-19 public health emergency response. It can be used for unrestricted research re-use and analysis in any form or by any means with acknowledgement of the original source, for the duration of the public health emergency.
Nasal cytokine profiles
Selected nasal aspirate cytokines were measured using magnetic bead‐based multiplex immune assay. There were significant increases in all cytokines examined during weeks of reported symptoms, with the single exception of CCL7 (Table 5, Fig. 1b). This pattern was more striking when samples with documented viral infections were compared to those confirmed to be virus‐negative. Unadjusted estimates of the association of confirmed viral infection and cytokine level were highly significant (not shown) and did not change appreciably when adjusted for age, gender, race, and nasal steroid use.
Table 5.
Cytokine levels during healthy virus‐negative and sick virus‐positive weeks
| Cytokine (pg/mL) | Healthy, virus‐negative week (n = 12) | Sick, virus‐positive week (n = 15) | ||
|---|---|---|---|---|
| Mean (SD) | Range | Mean (SD) | Range | |
| IFN‐γ | 12 (32) | 0–114 | 130 (169) | 0–497 |
| CXCL8 | 321 (514) | 22–1678 | 2839 (3631) | 61–9888 |
| CXCL10 | 7970 (14 155) | 1088–48 609 | 27 860 (32 987) | 0–140 229 |
| CCL5 | 5 (6) | 0–18 | 61 (73) | 2–265 |
| CCL11 | 27 (26.2) | 3–73 | 155 (218) | 4–695 |
| CCL20 | 11 (14.4) | 0–54 | 94 (193) | 0–997 |
| CCL19 | 35 (33) | 0–101 | 72 (78) | 0–315 |
| CCL2 | 71 (99) | 3–369 | 267 (474) | 0–2277 |
| CCL7 | 5 (5) | 0–19 | 9 (13) | 0–68 |
| CCL4 | 23 (42) | 0–220 | 156 (436) | 0–2899 |
This article is being made freely available through PubMed Central as part of the COVID-19 public health emergency response. It can be used for unrestricted research re-use and analysis in any form or by any means with acknowledgement of the original source, for the duration of the public health emergency.
Changes in cytokines over the course of the illness are shown in Fig. 2. In most cases, cytokines increased during the first 2 days of infection and persisted throughout the week.
Figure 2.
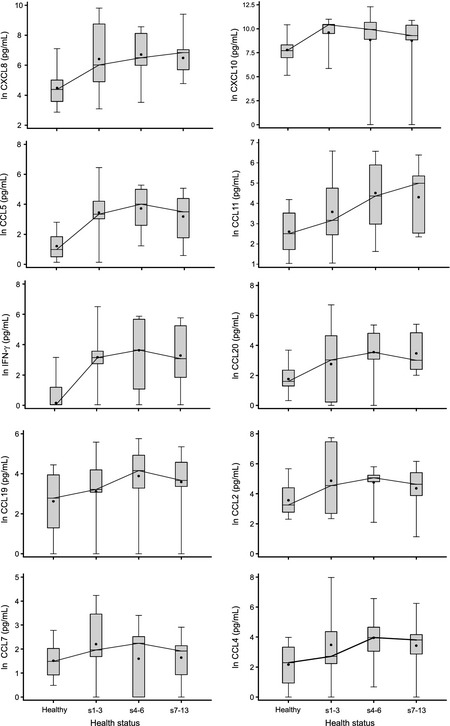
Time course of nasal lavage cytokines comparing healthy week to early (s1–2), mid (s3–6), and late (s7–12) phases of self‐reported sick periods that had a confirmed viral infection.
We also examined the relationship between cytokines and symptom score. Unadjusted estimates of the association of confirmed viral infection and cytokine level with symptom score were significant for IFN‐γ, CXCL8, CCL5, CCL20, CCL2, and CCL4 (Table 6). CXCL10, CCL11, CCL19, and CCL7 cytokine levels did not correlate with symptom score.
Table 6.
Viral presence and a subset of cytokines are independent predictors of symptom score in unadjusted models. Cytokine concentrations were mathematically transformed ln (y + 1) prior to modelling and estimates shown are on this scale
| Predictors | Estimate | P value |
|---|---|---|
| Virus_week | 2.681 | < 0.001 |
| IFN‐γ | 0.307 | 0.005 |
| CXCL8 | 0.336 | 0.011 |
| CXCL10 | −0.034 | 0.758 |
| CCL5 | 0.519 | < 0.001 |
| CCL11 | 0.266 | 0.085 |
| CCL20 | 0.376 | 0.017 |
| CCL19 | 0.220 | 0.123 |
| CCL2 | 0.504 | 0.003 |
| CCL7 | 0.394 | 0.104 |
| CCL4 | 0.418 | 0.003 |
This article is being made freely available through PubMed Central as part of the COVID-19 public health emergency response. It can be used for unrestricted research re-use and analysis in any form or by any means with acknowledgement of the original source, for the duration of the public health emergency.
We also attempted to measure IFN‐α and IFN‐β protein levels in the nasal aspirates by ELISA. IFN‐α levels over the lower detection limit (12.5 pg/mL) were found in only five of 116 specimens (all virus‐positive weeks). For IFN‐β, levels over the detection limit (25 pg/mL) were found in only 12 samples (five virus‐negative, seven virus‐positive).
Nasal aspirate mRNA levels
Many aspirates were dilute and a number of specimens showed no mRNA signal (Table 7). Nevertheless, we detected transcripts for ICAM‐1, CXCL‐10, IFN‐λ1, CXCL‐8, RIG‐I, MDA‐5, TLR3, IFNλ2/3, IRF7, IFN‐α, and IFN‐β from patients both before and during viral infections. We could not detect CCL5 and CCL11 mRNA in any specimens. Finally, infection significantly increased the number of samples that were positive for CXCL8, IFN‐λ1, IFN‐λ2/3, TLR3, RIG‐I, and IRF7 mRNA.
Table 7.
Cytokines detected by PCR from samples obtained during concordant weeks
| mRNA | Present | Healthy week virus‐negative | Sick week virus‐positive | Modelled effect of virus on cytokine detectability | |
|---|---|---|---|---|---|
| N (%) | N (%) | Odds ratioa (95% CI) | P value | ||
| ICAM‐1 | No | 15 (57.7) | 10 (25) | 2.3 (0.7, 7.6) | 0.161 |
| Yes | 11 (42.3) | 30 (75) | |||
| CXCL‐10 | No | 19 (73.1) | 11 (28.9) | 5.4 (0.9, 31) | 0.059 |
| Yes | 7 (26.9) | 27 (71.1) | |||
| IFN‐λ1 | No | 24 (92.3) | 26 (63.4) | 7.1 (1.7, 28.7) | 0.006 |
| Yes | 2 (7.7) | 15 (36.6) | |||
| CXCL‐8 | No | 7 (26.9) | 1 (2.6) | 13.7 (1.5, 130) | 0.022 |
| Yes | 19 (73.1) | 37 (97.4) | |||
| RIG‐I | No | 11 (50) | 4 (10.5) | 9.4 (1.8, 47.7) | 0.007 |
| Yes | 11 (50) | 34 (89.5) | |||
| MDA5 | No | 10 (43.5) | 8 (21.6) | 2.5 (0.5, 12.1) | 0.260 |
| Yes | 13 (56.5) | 29 (78.4) | |||
| TLR3 | No | 7 (25) | 1 (2.4) | 11.5 (1.1, 118.2) | 0.040 |
| Yes | 21 (75) | 40 (97.6) | |||
| IFNλ2/3 | No | 24 (88.9) | 26 (63.4) | 4.6 (1.1, 18.9) | 0.032 |
| Yes | 3 (11.1) | 15 (36.6) | |||
| IRF7 | No | 21 (95.5) | 19 (47.5) | 22.1 (4.5, 107.4) | < 0.001 |
| Yes | 1 (4.5) | 21 (52.5) | |||
| IFN‐α | No | 20 (89.5) | 29 (76.3) | 0.318 | |
| Yes | 2 (10.5) | 9 (23.7) | |||
| IFN‐βb | No | 2 (10.5) | 0 (0) | ||
| Yes | 20 (89.5) | 38 (100) | |||
| Mean (SD) | 2.0 (3.3) | 0.8 (1.3) | 0.111 | ||
P‐value was calculated based on the GEE method. Repeated measures were taken into account.
Data represent mean and SD of mRNA values normalized to GAPDH.
This article is being made freely available through PubMed Central as part of the COVID-19 public health emergency response. It can be used for unrestricted research re-use and analysis in any form or by any means with acknowledgement of the original source, for the duration of the public health emergency.
FeNO measurements
We measured FeNO before and during virus‐positive sick weeks (Fig. 3). There was no significant change in FeNO measurement with viral infection.
Figure 3.
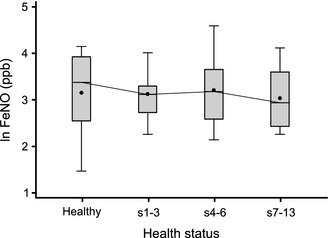
Time course of exhaled nitric oxide values. FeNO was measured using the NIOX MINO (Aerocrine, New Providence, NJ, USA).
Discussion
Viral infections are the most frequent cause of asthma attacks 1, 2, 3. In theory, chemokine production by virus‐infected epithelial cells induces the recruitment of inflammatory cells to the airways, which in turn elaborate cytokines and mediators capable of increasing airway responses. Data suggest that immune cells may also be infected by respiratory viruses and produce chemokines 7, 25, 26, 27, 28, 29, 30. In the present study, we found that, during natural colds, respiratory tract cytokine levels significantly increase in children with asthma. Levels of a subset of cytokines correlated with the degree and time course of respiratory symptoms. The chemokines detected are responsible for recruitment of a broad array of inflammatory cells including neutrophils, monocytes, macrophages, and eosinophils. Finally, we detected changes in nasal lavage specimens, which were collected at home on a repeated basis, both before and in association with infection. Although we did not measure cytokine levels in normal subjects, these data show that children with asthma are apparently capable of a robust cytokine response to viral infection, even during mild exacerbations. In addition, home collection of nasal lavage specimens appears to be a practical tool for studying the natural history of viral infection in children.
Our results expand upon prior work characterizing cytokine responses detectable in respiratory secretions of asthmatics in association with viral illnesses. Pizzichini et al. 15 found that, compared to 21 days after infection, sputum levels of CXCL8, eosinophil cationic protein and fibrinogen from six adult asthmatics were significantly elevated 4 days after the start of a cold‐induced exacerbation. Furthermore, CXCL8 levels correlated with the number of sputum neutrophils. Teran et al. asthma 16 found that, compared to asymptomatic periods, levels of major basic protein, CCL5 and CCL19 were increased in the nasal aspirates of 26 children during acute viral‐induced exacerbations. Grissell et al. asthma 17 found that compared to a group of stable asthmatics, levels of CCL5 and IL‐10 were significantly elevated in the induced sputa of older children and adults suffering from acute viral‐induced asthma exacerbations, along with neutrophils and eosinophils. CXCL8 and CCL19 were also increased, although not significantly. Finally, Santiago et al. 18 found that compared to control samples, CCL7 and CCL13 were increased in the nasal aspirates of asthmatic children 12–24 h after upper respiratory tract infections. Chemokine levels correlated with macrophages in the nasal aspirate and upper respiratory symptoms scores. In the present study, in which patients were used as their own controls, we confirmed the above changes in CXCL8, CCL5, CCL19, and CCL7, and provide new data showing significant increases in CXCL10, CCL11, CCL2, and CCL4. Importantly, we found that increases in these chemokines were sustained throughout the week following viral infection.
We also examined the relationship between cytokines and respiratory symptom score. Interestingly, we found that some cytokines correlated with symptom score (IFN‐γ, CXCL8, CCL5, CCL20, CCL2, and CCL4) whereas others did not (CXCL10, CCL11, CCL19 or CCL7). Although we did not examine lower airway cytokine levels, it is tempting to speculate that the former set of cytokines is responsible for the acute asthmatic response to viral infection, whereas the latter set may modulate future immune responses.
Based on differences in IFN‐β and IFN‐λ production between cells isolated from controls and asthmatic subjects 31, 32, 33, it has been proposed that patients with asthma are prone to rhinovirus‐induced exacerbations due to deficient IFN production On the other hand, other in vitro studies showed no differences in rhinovirus‐induced gene expression in epithelial cells isolated from asthmatic and healthy subjects 34, 35, and control and asthmatic subjects experimentally infected with rhinovirus show no difference in respiratory tract viral titre or copy number 14. We found that viral infection during natural colds significantly increased the levels of IFN‐γ protein and IFN‐λ mRNA in the nasal aspirates. Viral infection also significantly increased the expression level of RIG‐I and IRF‐7, each of which are inducible by type I IFNs 36, 37. Together, these data suggest that asthmatic children are capable of a functional IFN response. On the other hand, we failed to detect IFN‐α or IFN‐β protein in nasal aspirates, and there was no significant change in mRNA levels during natural colds. Detection of type I IFNs in respiratory secretions is made difficult by the low sensitivity of commercially available assays, physiologically low levels of these cytokines in biological fluids (particularly in fluids without sufficient numbers of plasmacytoid dendritic cells) and presence of natural inhibitors (e.g. soluble receptors). Also, we could not compare the results from our experimental subjects to children without asthma.
Our finding that IRF7 mRNA is elevated after respiratory viral infection in children with asthma is validated by a recent study analysing patterns of gene expression in nasal lavage samples from children experiencing picornavirus‐induced asthma exacerbations 38. Consistent with our previous work examining the requirement of IRF7 for rhinovirus‐induced gene expression in cultured airway epithelial cells 39, coexpression analysis demonstrated IRF7 to be a major hub connecting IFN‐mediated responses in virus‐induced asthma exacerbations.
In this study, we piloted a new PCR‐LDR‐based method for respiratory virus detection. Twelve of 15 samples were concordant between the two viral detection techniques; in two cases, samples were positive by Seeplex and negative by PCR‐LDR. The precise cause of the discrepancy between the two tests is not certain, but the Seeplex test, which relies on visual detection of bands on agarose electrophoresis gels, may be liable to false positives. We also optimized our PCR‐LDR test for maximum specificity, with the goal of avoiding false positives. This may have resulted in a reduction in sensitivity if copy number of viral nucleic acid was low.
We measured the effect of natural colds on FeNO. Previous studies have shown FeNO to be a reliable measure of eosinophilic airway inflammation, steroid responsiveness, and clinical control in children and adults with allergic asthma 40, 41, 42, 43. FeNO levels have also been shown to increase during emergency steroid treatment of acute asthma exacerbations 44, 45. In contrast, we found that despite increases in airway cytokines and respiratory symptoms, there was no increase in FeNO during natural colds in children relative to their baseline state. These data are consistent with the notion that airway inflammation in the context of viral‐induced asthma exacerbations is different in character than that associated with chronic asthma.
There are several limitations to our study. First, although nasal sampling has the advantage of increased safety and decreased participant burden, sputum specimens more closely reflect the response of the lower airways to viral infection. However, as noted above, levels of IFN‐γ, CXCL8, CCL5, CCL20, CCL2, and CCL4 significantly correlated with respiratory symptoms, including lower respiratory tract symptoms such as cough, wheeze, chest tightness, and shortness of breath, each of which are indicative of asthma exacerbation. In addition, previous studies have found similar changes in nasal aspirate and sputum cytokine concentrations following viral exacerbations of asthma 16, 17. Finally, observations demonstrate consistent effects of nasal and bronchial provocation 46.
Second, we did not measure inflammatory cells in the nasal aspirates. We therefore could not assess the functional effects of chemokine release in our subjects. Previous studies have shown recruitment of neutrophils, eosinophils, and macrophages to the respiratory tract following rhinoviral infection of asthmatic subjects 9, 15, 17, 18, 47, 48, 49, 50. Also, we cannot determine the cellular source of the mRNAs measured in our study. Pilot analysis showed primarily epithelial cells and neutrophils in the nasal aspirates, suggesting that epithelial cells were the primary source of mRNA.
Third, as noted above, we did not compare responses of asthmatic subjects to controls. A recent study showed that asthmatics and non‐atopic subjects experience similar colds, including chemokine responses, following experimental rhinovirus infection 17.
Fourth, although we were able to detect significant differences in many cytokines following upper respiratory tract infection, a fraction of the samples were too dilute to detect mRNA. (There may have been other reasons for the loss of RNA, for example sample ribonucleases). Dilution may also affect the concentration of measured biomarkers. We did not adjust measurements by total protein content, as vascular leakage due to inflammation may alter protein concentrations in children with upper respiratory infections 51. In our experience, total protein is difficult to measure in many nasal (and tracheal) aspirate specimens, even when cytokines are readily detectable, and therefore normalization for total protein does not increase the reliability of the concentrations.
Finally, studying naturally occurring colds in children using home‐based methods inherently involves some variability in sample timing and handling that is not present in the controlled environment of the laboratory. Yet this approach also offers an opportunity to observe ‘real world’ scenarios. Our ability to detect statistically significant changes in specific mRNAs and proteins using the current study design suggests that this is a viable approach for use in future investigations, for example, studies examining whether an early adjustment of asthma medications could abort or temper the impact of respiratory viral infections.
We conclude that in children with asthma, naturally occurring viral infections apparently induce a robust innate immune response including expression of specific chemokines, IFNs, and IFN‐responsive genes. Cytokine responses are sustained the first week following viral infection. Future analyses of controls and asthmatics which combine the determination of cytokine responses and asthma health outcomes will provide further insight into the cellular pathways responsible for virus‐induced asthma exacerbations.
Conflict of interests: The authors declare no conflicts of interests.
Funding
National Institutes of Health grants: R01ES016769 and UL1RR024986 (T.C.L.), R01HL081420 (M.B.H.)
Cite this as: Lewis T. C., Henderson T. A., Carpenter A. R., Ramirez I. A., McHenry C. L., Goldsmith A. M., Ren X., Mentz G. B., Mukherjee B., Robins T. G., Joiner T. A., Mohammad L. S., Nguyen E. R., Burns M. A., Burke D. T. and Hershenson M. B., Clinical & Experimental Allergy 2012. (42) 1734–1744.
References
- 1. Nicholson KG, Kent J, Ireland DC. Respiratory viruses and exacerbations of asthma in adults. Br Med J 1993; 307:982–6. [DOI] [PMC free article] [PubMed] [Google Scholar]
- 2. Johnston SL, Pattemore PK, Sanderson G et al Community study of role of viral infections in exacerbations of asthma in 9‐11 year old children. Br Med J 1995; 310:1225–9. [DOI] [PMC free article] [PubMed] [Google Scholar]
- 3. Kling S, Donninger H, Williams Z et al. Persistence of rhinovirus RNA after asthma exacerbation in children. Clin Exp Allergy 2005; 35:672–8. [DOI] [PubMed] [Google Scholar]
- 4. Domurat F, Roberts NJ, Walsh EE, Dagan R. Respiratory syncytial virus infection of human mononuclear leukocytes in vitro and in vivo . J Infect Dis 1985; 152:895–902. [DOI] [PubMed] [Google Scholar]
- 5. Bender A, Amann U, Jager R, Nain M, Gemsa D. Effect of granulocyte/macrophage colony‐stimulating factor on human monocytes infected with influenza A virus. Enhancement of virus replication, cytokine release, and cytotoxicity. J Immunol 1993; 151:5416–24. [PubMed] [Google Scholar]
- 6. Tan MC, Battini L, Tuyama AC et al. Characterization of human metapneumovirus infection of myeloid dendritic cells. Virology 2007; 357:1–9. [DOI] [PMC free article] [PubMed] [Google Scholar]
- 7. Nagarkar DR, Bowman ER, Schneider D et al. Rhinovirus infection of allergen‐sensitized and ‐challenged mice induces eotaxin release rom functionally polarized macrophages. J Immunol 2010; 185:2525–35. [DOI] [PMC free article] [PubMed] [Google Scholar]
- 8. Wang Q, Miller DJ, Bowman ER et al. MDA5 and TLR3 initiate pro‐inflammatory signaling pathways leading to rhinovirus‐induced airways inflammation and hyperresponsiveness. PLoS Pathog 2011; 7:e1002070. [DOI] [PMC free article] [PubMed] [Google Scholar]
- 9. Fraenkel DJ, Bardin PG, Sanderson G, Lampe F, Johnston SL, Holgate ST. Lower airways inflammation during rhinovirus colds in normal and in asthmatic subjects. Am J Respir Crit Care Med 1995; 151:879–86. [DOI] [PubMed] [Google Scholar]
- 10. de Kluijver J, Grunberg K, Pons D et al. Interleukin‐1beta and interleukin‐1ra levels in nasal lavages during experimental rhinovirus infection in asthmatic and non‐asthmatic subjects. Clin Exp Allergy 2003; 33:1415–8. [DOI] [PubMed] [Google Scholar]
- 11. Mosser AG, Vrtis R, Burchell L et al. Quantitative and qualitative analysis of rhinovirus infection in bronchial tissues. Am J Respir Crit Care Med 2005; 171:645–51. [DOI] [PubMed] [Google Scholar]
- 12. Message SD, Laza‐Stanca V, Mallia P et al. Rhinovirus‐induced lower respiratory illness is increased in asthma and related to virus load and Th1/2 cytokine and IL‐10 production. Proc Natl Acad Sci USA 2008; 105:13562–7. [DOI] [PMC free article] [PubMed] [Google Scholar]
- 13. Proud D, Turner RB, Winther B et al. Gene expression profiles during in vivo human rhinovirus infection: insights into the host response. Am J Respir Crit Care Med 2008; 178:962–8. [DOI] [PubMed] [Google Scholar]
- 14. DeMore JP, Weisshaar EH, Vrtis RF et al Similar colds in subjects with allergic asthma and nonatopic subjects after inoculation with rhinovirus‐16. J Allergy Clin Immunol 2009; 124:245–52. [DOI] [PMC free article] [PubMed] [Google Scholar]
- 15. Pizzichini MM, Pizzichini E, Efthimiadis A et al Asthma and natural colds. Inflammatory indices in induced sputum: a feasibility study. Am J Respir Crit Care Med 1998; 158:1178–84. [DOI] [PubMed] [Google Scholar]
- 16. Teran LM, Seminario MC, Shute JK et al. RANTES, macrophage inhibitory protein 1‐α and the eosinophil product major basic protein are released into upper respiratory secretions during virus‐induced asthma exacerbations in children. J Infect Dis 1999; 179:677–81. [DOI] [PMC free article] [PubMed] [Google Scholar]
- 17. Grissell TV, Powell H, Shafren DR et al. IL‐10 gene expression in acute virus‐induced asthma. Am J Respir Crit Care Med 2005; 172:433–9. [DOI] [PubMed] [Google Scholar]
- 18. Santiago J, Hernandez‐Cruz JL, Manjarrez‐Zavala ME et al Role of monocyte chemotactic protein‐3 and ‐4 in children with virus exacerbation of asthma. Eur Respir J 2008; 32:1243–942. [DOI] [PubMed] [Google Scholar]
- 19. National Heart, Lung and Blood Institute . National Asthma Education and Prevention Program Expert Panel Report 3: Guidelines for the diagnosis and management of asthma. Bethesda, MD: National Heart, Lung and Blood Institute, 2007. [Google Scholar]
- 20. Lewis T, Robins T, Joseph C et al. Identification of gaps in the diagnosis and treatment of childhood asthma using a community‐based participatory research approach. J Urban Health 2004; 81:472–88. [DOI] [PMC free article] [PubMed] [Google Scholar]
- 21. Lemanske RF, Jackson DJ, Gangnon RE et al. Rhinovirus illnesses during infancy predict subsequent childhood wheezing. J Allergy Clin Immunol 2005; 116:571–7. [DOI] [PubMed] [Google Scholar]
- 22. Powell KR, Shorr R, Cherry JD, Hendley JO. Improved method for collection of nasal mucus. J Infect Dis 1977; 136:109–11. [DOI] [PubMed] [Google Scholar]
- 23. Pal R, Yang M, Lin R et al. An integrated microfluidic device for influenza and other genetic analyses. Lab Chip 2005; 5:1024–32. [DOI] [PubMed] [Google Scholar]
- 24. Verbeke G, Molenberghs G. Linear mixed models for longitudinal data. Berlin: Springer‐Verlag, 2000. [Google Scholar]
- 25. Gern JE, Dick EC, Lee WM et al. Rhinovirus enters but does not replicate inside monocytes and airway macrophages. J Immunol 1996; 156:621–7. [PubMed] [Google Scholar]
- 26. Laza‐Stanca V, Stanciu LA, Message SD, Edwards MR, Gern JE, Johnston SL. Rhinovirus replication in human macrophages induces NF‐κB‐dependent tumor necrosis factor alpha production. J Virol 2006; 80:8248–58. [DOI] [PMC free article] [PubMed] [Google Scholar]
- 27. Hall DJ, Bates ME, Guar L, Cronan M, Korpi N, Bertics PJ. The role of p38 MAPK in Rhinovirus‐induced monocyte chemoattractant protein‐1 production by monocytic‐lineage cells. J Immunol 2005; 174:8056–63. [DOI] [PubMed] [Google Scholar]
- 28. Korpi‐Steiner NL, Bates ME, Lee W‐M, Hall DJ, Bertics PJ. Human rhinovirus induces robust IP‐10 release by monocytic cells, which is independent of viral replication but linked to type I interferon receptor ligation and STAT1 activation. J Leukoc Biol 2006; 80:1364–74. [DOI] [PubMed] [Google Scholar]
- 29. Johnston SL, Papi A, Monick MM, Hunninghake GW. Rhinoviruses induce interleukin‐8 mRNA and protein production in human monocytes. J Infect Dis 1997; 175:323–9. [DOI] [PubMed] [Google Scholar]
- 30. Khaitov MR, Laza‐Stanca V, Edwards MR et al. Respiratory virus induction of alpha‐, beta‐ and lambda‐interferons in bronchial epithelial cells and peripheral blood mononuclear cells. Allergy 2009; 64:375–86. [DOI] [PubMed] [Google Scholar]
- 31. Wark PAB, Johnston SL, Bucchieri F et al Asthmatic bronchial epithelial cells have a deficient innate immune response to infection with rhinovirus. J Exp Med 2005; 201:937–47. [DOI] [PMC free article] [PubMed] [Google Scholar]
- 32. Contoli M, Message SD, Laza‐Stanca V et al. Role of deficient type III interferon‐lambda production in asthma exacerbations. Nat Med 2006; 12:1023–6. [DOI] [PubMed] [Google Scholar]
- 33. Gern JE, Vrtis R, Grindle KA, Swenson C, Busse WW. Relationship of upper and lower airway cytokines to outcome of experimental rhinovirus infection. Am J Respir Crit Care Med 2000; 162:2226–31. [DOI] [PubMed] [Google Scholar]
- 34. Lopez‐Souza N, Favoreto S, Wong H et al. In vitro susceptibility to rhinovirus infection is greater for bronchial than for nasal airway epithelial cells in human subjects. J Allergy Clin Immunol 2009; 123:1384–90. [DOI] [PMC free article] [PubMed] [Google Scholar]
- 35. Bochkov YA, Hanson KM, Keles S, Brockman‐Schneider RA, Jarjour NN, Gern JE. Rhinovirus‐induced modulation of gene expression in bronchial epithelial cells from subjects with asthma. Mucosal Immunol 2009; 3:69–80. [DOI] [PMC free article] [PubMed] [Google Scholar]
- 36. Iolascon A, Volinia S, Borriello A et al. Genes transcriptionally modulated by interferon alpha2a correlate with the cytokine activity. Haematologica 2004; 89:1046–53. [PubMed] [Google Scholar]
- 37. Su Z‐Z, Sarkar D, Emdad L, Barral PM, Fisher PB. Central role of interferon regulatory factor‐1 (IRF‐1) in controlling retinoic acid inducible gene‐I (RIG‐I) expression. J Cell Physiol 2007; 213:502–10. [DOI] [PubMed] [Google Scholar]
- 38. Bosco A, Ehteshami S, Panyala S, Martinez FD. Interferon regulatory factor 7 is a major hub connecting interferon‐mediated responses in virus‐induced asthma exacerbations in vivo. J Allergy Clin Immunol 2012; 129:88–94. [DOI] [PMC free article] [PubMed] [Google Scholar]
- 39. Wang Q, Nagarkar DR, Bowman ER et al. Role of double‐stranded RNA pattern recognition receptors in rhinovirus‐induced airway epithelial cell responses. J Immunol 2009; 183:6989–97. [DOI] [PMC free article] [PubMed] [Google Scholar]
- 40. Kharitonov S, Yates D, Chung K, Barnes P. Changes in the dose of inhaled steroid affect exhaled nitric oxide levels in asthmatic patients. Eur Respir J 1996; 9:196–201. [DOI] [PubMed] [Google Scholar]
- 41. Jatakanon A, Lim S, Kharitonov SA, Chung KF, Barnes PJ. Correlation between exhaled nitric oxide, sputum eosinophils, and methacholine responsiveness in patients with mild asthma. Thorax 1998; 53:91–5. [DOI] [PMC free article] [PubMed] [Google Scholar]
- 42. Dupont LJ, Rochette F, Demedts MG, Verleden GM. Exhaled nitric oxide correlates with airway hyperresponsiveness in steroid‐naive patients with mild asthma. Am J Respir Crit Care Med 1998; 157:894–8. [DOI] [PubMed] [Google Scholar]
- 43. Gibson P, Henry R, Thomas P. Noninvasive assessment of airway inflammation in children: induced sputum, exhaled nitric oxide, and breath condensate. Eur Respir J 2000; 16:1008–15. [PubMed] [Google Scholar]
- 44. Massaro AF, Gaston B, Kita D, Fanta C, Stamler JS, Drazen JM. Expired nitric oxide levels during treatment of acute asthma. Am J Respir Crit Care Med 1995; 152:800–3. [DOI] [PubMed] [Google Scholar]
- 45. Baraldi E, Azzolin NM, Zanconato S, Dario C, Zaccbello F. Corticosteroids decrease exhaled nitric oxide in children with acute asthma. J Pediatr 1997; 131:381–5. [DOI] [PubMed] [Google Scholar]
- 46. Wang Z, Larsson K, Palmberg L, Malmberg P, Larsson P, Larsson L. Inhalation of swine dust induces cytokine release in the upper and lower airways. Eur Respir J 1997; 10:381–7. [DOI] [PubMed] [Google Scholar]
- 47. Teran LM, Johnston SL, Schroder JM, Church MK, Holgate ST. Role of nasal interleukin‐8 in neutrophil recruitment and activation in children with virus‐induced asthma. Am J Respir Crit Care Med 1997; 155:1362–6. [DOI] [PubMed] [Google Scholar]
- 48. Grunberg K, Smits HH, Timmers MC et al. Experimental rhinovirus 16 infection. Effects on cell differentials and soluble markers in sputum in asthmatic subjects. Am J Respir Crit Care Med 1997; 156:609–16. [DOI] [PubMed] [Google Scholar]
- 49. Jarjour NN, Gern JE, Kelly EAB, Swenson CA, Dick CR, Busse WW. The effect of an experimental rhinovirus 16 infection on bronchial lavage neutrophils. J Allergy Clin Immunol 2000; 105:1169–77. [DOI] [PubMed] [Google Scholar]
- 50. Grunberg K, Sharon RF, Sont JK et al. Rhinovirus‐induced airway inflammation in asthma. Effect of treatment with inhaled corticosteroids before and during experimental infection. Am J Respir Crit Care Med 2001; 164:1816–22. [DOI] [PubMed] [Google Scholar]
- 51. Frischer T, Baraldi E. Upper airway sampling. Am J Respir Crit Care Med 2000; 162:S28–30. [DOI] [PubMed] [Google Scholar]