Abstract
Purpose
To study the relationship between the appearance of the optic nerve and the retinal nerve fiber layer (RNFL) thickness determined by spectral domain optical coherence tomography (OCT).
Methods
Records from patients with spectral domain-OCT imaging in a neuro-ophthalmology practice were reviewed. Eyes with glaucoma/glaucoma suspicion, macular/optic nerve edema, pseudophakia, and with refractive errors > 6D were excluded. Optic nerve appearance by slit lamp biomicroscopy was related to the RNFL thickness by spectral domain-OCT and to visual field results.
Results
Ninety-one patients (176 eyes; mean age: 49 ± 15 years) were included. Eighty-three eyes (47%) showed optic nerve pallor; 89 eyes (50.6%) showed RNFL thinning (sectoral or average peripapillary). Average peripapillary RNFL thickness in eyes with pallor (mean ± SD = 76 ± 17 μm) was thinner compared to eyes without pallor (91 ± 14 μm, P < 0.001). Optic nerve pallor predicted RNFL thinning with a sensitivity of 69% and a specificity of 75%. Optic nerve appearance predicted RNFL thinning (with a sensitivity and specificity of 81%) when RNFL had thinned by ∼ 40%. Most patients with pallor had RNFL thinning with (66%) or without (25%) visual field loss; the remainder had normal RNFL and fields (5%) or with visual field abnormalities (4%).
Conclusions
Optic nerve pallor as a predictor of RNFL thinning showed fair sensitivity and specificity, although it is optimally sensitive/specific only when substantial RNFL loss has occurred.
Translational Relevance
Finding an acceptable relationship between the optic nerve appearance by ophthalmoscopy and spectral domain-OCT RNFL measures will help the clinician's interpretation of the information provided by this technology, which is gaining momentum in neuro-ophthalmic research.
Keywords: nerve fiber layer, optical coherence tomography, optic nerve pallor
Introduction
The ophthalmoscopic appearance of the optic nerve head is critical in the diagnosis and management of diseases of the visual pathways. Optic nerve size, color, contour, border, status of the retinal nerve fiber layer (RNFL) and of the vasculature, as well as the presence of edema, exudates, and/or hemorrhages are some of the features that are explored and often documented with fundus photography.1 The color of the optic nerve head is thought to be determined by the relationship between the amount of glial tissue and the status of the superficial vascularity of the optic nerve head.2 Damage of the retinal ganglion cells (GCs) and/or their axons anywhere in their trajectory from the retina to the central nervous system may lead to changes in optic nerve appearance, particularly the emergence of optic nerve pallor. The underlying histological abnormalities, however, are expected to become ophthalmoscopically apparent only when certain level of GC/RNFL loss or disturbance threshold level has been crossed, which in addition to the inherent subjective nature of the optic nerve exam adds complexity to the interpretation of the clinical findings.3–7 This has led to considerable efforts to try to objectively quantify the appearance of the optic nerve.8,9 Technologies such as optical coherence tomography (OCT), the Heidelberg Retina Tomograph (HRT), and scanning laser polarimetry (GDX) have permitted accurate in-vivo imaging of the RNFL and GC layer (GCL) structure.10–15
Our objective was to examine the relationship between the optic nerve appearance and the status of the RNFL as determined by OCT. Specifically, we aimed to determine how sensitive and specific is the presence of optic nerve pallor as a predictor of RNFL loss. A better understanding of the relationship between the optic nerve exam, the status of the peripapillary RNFL, and the associated visual field abnormalities should help guide further management and define the value of OCT as a complement of the neuro-ophthalmologic exam.
Methods
Subjects
The study included a retrospective review of records of all patients who underwent OCT as part of their evaluation in a neuro-ophthalmology practice from 2006 to 2012. Patients with glaucoma or glaucoma suspicion, macular and/or optic nerve edema, pseudophakia, and eyes with refractive errors greater than 6D were excluded. All patients underwent a complete ophthalmological evaluation that included the assessment of the optic nerve appearance by stereoscopic slit lamp biomicroscopy by an experienced neuro-ophthalmologist. Note was made on the presence or absence of optic nerve pallor from the record (i.e. without considering the OCT findings). No attempts were made to quantify or subcategorize the level of pallor as records did not homogeneously describe in detail this finding. Medical records were re-evaluated by an author who was blinded to the results of the OCT analysis (MAT), and the optic nerve appearance was reclassified as clinically important based on history and examination findings (from here onwards called “pathologic pallor”) or normal. That is, the definition distinguishes patients with an isolated impression of optic nerve pallor, without accompanying medical history, symptoms, or other findings suggestive of disease, from those with optic nerve pallor suspicious for optic neuropathy. Procedures followed the Declaration of Helsinki and were approved by the University of Pennsylvania Institutional Review Board.
Optical Coherence Tomography
Retinal cross-sections were obtained with two spectral domain OCT systems (Cirrus, Carl Zeiss Meditec, Inc., Dublin, CA; Spectralis, Heidelberg Engineering, Heidelberg, Germany), with a theoretical axial resolution in retinal tissue ranging from ∼ 5 to 7 μm. The clinical exam and the OCT scans took place in the same visit. Eyes with scans with low signal (cutoffs: Cirrus strength < 6; Spectralis quality < 25), or with shadows, blinks, or algorithm misfits were excluded. The average and quadrant, peripapillary RNFL thickness was estimated using each OCT instrument protocols and built-in algorithms and compared to the normative data embedded within the acquisition software. Definite peripapillary RNFL thinning was classified as those locations with thickness values falling below the 99% of normal for each device and location (total and/or quadrant). To facilitate the interpretation of the data from different systems with potential, albeit small differences in normative values, thickness estimates were additionally expressed as ratios relative to the normal mean values for each peripapillary sector for each device.16 Given the intrinsic differences in RNFL thickness for each optic nerve quadrant, this approach permits comparisons of minimum sector thicknesses independent of the absolute mean value for any given quadrant.
Relationship with Visual Function
In a subset of patients (n = 79 patients, 152 eyes), visual fields (24-2 testing strategy; Swedish Interactive Thresholding Algorithm standard protocol) were measured with the Humphrey visual field analyzer (HFA, Carl Zeiss Meditec, Inc.). Included were only those eyes with reliable test results (false positives and false negatives <33%). The relationship between regional visual field loss and the pattern of RNFL thinning was evaluated qualitatively using a retinotopic map that relates the visual field test points to positions at the optic nerve head (ONH) margin.17 Abnormal fields were those that showed at least three contiguous, nonedge points depressed to a probability level of < 5%, with one of these points depressed to < 1%. In patients without static perimetry but with available kinetic Goldmann perimetry (n = 7, 14 eyes), results were also considered abnormal if there were scotomas or depressions that were reproducible in more than one isopter; a normal Goldman visual field, however, was not entered in this analysis, as it may underestimate visual field loss.
Statistical Analysis
Results were expressed as the mean ± standard deviation (SD). Eyes were dichotomized as to whether their optic nerve head appeared pale or not on posterior segment biomicroscopy. They were also dichotomized as to whether their RNFL had fallen below the 99 percentile confidence interval (CI) for normal thickness for any of the quadrants around the nerve as defined by the normative database embedded within each of the two instruments used. The comparisons between eyes with and those without pallor were performed using two group t tests for continuous measures and using χ2 test for categorical measures. Since most patients contributed two eyes, we used the generalized estimating equations executed in the generalized linear model to account for the inter-eye correlation. To assess how RNFL thinning discriminates eyes with pallor from eyes without pallor, we calculated the sensitivity and specificity at various cut-points of RNFL thickness using pallor from clinical examination as the “gold standard,” the term used in its pure statistical sense, that is, the test or finding that is used as benchmark to establish the sensitivity/specificity of another test or exam. The optic nerve appearance has been the cornerstone of the neuro-ophthalmic exam and was chosen initially in the analysis as the gold standard. On the other hand, OCT sections correlate well with the underlying retinal histology and may be used as surrogates for a retinal biopsy (not indicated in this setting) and histologic gold standard. Results were similar when we used the alternative approach of assuming the OCT exam as the gold standard. The area under the receiver operating characteristic curve (AUC) was calculated from logistic regression model by using all possible cut-points of RNFL thickness; the 95% CI for AUC was calculated using bootstrap to accommodate the inter-eye correlation. All statistical analyses were performed using SAS version 9.3 (SAS Inc., Cary, NC), and two-sided P < 0.05 was considered to be statistically significant.
Results
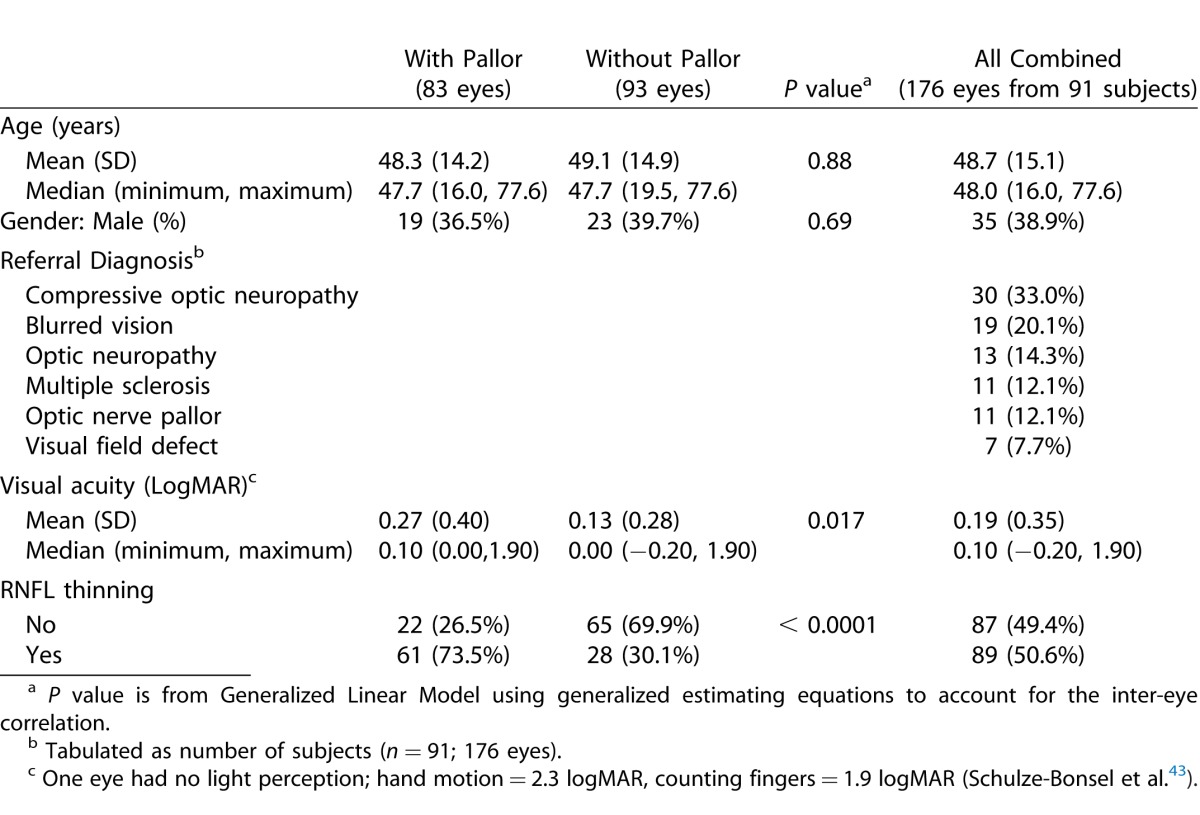
Ninety-one patients (176 eyes) met the inclusion criteria. The demographics and referral diagnoses are listed in Table 1. Optic nerve pallor was observed in nearly half the patients (48%) (Table 1). Age and gender distributions were similar in patients with or without pallor (P < 0.001, Table 1). The majority of eyes with pallor (73%) showed RNFL thinning, while the majority of patients with normally appearing nerves showed normal RNFL thickness (70%).
Table 1.
General Characteristics of the Patients/Eyes
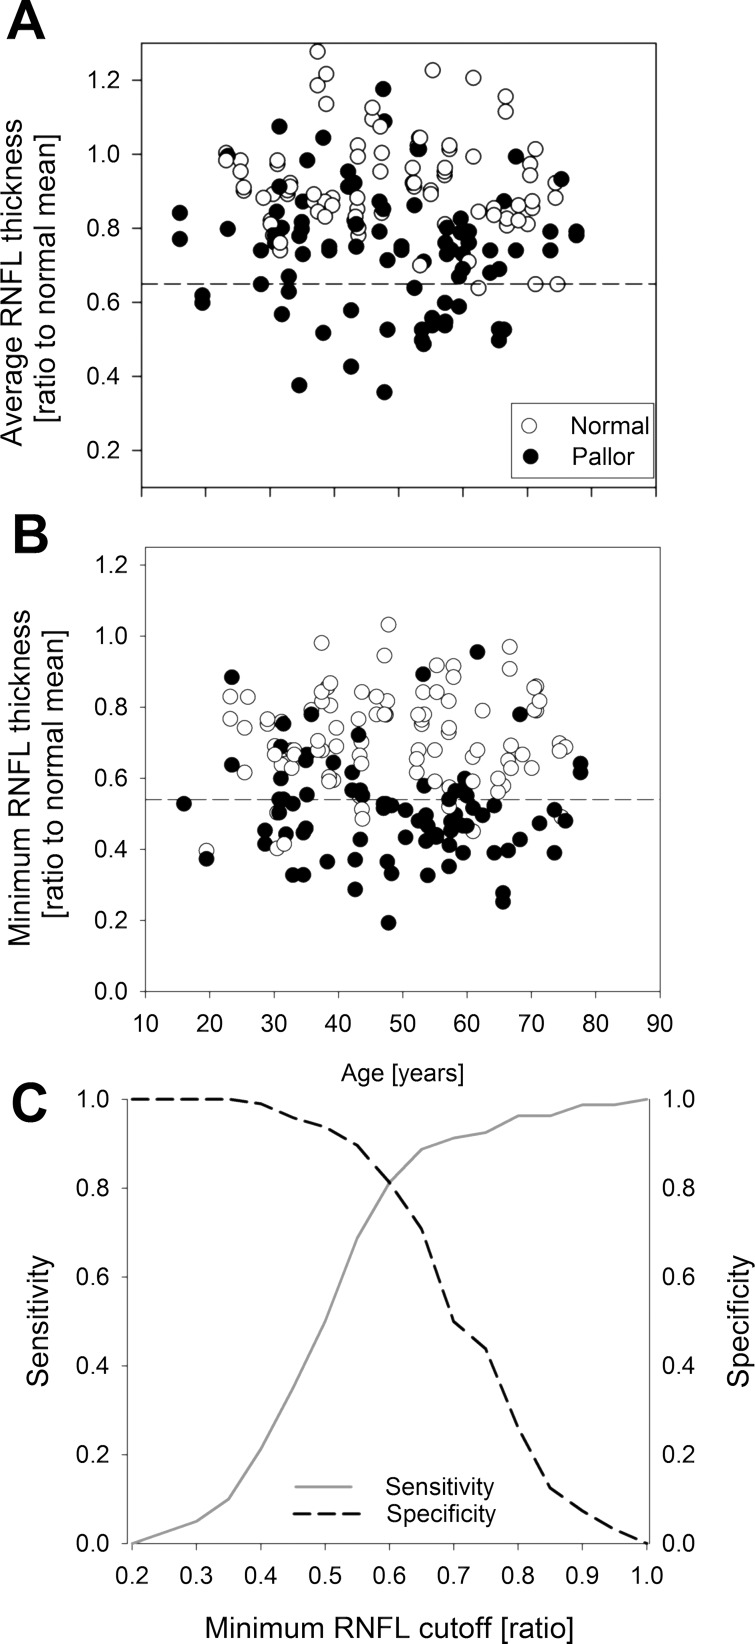
Since RNFL loss may occur in a diffuse or sectoral fashion, the relationship between the appearance of the optic nerve and the average peripapillary and sector minimum RNFL thicknesses were thus examined separately. Eyes with pallor showed thinner average peripapillary RNFL thickness (mean ± SD = 76 ± 17 μm) as compared to eyes without pallor (91 ± 14 μm, P < 0.001, Table 2). The normal RNFL thickness profile around the optic nerve shows variation in thickness due to retinotopic organization of the nerve bundles entering the optic disc and the distribution of the vascular elements near the disc margin. There is also a nonsignificant but definite variation between OCT systems in the way they image, calculate, and display the RNFL thickness profile. To circumvent these issues, we calculated the ratio for both the average peripapillary RNFL thickness and sectoral values (per quadrant) to the mean normal value for each location and OCT system, using published normative data.16 Patients with optic nerve pallor had mean peripapillary RNFL thicknesses that were on average thinner by ∼ 25% (75 ± 17% of normal mean) compared to the eyes with normally appearing nerves (91 ± 15%, P < 0.001, Table 2). Analyses of sectoral minimum values showed that patients with optic nerve pallor had sector RNFL thicknesses that were on average thinner by ∼ 50% of the normal, sector-specific, average RNFL thickness value (54 ± 16% of normal), compared with eyes with normally appearing nerves (69 ± 15%, P < 0.001, Table 2). Ratios for average peripapillary RNFL thickness (Fig. 1A) and sector RNFL thickness (Fig. 1B) plotted against age revealed that the relationship between optic nerve appearance and RNFL thickness is stronger when sectoral values were taken into consideration to define RNFL thinning as many more eyes with optic nerve pallor (Fig. 1, filled symbols) fall below the lower limit of normal RNFL thickness.
Table 2.
Comparison of RNFL Thickness Measures between Eyes with and Without Pallor
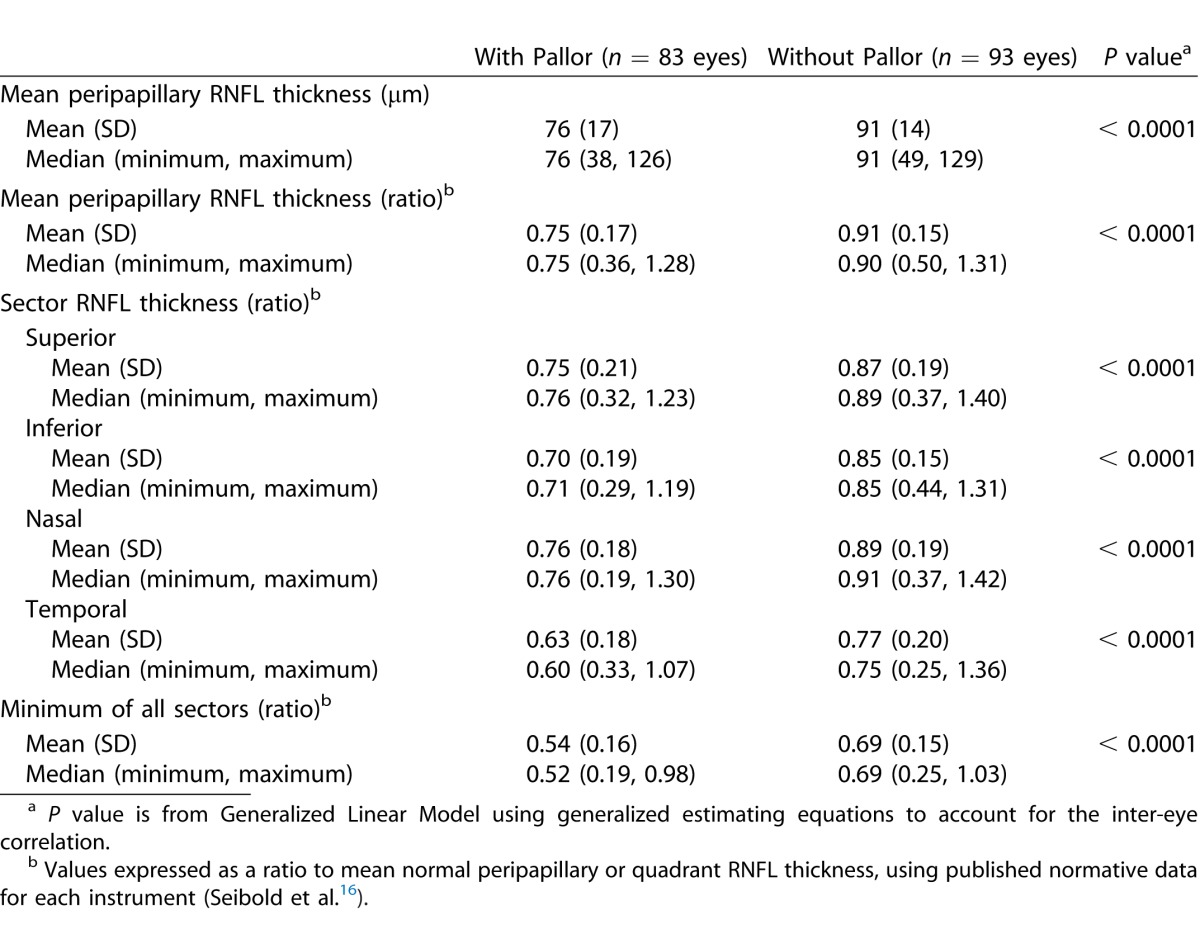
Figure 1.
Mean peripapillary (A) and minimum sector (B) RNFL thickness plotted against age for each eye for all patients who met the inclusion criteria. Values are expressed as ratios to published (Seibold et al.16) normal mean thickness for each OCT system and location (mean peripapillary and minimum sector thickness). Dashed line denotes mean −2SD for each RNFL thickness parameter. (C) The receiving operating characteristic curves for sensitivity and specificity for optic nerve pallor as a discriminator between eyes with RNFL thinning and eyes with normal RNFL.
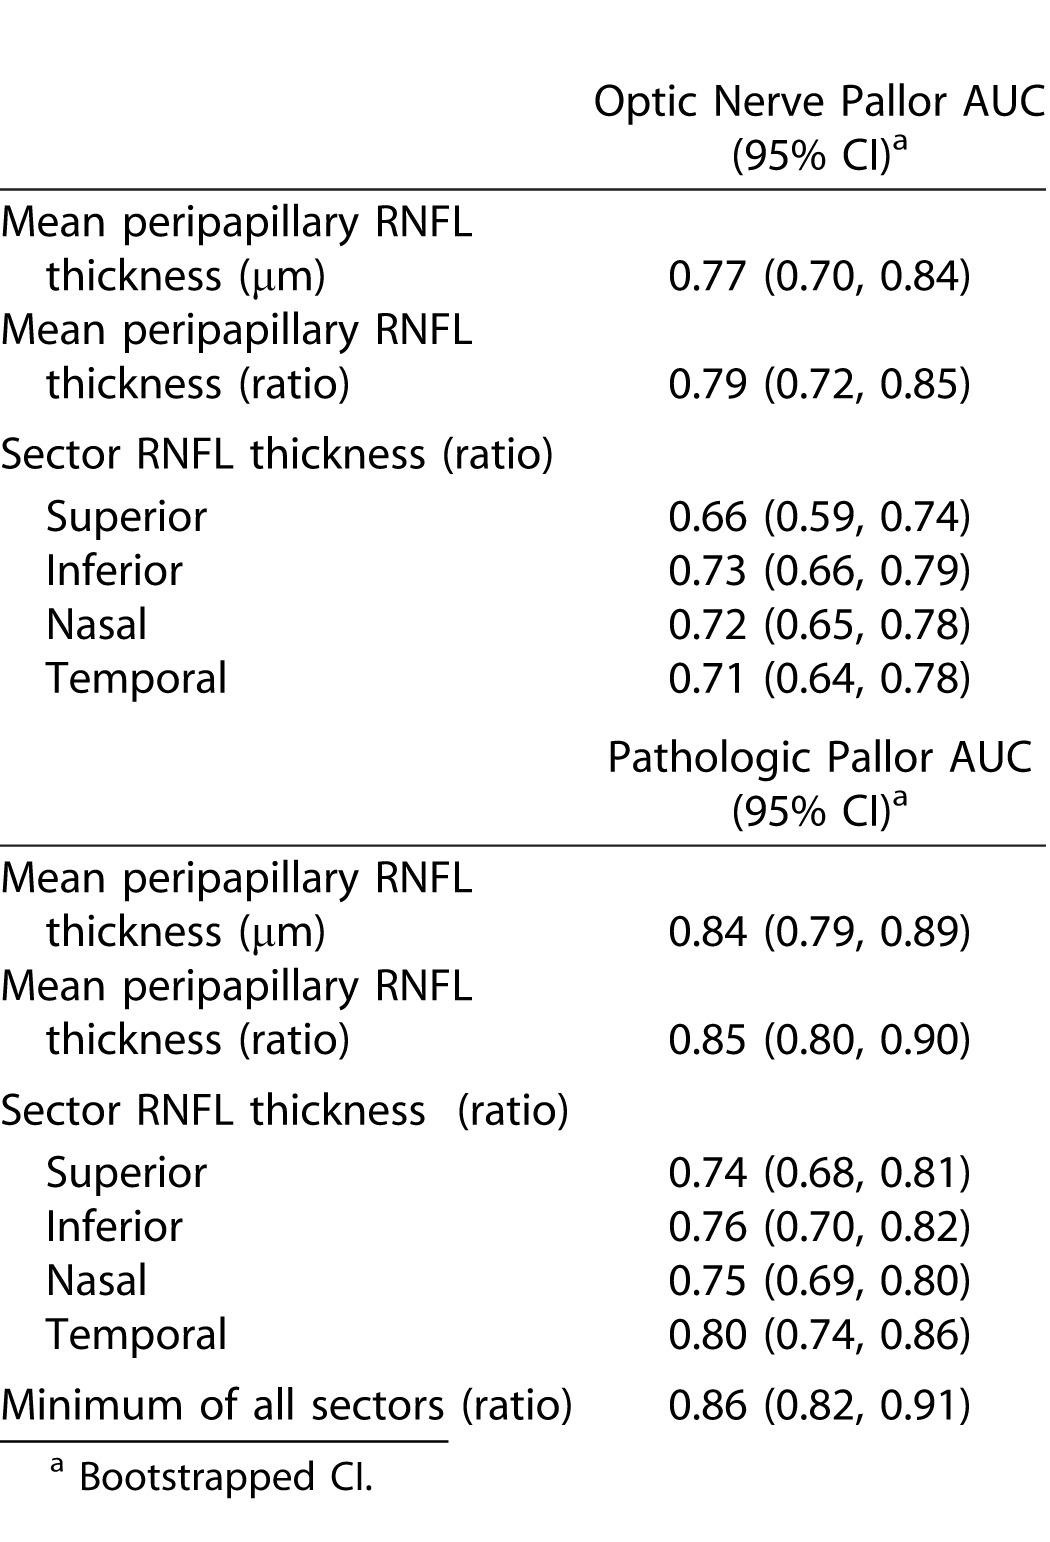
Optic nerve pallor as a predictor of RNFL thinning showed a sensitivity of 73% (95% CI = 62–83%) and a specificity of 70% (CI = 57–80%) (Table 3). When optic nerve pallor was considered to be “pathologic,” that is, due to optic neuropathy, the sensitivity and specificity improved to 81% for both (Table 3). In addition, the logistic regression analysis of minimal sector RNFL thickness also showed that pathologic pallor best predicted RNFL thinning with a sensitivity and specificity of ∼ 81% when the RNFL had lost approximately 40% of its normal sectoral thickness (AUC 0.86; 95% CI: 0.84–0.88) (Fig. 1C). Similar results were obtained if RNFL was used as the gold standard for the analysis (Table 3). Overall, the results show that significant RNFL may be lost, ranging anywhere from 25% (for average peripapillary RNFL) to 50% (for sectoral minimum RNFL values), before pallor becomes a clinically apparent sign (Fig. 1C; Table 3). There were no major differences between sectors, with the exception of the temporal quadrant, which showed slightly better power compared to the rest, while the superior sector showed the weakest predictive power (Table 4).
Table 3.
Optic Nerve Pallor as Predictor of Minimum Sector OCT RNFL Thickness
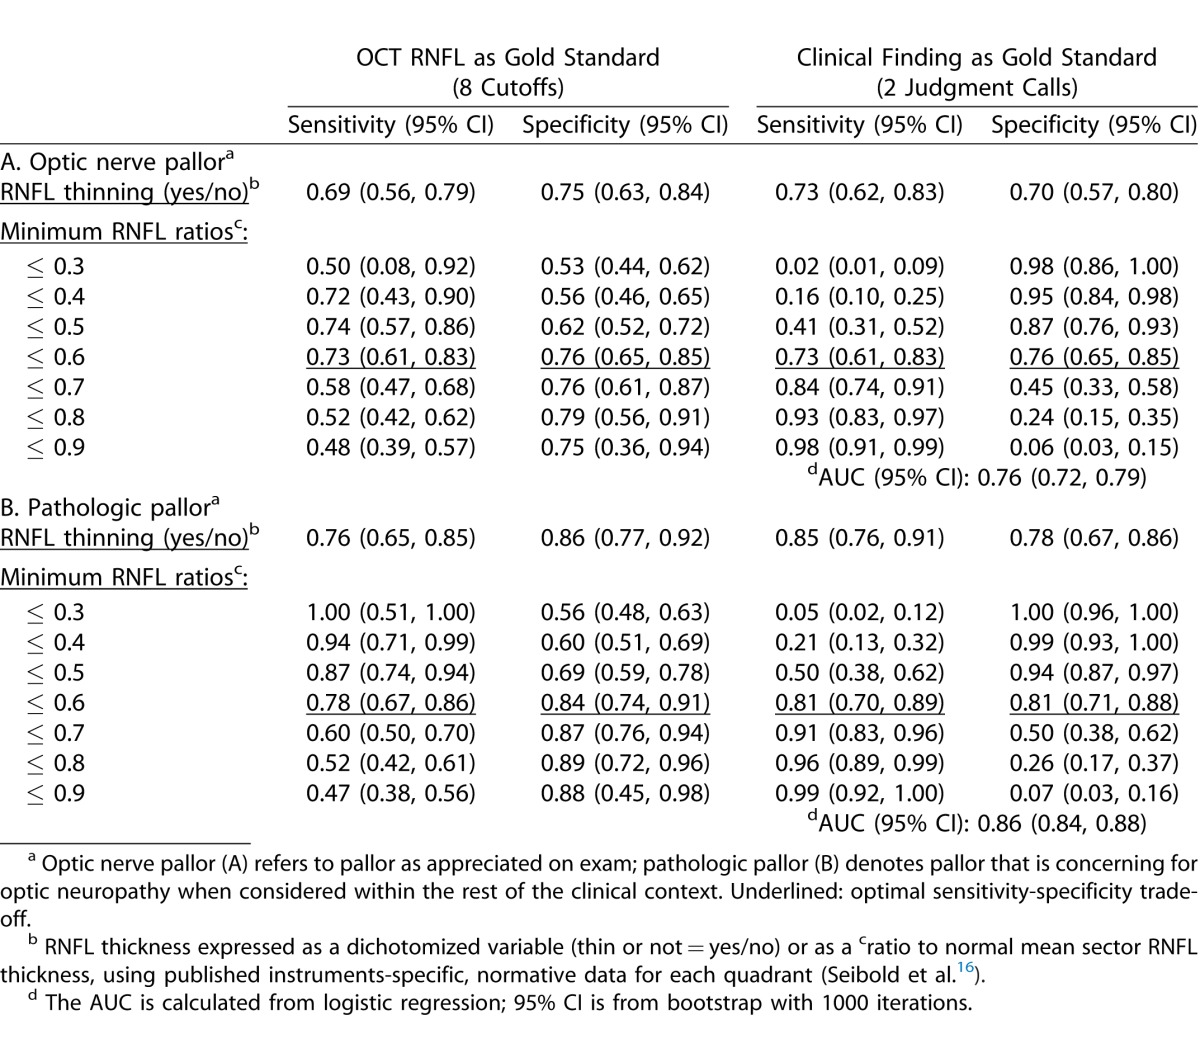
Table 4.
Power for Each RNFL Measure to Discriminate between Eyes with and Without Pallor
Visual acuity (VA) did not help to predict which nerves would show RNFL thinning. The logarithm of the angle of resolution (LogMAR) was only slightly lower in eyes with optic nerve pallor (0.27 ± 0.40), compared to those with normal appearing optic nerves (0.13 ± 0.28; P = 0.02). Eyes with optic nerve pallor and VA above 0.3 logMAR had similar mean peripapillary RNFL thickness (76.9 ± 16.7 μm) compared to those with lower VA (74.8 ± 17.7 μm, P = 0.59). Patients with pallor and VA above 0.3 logMAR had thinned to 56 ± 17% of their normal sector RNFL thickness compared to 53 ± 14% for those with VA below this level (P = 0.38).
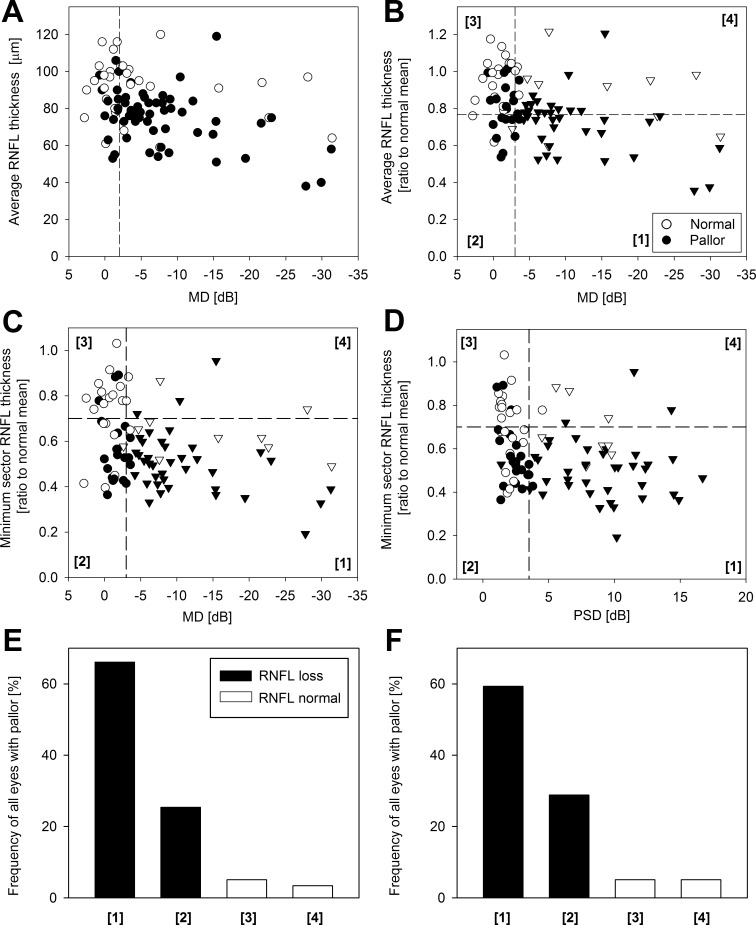
To test if visual field results could complement the OCT findings and help establish the pathologic significance of optic nerve pallor, we reviewed the visual field data from all patients who had undergone automatic static perimetry or Goldman kinetic visual fields (n = 78 patients, 152 eyes). Most eyes with pallor (69%) had RNFL thinning and associated visual field defects as determined qualitatively (see Methods), which corroborated the pathologic nature of the optic nerve appearance. Interestingly, some eyes with pallor (5%) had significant RNFL thinning without visual field defects. The remainder had pallor with normal RNFL thickness and normal visual fields (19%) or with visual field defects (7%). We next asked if there was a relationship between the optic nerve appearance, the RNFL thickness, and the magnitude of visual field abnormalities as quantified by two visual field summary parameters, the visual field mean defect (MD), and the pattern standard deviation (PSD) (Fig. 2). In general, optic nerve pallor was associated to thinner average peripapillary RNFL thickness and to greater MD values (Fig. 2A). Average peripapillary RNFL thickness expressed a ratio of the normal mean and plotted as a function of the visual field MD shows a large number of eyes with pallor distributed above and below the line that defines the lower limit of normal for RNFL thickness (Fig. 2B, filled symbols). Of interest, there were several data points with pallor and significantly abnormal MD (Fig. 2B, filled triangles) that showed a normal average peripapillary RNFL. To address this apparent lack of relationship, we examined the relationships between minimum RNFL thickness, a parameter that related better with the appearance of the optic nerve in earlier analysis (Table 4) and the two visual field parameters. Minimum RNFL thickness related much better with the optic nerve appearance of pallor and with the status of the visual field (Fig. 2C and 2D compared to Fig. 2B). A large proportion of eyes with sector RNFL thinning and pallor had significantly abnormal MD (66% of eyes with pallor) and PSD (59%) (Fig. 2C, 2D; quadrant 1). Quantitatively, a large group of eyes showed RNFL thinning and pallor but normal MD (25% of eyes) and PSD (29%), confirming the impression we had from the qualitative visual fields analysis (Fig. 2C, 2D, quadrant 2). The remainder of the eyes with pallor showed normal RNFL with (Fig. 2C, 2D, quadrant 4) or without (Fig. 2C, 2D, quadrant 3) visual field abnormalities.
Figure 2.
Relationship between RNFL thickness and visual field loss from all eyes of patients with confirmed neuro-ophthalmic disease and available visual fields. (A) Average peripapillary RNFL thickness in microns plotted as a function of MD. Eyes with pathologic pallor are denoted with filled symbols. (B) Average peripapillary RNFL thickness expressed as a ratio to the normal mean value for each respective OCT system (Seibold et al.16) plotted as a function of MD. Dashed lines delimit the normal range. Limit is set at −3 dB for MD and at normal mean −2SD for average peripapillary thickness. The resulting four quadrants represent the following relationships: (1) eyes with significant RNFL thinning and abnormal visual field parameter, (2) RNFL thinning with visual field parameter within normal limits, (3) normal RNFL and visual field, and (4) RNFL within normal limits but abnormal visual field. (C, D) Minimum sector RNFL thickness plotted as a function of MD (C) and PSD (D) values. Triangles represent data points with significantly abnormal (to a level <0.05%) visual field parameters, as determined by the Humphrey field analyzer software. Horizontal dashed lines represent the lower limit for (normal mean −2SD) minimum sector RNFL thickness. Vertical dashed line represents the lower limit of the normal range for MD (−3 dB) and PSD (3.5 dB). (E, F) Proportion of eyes with optic nerve pallor that fall in each of the four quadrants as plotted in (C) and (D) that define the four relationships between minimum sector RNFL thickness and MD (E) and PSD (F).
Discussion
Evaluation for anterior visual pathway disease depends on the examination of the optic nerve in conjunction with visual function testing, such as visual fields. In combination they are usually sufficient to guide management decisions, including the need for additional diagnostic testing, such as neuroimaging. The finding of optic nerve pallor and/or established peripapillary nerve fiber bundle defects on a biomicroscopic posterior segment examination provides objective evidence for damage. However, many patients referred for neuro-ophthalmological evaluation represent true diagnostic dilemmas. Examples are situations in which there is only subtle optic nerve pallor in the setting of nonspecific visual complaints or visual field defects, or when patients are referred to screen for subclinical (radiological) compressive optic neuropathies. Optic nerve color is known to be variable and modified by multiple variables, which may be unrelated to optic nerve axonal health.9,18,19 In addition, the assessment of the optic nerve appearance is often complicated by changes in the media, such as the presence of cataracts or pseudophakia, as well as by the existence of associated morbidity, such as glaucomatous optic neuropathy.20 OCT RNFL measurements are particularly useful in equivocal situations caused by such variables.
Our study found that optic nerve pallor had a sensitivity and specificity of approximately 70% as a predictor of RNFL loss. The sensitivity and specificity of this clinical sign increased to 81% if the optic nerve appearance of pallor was pathologic. These estimates are similar or slightly above previously reported estimates, likely representing the impact of the methodology used to evaluate the optic nerve by neuro-ophthalmologists. That is, a stereoscopic, slit-lamp examination that yields a better resolved image of the nerve and peripapillary region may be more concordant with the RNFL loss detected by OCT.5,21
By logistic regression analysis, we found that the sensitivity and specificity of the optic nerve appearance as a predictor of RNFL loss becomes optimal at approximately 81% only when RNFL has thinned to approximately 40% of the normal mean value. An earlier study using a different approach found increased sensitivity of optic nerve appearance as a predictor of RNFL loss when a similar degree of RNFL loss had occurred.21 Thus there is potentially a large group of patients with neuro-ophthalmologic conditions with subclinical RNFL loss, a situation that has been long recognized in glaucomatous optic neuropathy, who may or may not exhibit ophthalmoscopically visible changes.7,22
Visual dysfunction is commonly associated with neuro-ophthalmologic disorders. Lower VA, however, did not predict RNFL thickness, as eyes with lower acuities had very similar thickness compared to eyes with better acuity. In our study we used available, high contrast Snellen acuity estimates, which do not correlate as well to RNFL thickness as compared to contrast sensitivity or to VA measured with low-contrast optotypes.15 Another explanation may be found in the heterogeneous composition of our sample in terms of disease conditions and stages of disease progression, where loss of papillomacular axons and central vision may not be necessarily expected.
Sensitivity loss, as measured by automatic static perimetry, is expected to relate with RNFL thinning.2,12,17,23,24 As noted in our previous analysis, optic nerve pallor is expected to predict sectoral or average peripapillary RNFL thinning with a sensitivity and specificity of approximately 70%. Interestingly, a proportion of the patients with a normal optic nerve appearance and normal visual fields by static perimetry showed RNFL loss. This is not an unusual outcome in glaucomatous optic neuropathy.4,7,22,25–28 OCT RNFL measures may be particularly useful in such situations to determine, for example, if further neuro-ophthalmic evaluation, neuroimaging, or more refined psychophysic and/or electrophysiologic testing is warranted. Retinal GCL and inner retinal measurements have long been used to assess for trans-neuronal degeneration in hereditary photoreceptor degenerations.29 The impact that GCL loss or injury has on other neurons within the visual pathway may be exploited so that earlier neuro-ophthalmic disease stages are diagnosed and treated.13,30–34 Exploration of such interrelationships may complement the traditional measurement of the RNFL thickness and is gaining momentum in the neuro-ophthalmic literature.34,reviewed in 35 Refinement of noninvasive methods of assessment of the retinal GCL and axons will hopefully lead to interventions that will stop or ameliorate those changes before neuronal loss takes place.13,31
There was also a group of eyes with pallor and definite visual field defects that did not show RNFL thinning. It is important to note that RNFL measurements can be normal in patients with prior optic neuropathies. In such patients, the falsely “normal” OCT can underestimate the amount of axonal loss due to, for example, inner retinal thickening. The RNFL signal measured by OCT is composed not only of GC axons, but also by interstitial microglia and vascular elements. There were examples in our series where an abnormally appearing nerve, accompanied by reproducible visual field defects, was not associated with RNFL loss. After ruling out a retinal origin for such vision loss, such as photoreceptor loss, and assuming that vascular elements, edema, or epiretinal membranes are not causing a RNFL overestimate, one may consider a thickened inner retina.36 Glial changes at the optic nerve head have been proposed as an explanation for changes in the appearance and color of the optic nerve head.19 Thus, subtle changes in coloration of the optic nerve head may be the only sign of a reactive glial response. There is growing in-vivo evidence of inner retinal thickening likely representing inner retinal remodeling that is distinct from edema following neuronal loss in human hereditary retinal degenerations.37,38 There is also accumulating evidence supporting GCL/RNFL thickening from activation of resident retinal microglia following diverse optic nerve insults leading.39,40 It is thus conceivable that at some stage of axonal injury, a process similar to the remodeling response seen in retinal degenerations may lead to inner retinal thickening and to an underestimate of the amount of axonal loss by OCT. The subgroup of patients/eyes that departed from the expected relationships, however, was not large enough for us to establish statistically meaningful comparisons with the rest of the patients. Expanding the sample size in future studies will help explain the apparent discrepancies.
The present study's objective was to define the relationship between the optic nerve appearance of pallor and the status of the RNFL by spectral domain-OCT. The retrospective design of our study is a major limitation of our work. For example, many patients with obvious optic nerve changes and convincing visual field changes may have not undergone fundus imaging, either with photography or by spectral domain-OCT, as the clinical exam may have been deemed sufficient enough in those situations. The estimates of sensitivity and specificity would have likely been better if such cases had been included. In a similar fashion, the indication for visual field testing may have been directed by a strong clinical need to rule out occult optic neuropathy or to confirm dubious clinical exam findings. This can obviously impact our estimates of the relationship between pallor, RNFL, and the presence of visual field defects. The role that ancillary testing, such as visual fields, has in increasing the diagnostic accuracy of the clinical exam as a predictor of RNFL measurements may be better addressed in a prospective manner as has been done for specific optic neuropathies.41,42 It is also expected that the relationship may depend on the pathophysiologic process in place. We set to explore the relationships between OCT parameters and the optic nerve appearance, as assessed by an expert neuro-ophthalmologist in the imperfect, real-life, referral-based, clinical setting. We excluded patients with known variables that affect the optic nerve appearance, such as the presence of pseudophakia, and used a simplified, dichotomized scheme where we asked the simple question—is the optic nerve pale or not as determined by an experienced clinician? The interobserver or intraobserver agreement in the assessment of the optic nerve appearance could not be explored with our study design, nor was the impact that different disease processes may have in such assessment. Prospective studies using multiple neuro-ophthalmologists as observers are needed to address the impact that these factors may have on the relationships explored in our work.
In conclusion our results show that optic nerve pallor has a sensitivity and specificity that nears ∼ 70% as a sign of RNFL thinning in the hands of ophthalmologist with specialized neuro-ophthalmology training. Optic nerve appearance, however, only reaches an optimal trade-off of sensitivity and specificity after a substantial (40%) RNFL loss has occurred. Spectral domain-OCT RNFL thickness measurements is an important complement in the interpretation of the optic nerve appearance, particularly when there is pallor or suspicion of optic neuropathy in the presence of normal appearing nerves and/or intact visual fields. There may be situations, however, where RNFL thickness may be falsely within normal limits despite clinical evidence for optic neuropathy. Prospective studies with the inclusion of large number of patients with diverse neuro-ophthalmologic conditions are needed to further elucidate the role that RNFL measurements and of other noninvasive imaging modalities have in specific neuro-ophthalmological scenarios.
Acknowledgments
Supported by grants from Hope for Vision. Thanks are due to Alexander M. Sumaroka and Alejandro J. Roman for their critical help.
Disclosure: T.S. Aleman, None; J. Huang, None; S.T. Garrity, None; S.B. Carter, None; W.D. Aleman, None; G.-S. Ying, None; M.A. Tamhankar, None
References
- 1.Liu GT, Volpe NJ, Galetta SL. Neuro-Ophthalmology: Diagnosis and Management. 2nd ed. Philadelphia, PA: WB Saunders Company;; 2010. pp. 7–36. [Google Scholar]
- 2.Harwerth RS, Quigley HA. Visual field defects and retinal ganglion cell losses in patients with glaucoma. Arch Ophthalmol. 2006;124:853–959. doi: 10.1001/archopht.124.6.853. [DOI] [PMC free article] [PubMed] [Google Scholar]
- 3.Frisen L, Hoyt WF. Insidious atrophy of retinal nerve fibers in multiple sclerosis. Funduscopic identification in patients with and without visual complaints. Arch Ophthalmol. 1974;92:91–97. doi: 10.1001/archopht.1974.01010010097001. [DOI] [PubMed] [Google Scholar]
- 4.Sommer A, Katz J, Quigley HA, et al. Clinically detectable nerve fiber atrophy precedes the onset of glaucomatous field loss. Arch Ophthalmol. 1991;109:77–83. doi: 10.1001/archopht.1991.01080010079037. [DOI] [PubMed] [Google Scholar]
- 5.Cettomai D, Hiremath G, Ratchford J, et al. Associations between retinal nerve fiber layer abnormalities and optic nerve examination. Neurology. 2010;75:1318–1325. doi: 10.1212/WNL.0b013e3181f735bd. [DOI] [PMC free article] [PubMed] [Google Scholar]
- 6.Huang XR, Bagga H, Greenfield DS, Knighton RW. Variation of peripapillary retinal nerve fiber layer birefringence in normal human subjects. Invest Ophthalmol Vis Sci. 2004;45:3073–3080. doi: 10.1167/iovs.04-0110. [DOI] [PubMed] [Google Scholar]
- 7.Lisboa R, Paranhos A, Jr, Weinreb RN, Zangwill LM, Leite MT, Medeiros FA. Comparison of different spectral domain OCT scanning protocols for diagnosing preperimetric glaucoma. Invest Ophthalmol Vis Sci. 2013;54:3417–3425. doi: 10.1167/iovs.13-11676. [DOI] [PMC free article] [PubMed] [Google Scholar]
- 8.Davies EWG. Quantitative assessment of colour of the optic disc by a photographic. Exp Eye Res. 1970;9:106–113. doi: 10.1016/s0014-4835(70)80064-1. [DOI] [PubMed] [Google Scholar]
- 9.Miller JM, Caprioli J. Videographic quantification of optic disc pallor. Invest Ophthalmol Vis Sci. 1988;29:320–323. [PubMed] [Google Scholar]
- 10.Moura FC, Medeiros FA, Monteiro ML. Evaluation of macular thickness measurements for detection of band atrophy of the optic nerve using optical coherence tomography. Ophthalmology. 2007;114:175–181. doi: 10.1016/j.ophtha.2006.06.045. [DOI] [PubMed] [Google Scholar]
- 11.Contreras I, Rebolleda G, Noval S, Munoz-Negrete F. Optic disc evaluation by optical coherence tomography in nonarteritic anterior ischemic optic neuropathy. Invest Ophthalmol Vis Sci. 2007;48:4087–4092. doi: 10.1167/iovs.07-0171. [DOI] [PubMed] [Google Scholar]
- 12.Hood DC, Anderson S, Rouleau J, et al. Retinal nerve fiber structure versus visual field function in patients with ischemic optic neuropathy. A test of a linear model. Ophthalmology. 2008;115:904–910. doi: 10.1016/j.ophtha.2007.06.001. [DOI] [PMC free article] [PubMed] [Google Scholar]
- 13.Choi SS, Zawadzki RJ, Keltner JL, Werner JS. Changes in cellular structures revealed by ultra-high resolution retinal imaging in optic neuropathies. Invest Ophthalmol Vis Sci. 2008;49:2103–2119. doi: 10.1167/iovs.07-0980. [DOI] [PMC free article] [PubMed] [Google Scholar]
- 14.Costello FE, Klistorner A, Kardon R. Optical coherence tomography in the diagnosis and management of optic neuritis and multiple sclerosis. Ophthalmic Surg Lasers Imaging. 2011;42((suppl)):S28–40. doi: 10.3928/15428877-20110627-03. [DOI] [PubMed] [Google Scholar]
- 15.Sakai RE, Feller DJ, Galetta KM, Galetta SL, Balcer LJ. Vision in multiple sclerosis: the story, structure-function correlations, and models for neuroprotection. J Neuroophthalmol. 2011;31:362–373. doi: 10.1097/WNO.0b013e318238937f. [DOI] [PMC free article] [PubMed] [Google Scholar]
- 16.Seibold LK, Mandava N, Kahook MY. Comparison of retinal nerve fiber layer thickness in normal eyes using time-domain and spectral-domain optical coherence tomography. Am J Ophthalmol. 2010;150:807–814. doi: 10.1016/j.ajo.2010.06.024. [DOI] [PubMed] [Google Scholar]
- 17.Garway-Heath DF, Poinoosawmy D, Fitzke FW, Hitchings RA. Mapping the visual field to the optic disc in normal tension glaucoma eyes. Ophthalmology. 2000;107:1809–1815. doi: 10.1016/s0161-6420(00)00284-0. [DOI] [PubMed] [Google Scholar]
- 18.Snydacker D. The normal optic disc. Ophthalmoscopic and photographic studies. Am J Ophthalmol. 1964;58:958–964. [PubMed] [Google Scholar]
- 19.Hayreh SS. The 1994 Von Sallman Lecture. The optic nerve head circulation in health and disease. Exp Eye Res. 1995;61:259–272. doi: 10.1016/s0014-4835(05)80121-6. [DOI] [PubMed] [Google Scholar]
- 20.Cox MJ, O'Brien C. Comparison of computer-assisted versus manual optic nerve head pallor measurement. Invest Ophthalmol Vis Sci. 1992;33:3169–3173. [PubMed] [Google Scholar]
- 21.Pula JH, Kattah JC, Wang H, Marshall J, Eggenberger ER. Ability of a neuro-ophthalmologist to estimate retinal nerve fiber layer thickness. Clin Ophthalmol. 2012;6:1477–1481. doi: 10.2147/OPTH.S34573. [DOI] [PMC free article] [PubMed] [Google Scholar]
- 22.Quigley HA, Dunkelberger GR, Green WR. Retinal ganglion cell atrophy correlated with automated perimetry in human eyes with glaucoma. Am J Ophthalmol. 1989;107:453–464. doi: 10.1016/0002-9394(89)90488-1. [DOI] [PubMed] [Google Scholar]
- 23.Ferreras A, Pablo LE, Garway-Heath DF, Fogagnolo P, García-Feijoo J. Mapping standard automated perimetry to the peripapillary retinal nerve fiber layer in glaucoma. Invest Ophthalmol Vis Sci. 2008;49:3018–3025. doi: 10.1167/iovs.08-1775. [DOI] [PubMed] [Google Scholar]
- 24.Asaoka R, Russell RA, Malik R, Crabb DP, Garway-Heath DF. A novel distribution of visual field test points to improve the correlation between structure-function measurements. Invest Ophthalmol Vis Sci. 2012;53:8396–8404. doi: 10.1167/iovs.12-9794. [DOI] [PubMed] [Google Scholar]
- 25.Mikelberg FS, Yidegiligne HM, Shulzer M. Optic nerve axon count and axon diameter in patients with ocular hypertension and normal visual fields. Ophthalmology. 1995;102:342–348. doi: 10.1016/s0161-6420(95)31019-6. [DOI] [PubMed] [Google Scholar]
- 26.Harwerth RS, Carter-Dawson L, Shen F, Smith EL., III Ganglion cell losses underlying visual field defects from glaucoma. Invest Ophthalmol Vis Sci. 1999;40:2242–2250. [PubMed] [Google Scholar]
- 27.Kerrigan-Baumrind LA, Quigley HA, Pease ME, et al. Number of ganglion cells in glaucoma eyes compared with threshold visual field tests in the same persons. Invest Ophthalmol Vis Sci. 2000;41:741–748. [PubMed] [Google Scholar]
- 28.Harwerth RS, Quigley HA. Visual field defects and retinal ganglion cell losses in patients with glaucoma. Arch Ophthalmol. 2006;124:853–859. doi: 10.1001/archopht.124.6.853. [DOI] [PMC free article] [PubMed] [Google Scholar]
- 29.Aleman TS, Soumittra N, Cideciyan AV, et al. CERKL mutations cause an autosomal recessive cone-rod dystrophy with inner retinopathy. Invest Ophthalmol Vis Sci. 2009;50:5944–5954. doi: 10.1167/iovs.09-3982. [DOI] [PubMed] [Google Scholar]
- 30.Calabresi PA, Balcer LJ, Frohman EM. Retinal pathology in multiple sclerosis: insight into the mechanisms of neuronal pathology. Brain. 2010;133:1575–1577. doi: 10.1093/brain/awq133. [DOI] [PMC free article] [PubMed] [Google Scholar]
- 31.Huang XR, Zhou Y, Kong W, Knighton RW. Reflectance decreases before thickness changes in the retinal nerve fiber layer in glaucomatous retinas. Invest Ophthalmol Vis Sci. 2011;52:6737–6742. doi: 10.1167/iovs.11-7665. [DOI] [PMC free article] [PubMed] [Google Scholar]
- 32.Walter SD, Ishikawa H, Galetta KM, et al. Ganglion cell loss in relation to visual disability in multiple sclerosis. Ophthalmology. 2012;119:1250–1257. doi: 10.1016/j.ophtha.2011.11.032. [DOI] [PMC free article] [PubMed] [Google Scholar]
- 33.Fernandes DB, Raza AS, Nogueira RG, et al. Evaluation of inner retinal layers in patients with multiple sclerosis or neuromyelitis optica using optical coherence tomography. Ophthalmology. 2013;120:387–394. doi: 10.1016/j.ophtha.2012.07.066. [DOI] [PMC free article] [PubMed] [Google Scholar]
- 34.Saidha S, Sotirchos ES, Oh J, et al. Relationships between retinal axonal and neuronal measures and global central nervous system pathology in multiple sclerosis. JAMA Neurol. 2013;70:34–43. doi: 10.1001/jamaneurol.2013.573. [DOI] [PMC free article] [PubMed] [Google Scholar]
- 35.Kardon RH. Role of the macular optical coherence tomography scan in neuroophthalmology. J Neuroophthalmol. 2011;31:353–361. doi: 10.1097/WNO.0b013e318238b9cb. [DOI] [PMC free article] [PubMed] [Google Scholar]
- 36.Hood DC, Anderson SC, Wall M, Raza AS, Kardon RH. A test of a linear model of glaucomatous structure-function loss reveals sources of variability in retinal nerve fiber and visual field measurements. Invest Ophthalmol Vis Sci. 2009;50:4254–4266. doi: 10.1167/iovs.08-2697. [DOI] [PMC free article] [PubMed] [Google Scholar]
- 37.Aleman TS, Cideciyan AV, Sumaroka A, et al. Inner retinal abnormalities in X-linked retinitis pigmentosa with RPGR mutations. Invest Ophthalmol Vis Sci. 2007;48:4759–4765. doi: 10.1167/iovs.07-0453. [DOI] [PMC free article] [PubMed] [Google Scholar]
- 38.Aleman TS, Cideciyan AV, Sumaroka A, et al. Retinal laminar architecture in human retinitis pigmentosa caused by Rhodopsin gene mutations. Invest Ophthalmol Vis Sci. 2008;49:1580–1590. doi: 10.1167/iovs.07-1110. [DOI] [PMC free article] [PubMed] [Google Scholar]
- 39.Fairless R, Williams SK, Hoffmann DB, et al. Preclinical retinal neurodegeneration in a model of multiple sclerosis. J Neurosci. 2012;32:5585–5597. doi: 10.1523/JNEUROSCI.5705-11.2012. [DOI] [PMC free article] [PubMed] [Google Scholar]
- 40.Ho JK, Stanford M, Shariati MA, Dalal R, Liao YJ. Optical coherence tomography study of experimental anterior ischemic optic neuropathy and histologic confirmation. Invest Ophthalmol Vis Sci. 2013;54:5981–5988. doi: 10.1167/iovs.13-12419. [DOI] [PMC free article] [PubMed] [Google Scholar]
- 41.Hood DC, Anderson SC, Wall M, Raza AS, Kardon RH. A test of a linear model of glaucomatous structure-function loss reveals sources of variability in retinal nerve fiber and visual field measurements. Invest Ophthalmol Vis Sci. 2009;50:4254–4266. doi: 10.1167/iovs.08-2697. [DOI] [PMC free article] [PubMed] [Google Scholar]
- 42.Aggarwal D, Tan O, Huang D, Sadun AA. Patterns of ganglion cell complex and nerve fiber layer loss in nonarteritic ischemic optic neuropathy by Fourier-domain optical coherence tomography. Invest Ophthalmol Vis Sci. 2012;53:4539–4545. doi: 10.1167/iovs.11-9300. [DOI] [PMC free article] [PubMed] [Google Scholar]
- 43.Schulze-Bonsel K, Feltgen N, Burau H, Hansen L, Bach M. Visual acuities “hand motion” and “counting fingers” can be quantified with the Freiburg visual acuity test. Invest Ophthalmol Vis Sci. 2006;47:1236–1240. doi: 10.1167/iovs.05-0981. [DOI] [PubMed] [Google Scholar]


