

Abstract
The intracellular transport of Mason-Pfizer monkey virus (M-PMV) assembled capsids from the pericentriolar region to the plasma membrane (PM) requires trafficking of envelope glycoprotein (Env) to the assembly site via the recycling endosome. However, it is unclear if Env-containing vesicles play a direct role in trafficking capsids to the PM. Using live cell microscopy, we demonstrate, for the first time, anterograde co-transport of Gag and Env. Nocodazole disruption of microtubules had differential effects on Gag and Env trafficking, with pulse-chase assays showing a delayed release of Env-deficient virions. Particle tracking demonstrated an initial loss of linear movement of GFP-tagged capsids and mCherry-tagged Env, followed by renewed movement of Gag but not Env at 4 h post-treatment. Thus, while delayed capsid trafficking can occur in the absence of microtubules, efficient anterograde transport of capsids appears to be mediated by microtubule-associated Env-containing vesicles.
Keywords: M-PMV, Envelope, Gag, Anterograde transport, Cytoskeleton, Live cell-imaging
Introduction
Intracellular targeting and transport of virus structural components is critical to efficient retrovirus replication. In most retro-viruses, the nascent Gag polyproteins are transported directly to the plasma membrane where assembly of the capsid shell and membrane extrusion occurs simultaneously. Viruses that undergo this form of type-C morphogenesis include the pathogenic human viruses, human immunodeficiency virus and human T-cell leukemia virus (HIV and HTLV-I, respectively). In contrast to type-C morphogenesis, M-PMV, the prototypic type-D retrovirus, exhibits spatial and temporal separation of capsid assembly, intracellular transport and budding. The Gag polyprotein is first targeted to an intracytoplasmic pericentriolar site where capsid assembly occurs (Choi et al., 1999; Sakalian and Hunter, 1999; Sfakianos et al., 2003). An 18 amino acid sequence in the matrix domain (MA) of Gag polyprotein, termed the cytoplasmic targeting/retention signal (CTRS), is critical for directing intracytoplasmic assembly of the MPMV immature capsids to the pericentriolar region, through its interaction with the dynein light chain Tctex-1 (Vlach et al., 2008). A single amino acid change of arginine to tryptophan (R55W) within the CTRS results in loss of this interaction and the switch of type-D morphogenesis to type-C morphogenesis (Rhee and Hunter, 1990a, 1990b, 1991; Vlach et al., 2008). Additional mutagenesis studies in this laboratory have also shown that certain single or multiple amino acid changes within MA can abrogate transport from the assembly site, redirect budding to intracellular vesicles, block later stages of transport or prevent capsid interactions with the plasma membrane (Rhee and Hunter, 1991; Stansell et al., 2004, 2007).
While functional domains within the Gag polyprotein precursor have been found to play important roles in capsid assembly and intracellular transport, they invariably involve interactions with multiple host cell components. Indeed, the site of M-PMV capsid assembly, the microtubule organizing center (MTOC), anchors a number of cellular components, such as the chaperonin TRiC, that are involved in capsid assembly (Brown et al., 1996; Hong et al., 2001). The MTOC also serves as a focal point of interaction between M-PMV capsids and envelope glycoprotein (Env), which along with components of the pericentriolar recycling endosome, are required for efficient export of preassembled Gag to the plasma membrane (Sfakianos and Hunter, 2003; Sfakianos et al., 2003). In these previous studies, we demonstrated that expression of a provirus lacking the env gene resulted in accumulation of Gag in the pericentriolar region and a 7-fold decrease in the kinetics of capsid release when compared to wild-type. Furthermore, temperature block experiments that inhibit vesicular trafficking have suggested that Env-containing vesicles may be required for transport of assembled capsids from the pericentriolar region, and that this is dependent on a functional recycling endosome. Mutations in Rab11 GTPase, an enzyme that regulates recycling trafficking, and the inhibition of membrane tubule formation with the phospholipase A2 enzymes inhibitor ONO-RS-082 both result in decrease in virion release (Sfakianos and Hunter, 2003; Sfakianos et al., 2003; Ullrich et al., 1996).
Thus, while experimental studies to-date argue that passage of Env through the recycling endosome is critical for efficient M-PMV virion release, details of intracellular capsid transport that occur prior to release remain unclear. Although co-localization between Gag and Env vesicles has been demonstrated in the pericentriolar cytoplasmic region in fixed cells, questions remain as to whether these interactions are sustained to yield anterograde co-transport of Gag and Env, or if Env facilitates the transfer of pre-assembled capsids to an anterograde trafficking network. Studies involving protein structural analyses, yeast two-hybrid and GST pull-down experiments have demonstrated that M-PMV Gag interacts in a CTRS-dependent manner with cellular Tctex-1 (Vlach et al., 2008), a light chain of the dynein motor complex, suggesting a microtubule-dependent mode of retrograde transport of Gag to the pericentriolar region for capsid assembly. In addition, utilizing a green fluorescent protein (GFP)-tagged Gag construct we have obtained preliminary evidence that microtubules are involved in intracellular transport of assembled capsids. Studies that have explored the function of microtubules and plus-ended motors in anterograde transport of various virus proteins (Hollinshead et al., 2001; Jouvenet et al., 2004; Lee et al., 2006; Martinez et al., 2008; Miranda-Saksena et al., 2000; Sathish et al., 2009; Suomalainen et al., 1999) have demonstrated an absolute dependence on this cytoskeletal network for virus trafficking. Microtubule-independent transport of viruses has, thus far, been reported primarily for adenovirus proteins, and this movement is mostly directed towards the cell nucleus (Glotzer et al., 2001; Yea et al., 2007). In the current study, live cell imaging analysis provides, for the first time, direct evidence for intracellular anterograde co-transport of M-PMV Gag and Env. Furthermore, a comprehensive analysis of microtubules, actin and intermediate filaments by live cell microscopy and/or pulse-chase biochemical experiments demonstrate that Gag–Env co-transport and release is essentially microtubule-dependent. However, novel and striking differences in trafficking and release patterns were observed for Gag and Env following microtubule depolymerization, shedding light on the nature of their interactions with host cell trafficking components.
Results
Microtubule disruption causes a significant decrease in the kinetics of M-PMV production from CMMT cells
To evaluate the role of microtubules, actin filaments and IF in intracellular transport of M-PMV, pulse-chase assays were performed to determine how the disruption of one or more of these cytoskeletal networks influences the kinetics of M-PMV transport and release. An advantage of pulse-chase time course assays is that Gag proteins can be tracked from the stages of synthesis and assembly to the point of release. Furthermore, since M-PMV capsid movement can be bidirectional, which we have detailed by live imaging (Clark et al., in press), pulse-chase assays ensure that the net direction of intracellular M-PMV capsid transport being studied is indeed anterograde. As indicated by the experimental outline in Fig. 1A, CMMT cells, chronically infected with M-PMV, were pulse-labeled for 30 min with [35S]-methionine and then chased in radiolabel-free media for 0, 2, 3, and 4 h. Cytoskeletal inhibitors were added to CMMT cells at the beginning of the chase, with 10 μM nocodazole, 2.5 μM cytochalasin D, or 5 mM acryla-mide (ACR), being used to disrupt microtubules, actin filaments, and IF, respectively. Immunostaining of fixed CMMT cells with rhodamine phalloidin and Alexa 488-conjugated anti-alpha tubu-lin confirmed the disruptive effects of cytochalasin D and noco-dazole, with complete depolymerization of actin (Fig. 1B, left panel) and microtubules (Fig. 1B, middle panel) being evident after 4 h of treatment with these drugs. Immunostaining with FITC-conjugated anti-vimentin (Fig. 1B, right panel) revealed major alterations in IF organization after 4 h of ACR treatment, which has been reported before (Durham, 1986; Griffin et al., 1983; Kumar et al., 2007). Treatment with ACR caused a collapse of vimentin fibers, leading to fiber bundling and a less extensive IF network, as well as cell shrinkage and the formation of cell retraction fibers (white arrows, Fig. 1B, right panel). Importantly, ACR treatment was also found to depolymerize actin filaments in CMMT cells, which likely contributed to cell retraction (data not shown). Similar effects were noted when cells were treated with 1% ββ′-iminodipropionitrile (IDPN), which is also commonly used to disrupt IF (data not shown).
Fig. 1.

Cytoskeleton disruption in CMMT cells. (A) Schematic of pulse-chase assay (quantitated in Fig. 2) illustrating the timing of treatment with cytoskeleton-disrupting drugs during the chase. (B) Immunofluorescence microscopy confirming disruption of actin filaments (left panel), microtubules (middle panel) and IF (right panel) after 4 h of treatment with 2.5 μM cytochalasin D, 10 μM nocodazole, or 5% ACR, respectively. Bar=15 μm.
Cell lysates and culture media were collected from these drug-treated cells and untreated controls at the indicated time points during the chase. M-PMV Gag gene products from the collected samples were immunoprecipitated as described in Materials and methods section, subjected to SDS-PAGE and imaged using a phosphor screen. The kinetics of Gag precursor processing was determined by acquiring band intensities for Gag (Pr78), Gag–Pro (Pr95), Gag–Pro–Pol (Pr180) and capsid (p27) and then calculating the percentage of Pr78 and p27 relative to the sum of these proteins at each time point (Fig. 2A, left panel). Data for untreated cells are represented by the black line, while the blue, green and red lines represent results for treatment with nocodazole, cyto-chalasin D or ACR, respectively. Dual treatment with nocodazole and ACR is indicated by the gray line. A comparison of virus release at 2 h and 4 h during the chase was also performed by calculating the ratio of Gag precursor proteins from pulse-labeled cells that were shed as capsid protein (p27) (Fig. 2A, right panel). As shown in the left panel of Fig. 2A, the half-life of Gag precursor processing of Pr78 to p27 in untreated CMMT cells was 1 h 30 min. When CMMT cells were treated with nocodazole after the pulse, a delay of approximately 1 h was noted for the half-life, as compared to the untreated control. A statistically significant decrease (p=0.0027) in virion release was also noted after 2 h of nocoda-zole treatment (Fig. 2A, right panel). Despite this initial delay, the absolute levels of p27 continued to increase (Fig. 2A) and at later time points during nocodazole treatment, were eventually found to reach levels near those observed for untreated cells.
Fig. 2.
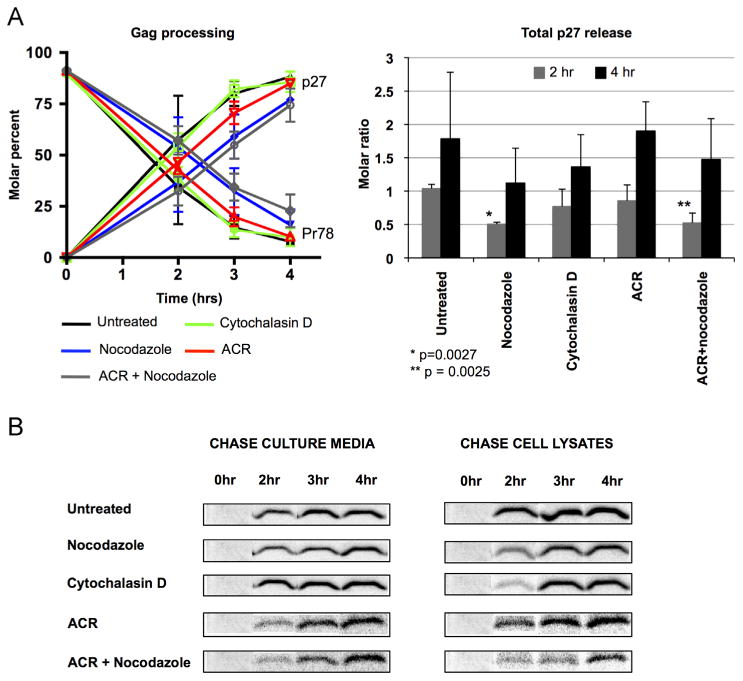
Effect of microtubule, actin or IF disruption on the kinetics of Gag precursor processing and virion release. CMMT cells were metabolically labeled with [35S] methionine and then chased for 0, 2, 3, and 4 h in the absence or presence of indicated drugs.(A) Data shown illustrates the molar percent of Pr78 and p27 at each time point (left panel) from untreated cells (black lines) or those treated with cytochalasin D (green lines), nocodazole (blue lines), ACR (red lines) or nocodazole and ACR (gray lines), which were added at the beginning of the chase. The right panel indicates the molar ratio of p27 that was released at 2 h (gray bars) and 4 h (black bars) after the indicated drug treatments. The stars indicate a significant statistical difference of p < 0.05 (paired t-test) when compared to the untreated control. (B) Time-course autoradiographs illustrating p27 capsid protein released from untreated cells or those treated with indicated drugs. Data shown is representative of five independent assays.
In contrast to what was observed for nocodazole-treated cells, treatment with cytochalasin D had a negligible effect on the kinetics of Gag processing. The effects of ACR treatment, which disrupt both IF and actin filaments, were also minimal but a 30 min delay in Gag precursor processing was noted when compared to untreated and cytochalasin D-treated CMMT cells (Fig. 2A). Differences in the levels of virion release are also evident in the autoradiographs in Fig. 2B which illustrates p27 protein immunoprecipitated from chase culture media and cell lysates during treatment with the indicated cytoskeletal inhibitors. For purposes of clarity, only p27 bands from each set of untreated or treated CMMT cells are shown, and these were digitally re-assembled without modification to better indicate p27 levels at specific time points. It is important to note that while levels of both cell-associated (cell lysates) and cell-free (culture media) capsid protein are shown here, the sum of these p27 levels is used in quantitative analyses as a more accurate indicator of capsid release, since previous studies have shown that cleavage of Gag requires particle budding and release from the cell. Interestingly, when all three cytoskeleton networks were simultaneously compromised using a combination of nocodazole and ACR (or IDPN), Gag processing and virion release from CMMT cells still occurred at the reduced rates observed for CMMT cells treated with nocodazole alone (Fig. 2A and B). Of note, similar results were obtained from pulse-chase assays utilizing the alternative cytoskeleton inhibitors, taxol and latrunculin B, which stabilizes microtubules and depoly-merizes actin filaments, respectively (data not shown), confirming that our observations are the result of disruptive effects on these specific cytoskeletal components. A leaky release of virions from the cytoplasm due to possible side effects of these drug treatments on the integrity of the plasma membrane is unlikely, since as described above efficient Gag precursor processing to p27 by the viral protease can only occur when the capsid undergoes completion of the budding process (Parker and Hunter, 2001; Yasudo and Hunter, 1998). Thus, in summary, the most pronounced effects on Gag processing and virus output involved microtubule disruption, although virus release still occurred, albeit at a delayed rate, in the absence of three major functional cytoskeletal networks.
M-PMV virions released from nocodazole-treated CMMT cells lack Env
Since the most pronounced effect on M-PMV Gag release was observed following microtubule disruption, a pulse-chase assay was also performed to determine the effects on Env after nocodazole treatment. Since Env precursor Pr86 and its processed protein products gp70, gp22 and gp20 all have relatively low methionine content, [3H]-leucine was utilized for efficient radiolabeling of these proteins. M-PMV Gag and Env proteins were then immunoprecipi-tated from pulse cell lysates, 5 h chase cell lysates and chase culture media with a goat anti-M-PMV polyclonal antibody as described in Materials and methods section. As shown in Fig. 3, the level of the Env protein products gp70 and gp20 in virions released from nocodazole-treated cells is significantly reduced when compared to the level of Env in virions released from the untreated control. The band, with a molecular mass of 78 kDa that is observed in the chase media from nocodazole-treated cells is residual Gag Pr78, which is also detected in COS-1 cells expressing an env-gene deleted M-PMV provirus (Fig. 3, right panel). Quantitation of the radioactivity associated with the region of the gel encompassing gp70 demonstrated a more than 60% reduction in area under the curve for virions from nocodazole treated cells, although again the sharpness of the peak is consistent with this residual radiolabel being in Pr78 (Supplementary Fig. 1). Analysis of the levels of Env precursor Pr86 in the CMMT chase cell lysates, showed increased intensity in this band in treated cells, consistent with a two- to three-fold decrease in Env processing in the presence of nocodazole. In addition, a small increase in the intensity of gp70 and gp22 was observed in treated cells (Fig. 3, chase lysates), suggesting that whatever precursor was cleaved remained cell associated. The disruption of actin or intermediate filaments had negligible effects on Env processing and release (data not shown).
Fig. 3.

Microtubule disruption leads to a deficiency in Env incorporation in released virions. Autoradiography of CMMT cells that were metabolically labeled with [35H] leucine for 30 min and chased in non-radioactive media for 5 h with or without nocodazole. Indicated are the major Gag precursors Pr78 and Pr95 and the processed product p27, and the Env precursor Pr86 and its processed products gp70, gp22 and gp20. To better illustrate Pr86, lysates of COS-1 cells that were transfected with a ΔEnv plasmid construct are also shown. Data shown is representative of three independent experiments.
Live cell imaging of nocodazole-treated CMMT cells reveals a loss in linear movement of M-PMV Gag and Env
Although results from the pulse-chase assays provide strong evidence for a predominant, but non-essential, role for microtubules in M-PMV capsid release, this approach does not define the actual effect on intracellular capsid transport over the course of nocodazole treatment. In addition, it provides no indication of whether virion release is the result of co-transport or independent trafficking of Gag and Env. Live cell microscopy experiments were therefore performed to gain a real time perspective of capsid and Env movements before and during nocodazole treatment. Using live-cell microscopy, M-PMV-producing CMMT cells were visualized in real time approximately 7 h post-transfection with a plasmid construct expressing codon-optimized M-PMV Gag–GFP (pSARM–GagGFP–M100A; Clark et al., in press). Analysis at this early time point allows for a balance between the level of detectable GFP signal and the number of Gag– GFP particles that is statistically relevant for velocity measurements. Visualization at this time point also increases the likelihood that the observed fluorescent capsids are newly synthesized and are not endocytosed particles. M-PMV capsids containing Gag–GFP were observed as dynamic green fluorescent puncta, with many exhibiting plus-ended movement towards the cell periphery (Movie S1). In cells that were co-transfected with plasmids expressing Gag–GFP, and mCherry fused to the microtubule subunit tubulin, a few distinct Gag–GFP particles were observed to move linearly along microtu-bules that were visible as red dynamic tubular structures (Movie S1, Supplementary Fig. 2). As we described previously (Clark et al., in press), bidirectional movement and occasional stalling of Gag–GFP particles was often noted, which is typical for microtubule motor-based movement given that switching of cargo between minus- and plus-ended motors tends to occur (Hendricks et al., 2010; Ross et al., 2008; Shah et al., 2000). These data are thus consistent with the pulse-chase experiments suggesting a role for microtubules in capsid transport. In contrast, live imaging of CMMT cells stained with actin-RFP and transfected with the plasmid expressing Gag– GFP revealed a lack of linear movements along actin filaments, suggesting limited utilization of this cytoskeletal network for long range transport (Movie S2), which is also in agreement with results from the pulse-chase experiments.
Supplementary data associated with this article can be found in the online version at http://dx.doi.org/10.1016/j.virol.2013.11.006.
Imaging was then performed on CMMT cells co-transfected with plasmids expressing Gag–GFP and Env–mCherry before and during nocodazole treatment. Cells were imaged every 5 s for a total of 2 min. As shown in Movie S3, in addition to the green Gag– GFP and red Env–mCherry particles that were observed to exhibit movement independent of each other, a large fraction of yellow, co-localized Gag–Env puncta were observed, illustrating, for the first time, intracellular co-transport of Gag and Env. To assess the pattern of the path taken by these particles, their movement in untreated CMMT cells was tracked using the ImageJ plug-in MTrackJ, which allows for individual particle tracking. Only particles that exhibited movement towards or near the plasma membrane were considered. In general, the Env-containing vesicles with associated Gag (yellow) exhibited long, linear trajectories, while the individual Gag–GFP (green) and Env–mCherry (red) puncta, exhibited similar but shorter trajectories (Movie S3 and Fig. 4A, left panel). The movement of some of each type of particle was also observed to be bi-directional.
Fig. 4.

Nocodazole treatment leads to a transient decrease in linear movement of intracellular capsids. CMMT cells were co-transfected with pSARM–GagGFP–M100A and pTML-Env–mCherry and visualized in real time with a Deltavision deconvolution microscope. Live imaging of untreated cells and those treated with nocodazole for 2 h and 4 h was performed. Videos were recorded over a 2 min time period, with each video having an identical frame rate of five frames per second.(A) Illustration of tracks for Gag–GFP (green), Env–mCherry (red) and co-localized Gag–Env particles (yellow) in untreated and nocodazole-treated cells. Tracks shown are for particles moving towards or near the plasma membrane, with arrow heads indicating direction of movement. Data shown is representative of at least five independent imaging experiments. Bars=15 μm. See accompanying Movies S2–S4 for real time visualization of particle tracking. (B) Maximum velocity measurements of Gag–GFP particles (n ≥ 15), Env– mCherry particles (n ≥ 10) and co-localized Gag–Env particles (n ≥ 23) in untreated cells and nocodazole-treated cells after 2 h and 4 h of drug treatment. A minimum of 5 cells was analyzed at each time point. Bars indicate median values. Statistical significance is denoted by p value or ns (not significant).
Supplementary data associated with this article can be found in the online version at http://dx.doi.org/10.1016/j.virol.2013.11.006.
When cells were monitored 2 h after nocodazole treatment, a dramatic effect on intracellular movement was observed and linear tracks were essentially absent for all particles (Movie S4 and Fig. 4A, middle panel). Thus, an intact microtubule network is critical for intracellular trafficking at this time after initiation of nocodazole treatment. Surprisingly, after 4 h of nocodazole treatment, movement of a majority of Gag–GFP particles was again evident, as shown by the green tracks (Movie S5 and Fig. 4A, right panel). The movement of these Gag–GFP particles was non-linear and was found to occur throughout the cell, including the periphery. In sharp contrast, this was not the case for Env–mCherry and co-localized Gag–Env vesicles, which remained static at this later time point. Given that Env-containing vesicles would be predicted to move linearly exclusively on microtubules, this observation confirms microscopic evidence that microtubules remained depolymerized at this time.
Supplementary data associated with this article can be found in the online version at http://dx.doi.org/10.1016/j.virol.2013.11.006.
To further characterize particle movement, the velocity of Gag– GFP, Env–mCherry and Gag–Env vesicles in untreated cells (n=5) and cells treated with nocodazole for 2 h (n=5) and 4 h (n=5) was calculated, also using MTrackJ. As shown in Fig. 4B, Gag–GFP particles in untreated cells exhibited a median maximum velocity of approximately 0.5 μm/s, which is within the range of what has been previously described for microtubule-based movement (Bremner et al., 2009; Gazzola et al., 2009; Lee et al., 2006). While this velocity decreased substantially (at least five-fold) to less than 0.1 μm/s in cells treated with nocodazole for 2 h, a significant (p < 0.0001) three-fold recovery to a median velocity of approximately 0.3 μm/s was observed in cells after 4 h of nocodazole treatment. This recovered movement, however, has a significantly lower (p < 0.0001) median velocity in the 4-h nocodazole-treated cells compared to what is observed in untreated cells. In contrast, Env–mCherry particles and co-localized Gag–Env particles in untreated CMMT cells initially demonstrated median maximum velocities of 0.5 μm/s and 0.6 μm/s, respectively, that was reduced to < 0.1 μm/s upon nocodazole treatment, but did not exhibit any recovery in velocity after nocodazole treatment at the 4 h time point, which is consistent with the particle track patterns visualized by live imaging. To account for cell-to-cell variability, single cell analysis was also performed in which Gag–GFP particle movement in the same cell was monitored pre- and post-treatment with nocodazole. Results obtained were similar to those observed for the multi-cell analysis described above (data not shown), and importantly the observed changes in the velocity and track patterns of Gag–GFP, Env–mCherry and Gag–Env particles during nocodazole treatment are in agreement with results acquired from the pulse-chase assays described above, which demonstrated a delay in Gag release and also a lack of Env incorporation in released M-PMV capsids. Similar imaging experiments performed for cytochalasin D-treated cells and ACR-treated cells revealed no significant changes in capsid velocities, though it should be noted that treatment with these drugs distorted cell morphology substantially, therefore making it difficult to accurately monitor capsid movement in live cells (data not shown).
M-PMV capsid movement in 4 h nocodazole-treated CMMT cells appears to utilize a directed mode of transport
Since our results demonstrated a clear, albeit staggered and short-range movement of M-PMV capsids containing Gag–GFP after 4 h of nocodazole treatment, it was important to define whether this motion was random diffusion in the cytoplasm or directed transport. A property of particle movement that is commonly utilized for this purpose is mean squared displacement (MSD), which is the average distance a given particle travels in a defined period of time. Importantly, it takes into account the distance that is traveled relative to the particle's starting position, thereby helping to distinguish between random and productive movement. To obtain MSD values, particle trajectories were first generated using the ImageJ plug-in Particle Detector and Tracker, which allows for the automated and simultaneous selection of multiple fluorescent particles in live cells, based on user-defined parameters, as described in Materials and Methods section. Trajectories were generated for randomly selected particles (n=20) for each group of untreated CMMT cells (n=4) and 4 h nocodazole-treated cells (n=5), and the MSD for each time interval (Δt) within the trajectory was calculated (see Materials and methods section). Using these values, curves relating MSD to time were generated for each of the 40 total particle trajectories. A typical particle trajectory and corresponding graph is illustrated in Fig. 5A. Separation of the curve into phases indicates a change in the type of movement over the course of the trajectory. Once converted to a log–log scale (Fig. 5B), the slope of each phase confers a numerical value to the type of movement, with values of 1 representing Brownian motion, and values > 1 or < 1 indicating directed and obstructed movement, respectively. Typically, values within a window of 0.9–1.1 are considered to exhibit Brownian motion, with values greater than 1.1 suggesting active transport (Forest et al., 2005). By utilizing this method, the collective analyses of trajectory phases of particles (n=20) in 4h nocodazole-treated cells revealed that the movement of the majority (˜60%) of Gag–GFP labeled capsids involved a directed mode of transport, which was similar to what was observed for particle trajectories (n=20) in untreated CMMT cells (Fig. 5C). The median MSD of Gag–GFP particles in 4 h nocodazole-treated cells is not statistically significant from the upper MSD value that denotes Brownian motion, and so this form of movement cannot be entirely ruled out. However, as evidenced by the particle tracks in Fig. 4A and Movie S4, the pattern of Gag–GFP movement in nocodazole-treated cells after 2 h is distinctly different from the patterns observed after 4 h of nocodazole treatment (Fig. 4A and Movies S4 and S5), despite the fact that Brownian motion would occur at both time points. These observations together with the MSD analyses, collectively suggest that the movement of Gag–GFP particles after 4 h of nocodazole treatment is directed to some degree.
Fig. 5.

MSD analysis of intracellular capsid movement after long-term nocodazole treatment.(A) Representative particle trajectory and accompanying MSD graph with separated phases I–III indicated. Conversion of this graph to a log–log scale is shown in (B), with calculated slope values indicating a different mode of movement for each phase of the trajectory. (C) Analysis of MSD of Gag–GFP trajectories (n=20 per group) in untreated cells (n=4) and cells treated with nocodazole (n=4) for 4 h. Solid bars indicate median slope values for each group of cells, with dotted lines relating slope values to the type of particle movement.
Discussion
The aim of current study was to elucidate whether previously reported pericentriolar interactions between M-PMV Gag and Env-containing recycling vesicles are maintained as stable co-transported entities towards the plasma membrane or if these interactions simply facilitate the transfer of Gag to an anterograde trafficking system. It was also necessary to elucidate whether this (co-)transport occurs via a cytoskeleton-dependent network. This study involved a real time approach using time-course pulse-chase assays and live-cell imaging experiments, to monitor the kinetics of M-PMV capsid transport over extended periods of time. Doing so provided insight into dynamic M-PMV-host interactions, by helping to identify cytoskeletal factors involved in anterograde intracellular transport, and shedding light on the extent to which these factors are required by M-PMV.
For the first time, live cell imaging provides direct evidence that the interactions between Gag and Env are not short-lived, with clear co-localization and sustained anterograde co-transport of Gag–Env particles being observed in CMMT cells. A benefit of utilizing CMMT cells for these studies is that endogenous Gag or Env that is constitutively produced by the cells allows for normal assembly of GFP-labeled capsids and mixed trimers (Salzwedel and Berger, 2009) of wild-type and mCherry-labeled Env. Thus, it is possible that a fraction of fluorescent-tagged Gag particles are associated with endogenous Env, and vice versa. Indeed, the similar median velocities of Gag–GFP, Gag–Env and Env–mCherry particles in untreated CMMT cells may reflect this. However, there was a significant difference between the velocities and patterns of movement of Gag–GFP versus Gag–Env or Env–mCherry particles after 4 h of nocodazole treatment, and the overall consistency of the live imaging and pulse-chase results lend validity to the differential transport and release patterns observed for Gag and Env.
The data collectively demonstrate that the intracellular transport of Env and Gag–Env co-localized vesicles, and subsequent release of Env are critically dependent on the presence of micro-tubules. While efficient intracellular transport of Gag also primarily depends on this cytoskeletal network, a unique and unexpected finding from our results was that the effect of microtubule disruption on capsid transport was only temporary, with nocodazole-treated cells exhibiting an initial two-fold reduction in Gag processing and release but later showing levels of Gag release that were near those observed for untreated cells. However, released virions lacked Env and these observations were strongly supported by accompanying live imaging results.
The observed movement and release of Gag in the absence of microtubules is likely to include a combination of factors that are secondary to the disruption of the MTOC by nocodazole. While a role for alternate cytoskeletal pathways in nocodazole-treated cells could not be confirmed by live imaging due to the shrinking morphological effects of CytD and ACR, biochemical pulse-chase assays suggest that actin and/or intermediate filaments play a minimal role in facilitating the release of Gag in the absence of microtubules. Furthermore, live imaging of untreated CMMT cells stained with actin-RFP and transfected with a plasmid expressing Gag–GFP failed to demonstrate linear movement of Gag–GFP particles on actin filaments (data not shown). This is in sharp contrast to the distinct linear tracks observed for Gag–GFP on mCherry-labeled microtubules. However, these findings do not rule out a role for the dense cortical actin network, which may facilitate short-range movement of capsids when proximal to the plasma membrane.
The movement of Gag–GFP particles that was observed in nocodazole-treated cells after 4 h appeared to be distributed throughout the cell, and was typically short-range and staggered in nature, as demonstrated by particle tracking. In sharp contrast, Env–mCherry vesicles and Gag–Env co-localized vesicles were visibly static throughout these treated cells. This is further highlighted by the difference in velocity of Gag–GFP particles when compared to Gag–Env and Env–mCherry particles after 4 h of nocodazole treatment (p value < 0.0001). As illustrated by the model in Fig. 6, the loss in spatial proximity of nascent or preexisting Env or Env–mCherry with recycling endosomal vesicular compartments due to MTOC disruption, and a cessation in vesicular trafficking due to microtubule depolymerization likely contributed to the stagnant nature of Env–mCherry and Gag–Env particles in nocodazole-treated cells. These data, together with the pulse-chase assay results showing a lack of Env in released particles, strongly suggest an absolute dependence of Env-containing recycling vesicles on microtubules, and by extension, an inability of Env to utilize other secretory or vesicular trafficking pathways that are microtubule-independent.
Fig. 6.
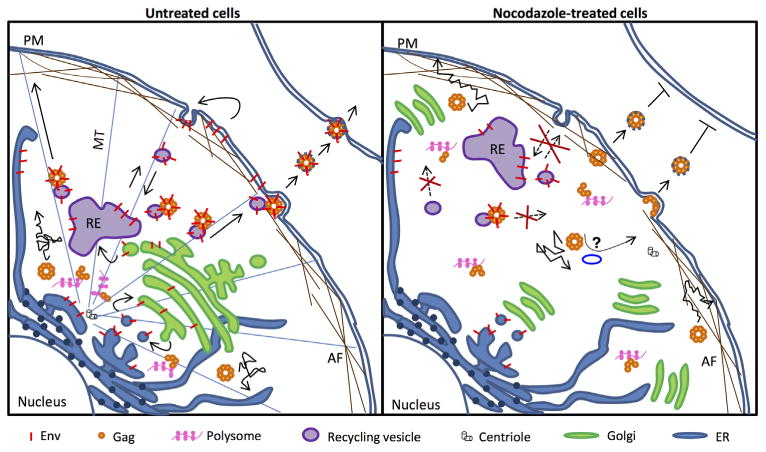
Model illustrating anterograde co-transport of M-PMV Env and Gag on recycling vesicles. In the presence of microtubules (MT) and the microtubule organizing center (MTOC), capsid assembly from Gag-translating polysomes occurs at the pericentriolar region. Env, which traffics through the recycling endosome (RE), mediates a stable interaction between pre-assembled capsids and RE-derived vesicles to facilitate anterograde linear transport on MT to the plasma membrane (PM). Nocodazole treatment results in a loss of MT and a dispersal of MTOC organelles, resulting in Gag synthesis and capsid assembly throughout the cell, including the periphery. The recycling, transport and release of Env, which rely on vesicular transport, cease due to a dependence of recycling vesicles on MT. Capsid release continues to occur at an inefficient rate due to stochastic movements and/or interactions of Gag with cortical actin filaments (AF) or microtubule-independent transport/secretory vesicles. Capsid assembly may also occur directly at the PM, leading to the release of non-infectious Env-deficient virions.
Collectively, the differential effects on Gag and Env transport following microtubule depolymerization also argue against the regeneration and/or presence of nocodazole-resistant microtu-bules. While nocodazole-resistant microtubules composed of detyrosinated tubulin have been reported, their stability persists for only short term nocodazole-treatment, with treatments greater than 1–2 h leading to their complete depolymerization (Quinones et al., 2011). Indeed, immunostaining with an antibody targeting detyrosinated tubulin in CMMT cells demonstrated a complete loss of these microtubules after 4 h of nocodazole treatment (data not shown).
The observed albeit inefficient movement of Gag–GFP particles after long-term nocodazole treatment was likely a combination of existing Gag-particles, and nascent Gag–GFP synthesized from dispersed polysomes (Fig. 6). However, results from the pulse-chase experiments, which track the fate of radiolabeled proteins, suggest that Gag that was synthesized prior to the addition of nocodazole was eventually released 4 h after microtubule depoly-merization. The fact that Gag–GFP particles exhibited some degree of movement, unlike the static nature of both Env–mCherry and Gag–Env vesicles as shown by live imaging, suggest that the motile Gag/Gag–GFP particles at the 4 h time point were not associated with Env vesicles.
The staggered movement of Gag–GFP particles over limited distances may have been the result of stochastic unstable interactions with microtubule-independent trafficking components, or reflective of Brownian motion. The median MSD of Gag–GFP particles in 4 h nocodazole-treated cells suggested that the movement was active in nature, and given that a notable level of virion release was observed at this time point, it was likely the result of directed motion. However, the MSD value was not statistically significant from the range that denotes Brownian motion and so it is not improbable that both forms of movement are occurring to some degree. These irregular movements and/or transient interactions, particularly in the cell periphery, may have been sufficient to facilitate capsid release.
The possibility of capsid assembly occurring directly at the plasma membrane also cannot be discounted. Random molecular interactions and inefficient staggered movements of Gag may occur even in the presence of microtubules, and a minimal release of non-viable Env-deficient capsids from untreated cells is not implausible. Indeed, it should be noted that while short non-linear particle tracks were exhibited by the majority of Gag–GFP particles in nocodazole-treated cells, a similar pattern was also observed for a minor population of Gag–GFP particles in untreated cells. However, it is clear that although microtubules are not critical for Gag transport and release, the alternative pathway(s) that is utilized does not yield functional Env-containing virions, highlighting the importance of the interdependent relationship between Gag and Env.
The sustained co-localization of Gag–GFP and Env–mCherry that was observed as highly motile or stagnant particles in untreated and nocodazole-treated cells, respectively, suggests that Env is important for mediating a stable interaction between Gag and the Env-containing recycling vesicles. It is currently unclear if this is solely a direct Env–Gag interaction, or if interactions with Env trigger conformational changes in Gag that allow it to dock on to the recycling vesicle. Further support for an Env-mediated interaction is derived from previous studies in which cells expressing M-PMV provirus with an env deletion exhibited a 7-fold decrease in Gag release, despite the presence of microtubules and a functional recycling vesicular trafficking network.
Interestingly, the results from the pulse-chase experiments demonstrated continued release of M-PMV Gag even when all three cytoskeleton components were compromised. In addition, earlier studies involving the PLA2 inhibitor ONO-RS-082 prompted the suggestion of a membrane tubule-vesicular means of transport (Sfakianos and Hunter, 2003; Sfakianos et al., 2003; Ullrich et al., 1996). These observations prompted an evaluation of a cytoskele-ton-independent, membrane tubule-based transport network. However, live imaging experiments of untreated cells, nocodazole-treated cells, and cells treated with BFA which induces membrane tubule formation, all failed to show productive linear movement of Gag–GFP along or on these membrane tubular structures, with only transient interactions being observed (data not shown). Furthermore, live imaging of CMMT cells treated with ONO-RS-082, which inhibits tubule formation, revealed that despite a dose-dependent block in virion release, intracellular movement of Gag– GFP was still evident (data not shown), suggesting differential effects of this compound on transport and release. This is not entirely surprising given that the PLA2 superfamily of enzymes, which are also involved in the generation of membrane curvature, are likely to influence the formation and release of budding vesicles. Thus, intracellular (co-)transport of Gag and Env is unlikely to be cytoskeletal-independent. This is further supported by studies that have demonstrated that the elongation and/or movement of membrane tubule structures also require a functional cytoskeletal network.
In summary, live cell imaging has for the first time definitively demonstrated intracellular anterograde co-transport of M-PMV Gag and Env in real time. Results have further shown that the co-localization of Gag and Env vesicles is stable and sustained during transport, and that this interaction is primarily mediated by Env, which is consistent with previous findings (Sfakianos and Hunter, 2003; Sfakianos et al., 2003; Ullrich et al., 1996). Importantly, the novel differential effects on Gag and Env transport and release following microtubule depolymerization, as shown by live imaging and biochemical pulse chase assays, highlight an absolute dependence of Env-containing vesicles, and by extension the associated Gag, on microtubule-based transport. It will be of interest to map the molecular and structural determinants that shape the specificity of Env for recycling vesicles and its interaction with Gag. It is important to note that while microtubules appear to be partially dispensable for Gag transport and capsid release, the alternative pathway(s) is not viable for the production of Env-containing virions (Fig. 6). Nonetheless, identifying and characterizing trafficking factors that facilitate short-range Gag transport, in the presence and absence of microtubules, will help define distinct genres of intracellular trafficking pathways and may reveal a broader scope of interactions between Gag and host cell transport factors.
Methods
Cell lines and reagents
CMMT cells, originally established by co-cultivating rhesus mammary tumor cells with rhesus monkey embryo cells, actively produce infectious M-PMV. COS-1 cells, derived from the African green monkey kidney cell line, CV-1, by transformation with an origin-defective mutant of SV40 (Gluzman, 1981) were obtained from the American Type Culture Collection. These cells were cultured in Dulbecco's modified Eagle's medium (DMEM) supplemented with 10% fetal bovine serum, 2 mM L-glutamine, 100 U penicillin G/ml and 100 μg/ml streptomycin sulfate (all from Gibco). The cell line was maintained at 37 °C in a 5% CO2 incubator. Stock solutions of the cytoskeletal disrupting agents (Sigma) were prepared in dimethyl sulfoxide (DMSO) and diluted 41000-fold in culture medium for experiments. Cytochalasin D was used at a final concentration of 2.5 μM to depolymerize actin filaments, and 10 μM of nocodazole and 5 mM ACR was used to disrupt micro-tubules and intermediate filaments, respectively. For untreated controls, DMSO that was diluted to identical levels was added to cells.
Plasmid constructs
To facilitate live cell imaging studies, plasmid constructs in which M-PMV Gag and Env were fused to GFP and the red fluorescent protein mCherry, respectively, were co-transfected into CMMT cells. Briefly, pSARM–GagGFP–M100A is a proviral construct containing a Kozak-optimized ribosomal start site, an M100A amino acid substitution, and a gag–egfp fusion replacing the pro and pol genes. The plasmid pTML–Env–mCherry is a derivative of the pTMO construct (Brody et al., 1994), and contains the M-PMV env gene under transcriptional control of the myopro-liferative sarcoma virus LTR, with mCherry fused to the cytotail of Env via a six amino acid linker. A second Env-mCherry fusion construct, pSARMX–EnvCherry, was generated by PCR cloning of PPQISPP–mcherry–PPSIQPP into the env gene of the plasmid pSARMX, just upstream the membrane-spanning domain of Env. This second construct behaves and localizes comparably to the pTML–Env–mCherry plasmid used in this manuscript, and is incorporated into virions, which was confirmed by sucrose density gradient analysis (manuscript in preparation).
Antibodies and staining reagents
In pulse-chase assays, M-PMV Gag was immunoprecipitated with polyclonal rabbit anti-p27CA antibody (1:1000). For detection of Env and Gag, goat anti-M-PMV polyclonal antibody (1:1000) was utilized as previously described (Stansell et al., 2007). For immunostaining of cytoskeleton networks in fixed CMMT cells, rhodamine phalloidin and anti-alpha tubulin mouse monoclonal antibody (Invitrogen, Carlsbad, CA), were utilized to detect actin filaments and microtubules, respectively. To detect intermediate filaments, cells were immunostained with FITC-conjugated anti-vimentin monoclonal antibody (eBioscience, San Diego, CA).
Immunofluorescence microscopy
CMMT cells expressing M-PMV provirus were grown as monolayers on 22-mm glass coverslips and immunostained 15 h after seeding. For immunostaining of actin and intermediate filaments, cells were fixed with 4% paraformaldehyde for 20 min, permeabi-lized using 0.1% Triton X-100 for 10 min and blocked with Dako blocking reagent (Dako, Carpinteria, CA) for 10 min, all at room temperature. Dyes and/or antibodies specific for these cytoskeletal networks were diluted in Dako antibody diluent and added to cells according to manufacturer's protocols. Immunostaining of microtubules was performed in similar manner, with the exception of CMMT cells being fixed with a mixed solution of 3.75% PFA and 0.25% gluteraldehyde. After washing twice with 1 × PBS, cover-slips were mounted in ProLong antifade reagent (Invitrogen) containing DAPI for nuclei staining. Cells were visualized using a 60 × oil objective on a Deltavision deconvolution fluorescence microscope (Applied Precision Inc., Issaquah, WA). Images were acquired and processed using Deltavision SoftWoRx software (Applied Precision Inc., Issaquah, WA).
Metabolic labeling and immunoprecipitation of M-PMV proteins
CMMT cells were pulse-labeled as described previously (Stansell et al., 2007). Briefly, cells were starved for 15 min in methionine- and cysteine-deficient DMEM and then pulse-labeled for 30 min with 100 μCi of [35S]methionine–[35S]cysteine protein-labeling mix (Perkin-Elmer NEN, Boston, MA). Cells were then washed and chased in complete DMEM media for 2, 3 or 4 h. Where indicated, cytochalasin D, nocodazole or ACR was added to cells immediately at the beginning of the chase (4 h treatment). Pulse and chase cell lysates and chase culture media were collected and processed as described previously (Stansell et al., 2007). Viral proteins were immunoprecipitated from cell lysates and culture media samples using polyclonal rabbit anti-p27CA antibody and then separated by SDS-polyacrylamide gel electrophoresis. SDS-PAGE gels were dried and exposed to phosphor screens, and then visualized and quantified using the Packard CycloneTM phosphor imaging software OptiQuant (Perkin-Elmer, Shelton, CT). Further quantification to determine the molar percentage or molar ratios of Gag precursor Pr78 and p27 capsid at each time point were calculated as described previously (Stansell et al., 2007). For optimal detection of M-PMV Env, a similar assay was performed with the exception that cells were pulse-labeled with [3H]-leucine and lysed using 1% Triton X-100 lysis buffer (1% Triton X-100, 0.05 M NaCl, 0.025 M Tris, pH 8.0) instead of 1% SDS. Viral proteins in cell lysates and culture media from this assay were immunoprecipitated with polyclonal goat anti-M-PMV antibody. SDS-PAGE gels were treated with En3hance as per manufacturer's protocol (Perkin-Elmer, Waltham MA) and then exposed to autoradiography films for at least 5 days at –70 °C before development.
Live cell imaging
CMMT cells transfected with pSARM–GagGFP–M100A were visualized in real time at 6–8 h post-transfection using the Deltavision deconvolution microscope. Cells co-transfected with pSARM–GagGFP–M100A and pTML–Env–mCherry were imaged at 15–18 h post-transfection due to delayed expression of the Env– mCherry signal. For imaging capsid movement along microtubules, CMMT cells were co-transected with pSARM–GagGFP– M100A and p-mCherry–tubulin, and imaged 15–18 h post-transfection. To image capsids and actin filaments, cells were transduced with CellLight® actin-RFP (Life Technologies, Carlsbad, CA) followed by transfection with pSARM–GagGFP–M100A and imaged 6–8 h post-transfection. During imaging, live cells were kept in a CO2-permeable microchamber maintained at a temperature of 37 °C. Videos were acquired for untreated CMMT cells and for those treated with nocodazole for 2 h and 4 h. Similar imaging was performed for cells treated with cytochalasin D or ACR for 4 h. For each video, images were acquired across five z-stacks every 5 s over a total 2 min time period. The quick projection feature of the Deltavision SoftWorx software was utilized to process all videos to generate identical output frame speeds of five frames per second.
Video analysis
Particle tracking and velocity measurements were performed using the ImageJ (http://rsbweb.nih.gov/ij/) software plug-in MTrackJ (E. Meijering, Biomedical Imaging Group Rotterdam, Netherlands). Statistical analysis of velocity measurements was performed using the Mann-Whitney non-parametric t-test. A p value of less than 0.005 was considered to be statistically significant. To determine mean squared displacement, trajectories were generated for multiple randomly selected Gag–GFP particles in untreated CMMT cells and those treated with nocodazole for 4 h, using the ImageJ plug-in Particle Detector and Tracker (Sbalzarini and Koumoutsakos., 2005). The trajectories were filtered to only include those that contained at least 12 time points. The x/y coordinates of a particle at each time point within the trajectory were applied in the formula [1/NN 蜡i=0(ri(t)–ri(0))2] to calculate mean squared displacement (MSD). This formula takes into account the vector distance, ri(t) – ri(0), that is traveled by particle i over a time interval of length t, and the squared magnitude of this vector is averaged over many such time intervals. This quantity was further averaged for all particles considered (N=20 for each group of untreated and nocodazole-treated cells), summing i from 1 to N and dividing by N. A plot of MSD as a function of time interval was then separated into different phases based on changes in the trend of the graph (Forest et al., 2005). Transformation of this graph to log–log scale, and subsequent calculation of the slope of the line of each phase yielded a numerical value that provides information about the type of particle movement. Slopes equal to 1, > 1 or < 1 represent Brownian motion, directed or hindered movement, respectively (Forest et al., 2005).
Supplementary Material
Acknowledgments
This work was supported by the NIH Grant CA-27834 from the National Cancer Institute and Czech Ministry of Education Grant LN12011 and by Czech Science Foundation Grant P302/12/1895. J. Clark was the recipient of an American Society for Microbiology Robert D. Watkins Fellowship. We thank the James B. Pendleton Charitable Trust for the contribution of advanced imaging equipment utilized in the experiments in this manuscript. We thank Dr. Jan Lipov, Dr. Greg Melikian, and Dr. Joseph Roland for helpful discussions. We also thank Pavel Ulbrich (Institute of Chemical Technology, Prague, Czech Republic) and Eileen Breding (Yerkes National Primate Research Center, Atlanta GA) for excellent advice and assistance with transmission electron microscopy, and the Robert P. Apkarian Integrated Electron Microscopy Core of Emory University for sample preparations. EH is a Georgia Research Alliance Eminent Scholar. JC is an American Society for Microbiology Robert D. Watkins fellow.
Footnotes
Appendix A. Supporting information: Supplementary data associated with this article can be found in the online version at http://dx.doi.org/10.1016/j.virol.2013.11.006.
Contributor Information
Lara E. Pereira, Email: vvg3@cdc.gov.
Jasmine Clark, Email: jrainey@emory.edu.
Petra Grznarova, Email: Petra.Grznarova@vscht.cz.
Xiaoyun Wen, Email: xiaoyun.wen@emory.edu.
Rachel LaCasse, Email: RLaCasse@niaid.nih.gov.
Tomas Ruml, Email: Tomas.Ruml@vscht.cz.
Paul Spearman, Email: paul.spearman@emory.edu.
Eric Hunter, Email: eric.hunter2@emory.edu.
References
- Bremner KH, Scherer J, Yi J, Vershinin M, Gross SP, Vallee RB. Adenovirus transport via direct interaction of cytoplasmic dynein with the viral capsid hexon subunit. Cell Host Microbe. 2009;6:523–535. doi: 10.1016/j.chom.2009.11.006. [DOI] [PMC free article] [PubMed] [Google Scholar]
- Brody BA, Kimball MG, Hunter E. Mutations within the transmembrane glycoprotein of Mason-Pfizer monkey virus: loss of SU-TM association and effects on infectivity. Virology. 1994;202:673–683. doi: 10.1006/viro.1994.1389. [DOI] [PubMed] [Google Scholar]
- Brown CR, Doxsey SJ, Hong-Brown LQ, Martin RL, Welch WJ. Molecular chaperones and the centrosome. A role for TCP-1 in microtubule nucleation. J Biol Chem. 1996;271:824–832. doi: 10.1074/jbc.271.2.824. [DOI] [PubMed] [Google Scholar]
- Choi G, Park S, Choi B, Hong S, Lee J, Hunter E, Rhee SS. Identification of a cytoplasmic targeting retention signal in a retroviral Gag polyprotein. J Virol. 1999;73:5431–5437. doi: 10.1128/jvi.73.7.5431-5437.1999. [DOI] [PMC free article] [PubMed] [Google Scholar]
- Clark J, Grznarova P, Stansell E, Diehl W, Lipov J, Spearman P, Ruml T, Hunter E. PLOS ONE. doi: 10.1371/journal.pone.0083863. in press. [DOI] [PMC free article] [PubMed] [Google Scholar]
- Durham HD. The effect of beta, β′-iminidipropionitrile (IDPN) on cytoske-letal organization in cultured human skin fibroblasts. Cell Biol Int Rep. 1986;10:599–610. doi: 10.1016/0309-1651(86)90137-2. [DOI] [PubMed] [Google Scholar]
- Forest T, Barnard S, Baines JD. Active intracellular movement of herpes-virus capsids. Nat Cell Biol. 2005;7:429–431. doi: 10.1038/ncb1243. [DOI] [PubMed] [Google Scholar]
- Gazzola M, Burckhardt CJ, Bayati B, Engelke M, Greber UF, Koumoutsakos P. A stochastic model for microtubule motors describes the in vivo cytoplasmic transport of human adenovirus. PLos Comput Biol. 2009;5:e1000623. doi: 10.1371/journal.pcbi.1000623. [DOI] [PMC free article] [PubMed] [Google Scholar]
- Glotzer JB, Michou AI, Baker A, Saltik M, Cotten M. Microtubule-independent motility and nuclear targeting of adenovirus with fluorescently labeled genomes. J Virol. 2001;75:2421–2434. doi: 10.1128/JVI.75.5.2421-2434.2001. [DOI] [PMC free article] [PubMed] [Google Scholar]
- Gluzman Y. SV40-transformed simian cells support the replication of early SV40 mutants. Cell. 1981;23:175–182. doi: 10.1016/0092-8674(81)90282-8. [DOI] [PubMed] [Google Scholar]
- Griffin JW, Fahnestock KE, Price DL, Cork LC. Cytoskeletal disorganization induced by local application of beta, β′-iminodiproprionitrile and 2,5-hexanedione. Ann Neurol. 1983;14:55–61. doi: 10.1002/ana.410140109. [DOI] [PubMed] [Google Scholar]
- Hendricks AG, Perlson E, Ross JL, Schroeder HW, Tokito M, Holzbaur ELF. Motor coordination via a tug-of-war mechanism drives bidirectional vesicle transport. Curr Biol. 2010;20:697–702. doi: 10.1016/j.cub.2010.02.058. [DOI] [PMC free article] [PubMed] [Google Scholar]
- Hollinshead M, Rodger G, Eijl HV, Law M, Hollinshead R, Vaux DJT, Smith GL. Vaccinia virus utilizes microtubules for movement to the cell surface. J Cell Biol. 2001;154:389–402. doi: 10.1083/jcb.200104124. [DOI] [PMC free article] [PubMed] [Google Scholar]
- Hong S, Choi G, Park S, Chung AS, Hunter E, Rhee SS. Type D retrovirus Gag polyprotein interacts with the cytosolic chaperonin TRiC. J Virol. 2001;75:2526–2534. doi: 10.1128/JVI.75.6.2526-2534.2001. [DOI] [PMC free article] [PubMed] [Google Scholar]
- Jouvenet N, Monaghan P, Way M, Wileman T. Transport of African swine fever virus from assembly sites to the plasma membrane is dependent on microtubules and conventional kinesin. J Virol. 2004;78:7990–8001. doi: 10.1128/JVI.78.15.7990-8001.2004. [DOI] [PMC free article] [PubMed] [Google Scholar]
- Kumar N, Robidoux J, Daniel KW, Guzman G, Floering LM, Collins S. Requirement of vimentin filament assembly for β3-adrenergic receptor activation of ERK MAP kinase and lipolysis. J Biol Chem. 2007;282:9244–9250. doi: 10.1074/jbc.M605571200. [DOI] [PubMed] [Google Scholar]
- Lee GE, Murray JW, Wolkoff AW, Wilson DW. Reconstitution of herpes simplex virus microtubule-dependent trafficking in vitro. J Virol. 2006;80:4264–4275. doi: 10.1128/JVI.80.9.4264-4275.2006. [DOI] [PMC free article] [PubMed] [Google Scholar]
- Martinez NW, Xue X, Berro RG, Kreitzer G, Resh MD. Kinesin KIF4 regulates intracellular trafficking and stability of the human immunideficiency virus Type 1 Gag polyprotein. J Virol. 2008;82:9937–9950. doi: 10.1128/JVI.00819-08. [DOI] [PMC free article] [PubMed] [Google Scholar]
- Miranda-Saksena M, Armati P, Boadle RA, Holland DJ, Cunningham AL. Anterograde transport of herpes simplex virus type 1 in cultured, dissociated human and rat dorsal root ganglion neurons. J Virol. 2000;74:1827–1839. doi: 10.1128/jvi.74.4.1827-1839.2000. [DOI] [PMC free article] [PubMed] [Google Scholar]
- Parker SD, Hunter E. Activation of the Mason-Pfizer monkey virus protease within immature capsids in vitro. PNAS. 2001;98:14631–14636. doi: 10.1073/pnas.251460998. [DOI] [PMC free article] [PubMed] [Google Scholar]
- Quinones GB, Danowski BA, Devaraj A, Singh V, Ligon LA. The posttranslational modification of tubulin undergoes a switch from dyrosination to acetylation as epithelial cells become polarized. Mol Biol Cell. 2011;22:1045–1057. doi: 10.1091/mbc.E10-06-0519. [DOI] [PMC free article] [PubMed] [Google Scholar]
- Rhee SS, Hunter E. A single amino acid substitution within the matrix protein of a type D retrovirus converts its morphogenesis to that of a type C retrovirus. Cell. 1990a;63:77–86. doi: 10.1016/0092-8674(90)90289-q. [DOI] [PubMed] [Google Scholar]
- Rhee SS, Hunter E. Structural role of the matrix protein of type D retroviruses in gag polyprotein stability and capsid assembly. J Virol. 1990b;64:4383–4389. doi: 10.1128/jvi.64.9.4383-4389.1990. [DOI] [PMC free article] [PubMed] [Google Scholar]
- Rhee SS, Hunter E. Amino acid substitutions within the matrix domain of type D retroviruses affect assembly, transport and membrane association of a capsid. EMBO J. 1991;10:535–546. doi: 10.1002/j.1460-2075.1991.tb07980.x. [DOI] [PMC free article] [PubMed] [Google Scholar]
- Ross JL, Shuman H, Holzbaur EL, Goldman YE. Kinesin and dynein-dynactin at intersecting microtubules: motor density affects dynein function. Biophys J. 2008;94:3115–3125. doi: 10.1529/biophysj.107.120014. [DOI] [PMC free article] [PubMed] [Google Scholar]
- Sakalian M, Hunter E. Separate assembly and transport domains within the gag precursor of Mason-Pfizer monkey virus. J Virol. 1999;73:8073–8082. doi: 10.1128/jvi.73.10.8073-8082.1999. [DOI] [PMC free article] [PubMed] [Google Scholar]
- Salzwedel K, Berger E. Complementation of diverse HIV-1 Env defects through cooperative subunit interactions: a general property of the functional trimer. Retrovirology. 2009;6:75. doi: 10.1186/1742-4690-6-75. [DOI] [PMC free article] [PubMed] [Google Scholar]
- Sathish N, Zhu FX, Yuan Y. Kaposi's sarcoma-associated herpesvirus ORF45 interacts with kinesin-2 transporting viral capsid-tegument complexes along microtubules. PLos Pathog. 2009;5:e1000332. doi: 10.1371/journal.ppat.1000332. [DOI] [PMC free article] [PubMed] [Google Scholar]
- Sbalzarini IF, Koumoutsakos P. Feature point tracking and trajectory analysis for video imaging in cell biology. J Struct Biol. 2005;151:182–195. doi: 10.1016/j.jsb.2005.06.002. [DOI] [PubMed] [Google Scholar]
- Sfakianos JN, Hunter E. M-PMV capsid transport is mediated by Env/Gag interactions at the pericentriolar recycling endosome. Traffic. 2003;4:671–680. doi: 10.1034/j.1600-0854.2003.00126.x. [DOI] [PubMed] [Google Scholar]
- Sfakianos JN, LaCasse RA, Hunter E. The M-PMV cytoplasmic targeting-retention signal directs mascent gag polypeptides to a pericentriolar region of the cell. Traffic. 2003;4:660–670. doi: 10.1034/j.1600-0854.2003.00125.x. [DOI] [PubMed] [Google Scholar]
- Shah JV, Flanagan LA, Janmey PA, Leterrier JF. Bidirectional translocation of neurofilaments along microtubules mediated in part by dynein/ dynactin. Mol Biol Cell. 2000;11:3495–3508. doi: 10.1091/mbc.11.10.3495. [DOI] [PMC free article] [PubMed] [Google Scholar]
- Stansell E, Apkarian R, Haubova S, Diehl WE, Tytler EM, Hunter E. Basic residues in the Mason-Pfizer monkey virus gag matrix domain regulate intracellular trafficking and capsid-membrane interactions. J Virol. 2007;81:8977–8988. doi: 10.1128/JVI.00657-07. [DOI] [PMC free article] [PubMed] [Google Scholar]
- Stansell E, Tytler E, Walter MR, Hunter E. An early stage of Mason-Pfizer monkey virus budding is regulated by the hydrophobicity of the gag matrix domain core. J Virol. 2004;78:5023–5031. doi: 10.1128/JVI.78.10.5023-5031.2004. [DOI] [PMC free article] [PubMed] [Google Scholar]
- Suomalainen M, Nakano MY, Keller S, Boucke K, Stidwill RP, Greber UF. Microtubule-dependent plus- and minus-end-directed motilities are competing processes for nuclear targeting of adenovirus. J Cell Biol. 1999;144 doi: 10.1083/jcb.144.4.657. [DOI] [PMC free article] [PubMed] [Google Scholar]
- Ullrich O, Reinsch S, Urbe S, Zerial M, Parton RG. Rab11 regulates recycling through the pericentriolar recycling endosome. J Cell Biol. 1996;135:913–924. doi: 10.1083/jcb.135.4.913. [DOI] [PMC free article] [PubMed] [Google Scholar]
- Vlach J, Lipov J, Rumlova M, Veverka V, Lang J, Srb P, Knejzlik Z, Pichova I, Hunter E, Hrabal R, Ruml T. D-retrovirus morphogenetic switch driven by the targeting signal accessibility to Tctex-1 of dynein. Proc Natl Acad Sci USA. 2008;105:10565–10570. doi: 10.1073/pnas.0801765105. [DOI] [PMC free article] [PubMed] [Google Scholar]
- Yasudo J, Hunter E. A proline-rich motif (PPPY) in the Gag polyprotein of Mason-Pfizer monkey virus plays a maturation-independent role in virion release. J Virol. 1998;72:4095–4103. doi: 10.1128/jvi.72.5.4095-4103.1998. [DOI] [PMC free article] [PubMed] [Google Scholar]
- Yea C, Dembowy J, Pacione L, Brown M. Microtubule-mediated and microtubule-independent transport of adenovirus Type 5 in HEK293 cells. J Virol. 2007;81:6899–6908. doi: 10.1128/JVI.02330-05. [DOI] [PMC free article] [PubMed] [Google Scholar]
Associated Data
This section collects any data citations, data availability statements, or supplementary materials included in this article.