

Abstract
Objective
Metastasis is thought to be governed partially by induction of epithelial–mesenchymal transition. Combination of proteasome and histone deacetylase inhibitors has shown significant promise, but no studies have investigated this in esophageal cancer. This study investigated effects of vorinostat (histone deacetylase inhibitor) and bortezomib (proteasome inhibitor) on esophageal cancer epithelial–mesenchymal transition.
Methods
Three-dimensional tumor spheroids mimicking tumor architecture were created with esophageal squamous and adenocarcinoma cancer cells. Cells were treated with tumor necrosis factor α (to simulate proinflammatory tumor milieu) and transforming growth factor β (cytokine critical for induction of epithelial–mesenchymal transition). Tumor models were then treated with vorinostat, bortezomib, or both. Cytotoxic assays assessed cell death. Messenger RNA and protein expressions of metastasis suppressor genes were assessed. After treatment, Boyden chamber invasion assays were performed.
Results
Combined therapy resulted in 3.7-fold decrease in adenocarcinoma cell invasion (P = .002) and 2.8-fold decrease in squamous cell invasion (P = .003). Three-dimensional invasion assays demonstrated significant decrease in epithelial–mesenchymal transition after combined therapy. Quantitative reverse transcriptase polymerase chain reaction and Western blot analyses revealed robust rescue of E-cadherin transcription and protein expression after combined therapy. Importantly, inhibition of the E-cadherin gene resulted in abolition of the salutary benefits of combined therapy, highlighting the importance of this metastasis suppressor gene in the epithelial–mesenchymal transition process.
Conclusions
Combined vorinostat and bortezomib therapy significantly decreased esophageal cancer epithelial–mesenchymal transition. This combined therapeutic effect on esophageal cancer epithelial–mesenchymal transition was associated with upregulation of E-cadherin protein expression.
Esophageal cancer represents a significant challenge to the thoracic surgical community, because most patients are seen with advanced stage disease. This is in large part due to the development of early nodal or distant metastases. Despite advances in the staging of esophageal cancer, patients continue to be seen with advanced stage disease because of the lack of any screening biomarkers. Therapies aimed at inhibiting the metastatic movement of esophageal cancer thus need to be explored as an addition to the current tumoricidal therapies.
Metastatic progression is thought to be initiated by the process of epithelial–mesenchymal transition (EMT), which is characterized by epithelial cells assuming a mesenchymal phenotype, thus allowing decreased cell adhesion, increased motility, and increased proliferation. The cytokine transforming growth factor β (TGF-β) has been shown to be a key effector of EMT during cancer invasion and metastasis.1,2 Regulation of EMT is governed by a number of different genes, including metastasis suppressor genes, such as the gene for E-cadherin (CDH1).3
Our laboratory has previously shown that combined use of histone deacetylase (HDAC) and proteasome inhibition is effective in the treatment of non–small cell lung cancer cell lines.4 In light of these findings, a phase I clinical trial with this combined molecular therapy for patients with non–small cell lung cancer is underway at our institution. Previous studies have demonstrated that HDAC inhibition suppresses TGF-β–mediated EMT in human renal epithelial cells.5 Other groups have shown that proteasome inhibition blocks TGF-β–mediated EMT in human lens epithelium.6 On the basis of these observations, we hypothesized that the combined use of these molecularly targeted therapies would decrease EMT in human esophageal cancer.
This study used a cell culture model of esophageal cancer EMT to investigate the ability of suberoylanilide hydroxamic acid (vorinostat), an HDAC inhibitor, and bortezomib, a proteasome inhibitor, to prevent invasion and EMT. To evaluate these chemotherapeutic agents, we used TGF-β to induce EMT and tumor necrosis factor α (TNF-α) to mimic the proinflammatory peritumoral stromal environment.
MATERIALS AND METHODS
Cell Culture, Surgical Specimens, and Reagents
Human esophageal cancer (TE2 squamous carcinoma and SKGT4 adenocarcinoma) were kindly provided by Dr Dao M. Nguyen (Miami, Fla). TE2 cell lines were grown in Roswell Park Memorial Institute medium 1640 with high glucose, 10% fetal bovine serum, and 1% antibiotics. SKGT4 cell lines were grown in Dulbecco modified Eagle medium with high glucose, 10% fetal bovine serum, and 1% antibiotics. Vorinostat was from Biomol (Enzo Life Sciences International, Inc, Plymouth Meeting, Pa). Bortezomib was kindly provided by Millennium Pharmaceuticals (Millennium Pharmaceuticals, Inc, Cambridge, Mass). TNF-α and TGF-β were purchased from Sigma Pharmaceuticals (Sigma Pharmaceuticals, LLC, Monticello, Iowa).
Plasmid Construction
The CDH1 promoter reporter plasmid (EcadLuc) was created by isolating complementary DNA from human NL20 cells and was cloned by polymerase chain reaction (PCR, primers 5′-GGAAGATCTAGCCAC CGGCGGGGCTGGG-3′ forward and 5′-CCCAAGCTTCCGGGTGCG GTCGGGTCGG-3′ reverse) and inserted into pGL3 vector (Promega Corporation, Madison, Wis) with the restriction enzymes BglIII and HindIII (New England Biolabs Inc, Beverly, Mass).
Transfection and Luciferase Reporter Assays
Esophageal cancer cell lines at 50%to 60%confluence were transiently transfected with the CDH1 promoter–luciferase construct with the PolyFect reagent (QIAGEN Inc, Valencia, Calif) according to manufacturer recommendations. Luciferase reporter activity assays were performed as previously described.7 β-Galactosidase activities were analyzed as a control for the efficiency of transfection. Luminescence was normalized to protein concentrations. Transfection data are reported as expressions relative to the control treatment group. Transfection studies were carried out in triplicate.
Metastasis Suppressor Gene Expression
Total RNA was extracted with TRIzol (Invitrogen Corporation, Carlsbad, Calif) according to the manufacturer protocol. In brief, 106 cells were lysed with 1 mL TRIzol, and the proteins were separated by chloroform. RNA was precipitated with isopropanol, and complementary DNA was synthesized with an Advantage RT for PCR enzyme kit (Clontech Laboratories, Inc, Mountain View, Calif). Metastasis suppressor gene expressions of CDH1, breast cancer metastasis suppressor 1 gene (BRMS1), the gene for protein (NM23A) expressed in nonmetastatic cells 1 (NME1), Rho guanosine diphosphate dissociation inhibitor β gene (ARHGDIB), the CD44 gene, and the KiSS-1 metastasis-suppressor gene (KISS1) were determined by quantitative reverse transcriptase PCR (Bio-Rad iQ5; Bio-Rad Laboratories, Inc, Hercules, Calif). The human primers are shown in Table 1. The expressions of the genes of interest were normalized to an endogenous reference gene for glyceraldehyde-3-phosphate dehydrogenase (GAPDH). Relative gene expressions were calculated as previously described.8
TABLE 1.
Quantitative polymerase chain reaction primers
| Gene | Forward (5′–3′) | Reverse (5′–3′) |
|---|---|---|
| CDH1 | TTCCTCCCAATACATCTCCCTTCACAGCAG | CGAAGAAACAGCAAGAGCAGCAGAATCAGA |
| BRMS1 | TGCAGCGGAGCCTCAAG | TCACATCCAGACAGAAGCCCT |
| ARHGDIB | CCAACTCCTGCCAGATCATT | TCCCTTGTGCTGCTACATTG |
| NME1 | AGCGTTTTGAGCAGAAAGGA | GGCCCTGAGTGCATGTATTT |
| CD44 | TCAGAGGAGTAGGAGAGAGGAAAC | GAAAAGTCAAAGTAACAATAACAGTGG |
| KISS1 | TGGGGAATTCTAGACCCACA | CAGTAGCAGCTGGCTTCCTC |
| GAPDH | CCAGTGCAAAGAGCCCAAAC | GCACGGACACTCACAATGTTC |
CDH1, Gene for E-cadherin; BRMS1, breast cancer metastasis suppressor 1 gene; ARHGDIB, Rho guanosine diphosphate dissociation inhibitor β gene; NME1, protein (NM23A) expressed in nonmetastatic cells 1, KISS1, KiSS-1 metastasis-suppressor gene; GAPDH, gene for glyceraldehyde-3-phosphate dehydrogenase.
Treatment Groups
The dosages of vorinostat and bortezomib were based on previously published studies.4 Treatment groups used for the study were as follows: (1) control, no treatment; (2) TNF-α (20 ng/mL) and TGF-β (2 ng/mL); (3) TNF-α (20 ng/mL), TGF-β (2 ng/mL), and vorinostat (5 μmol/L); (4) TNF-α (20 ng/mL), TGF-β (2 ng/mL), and bortezomib (50 nmol/L); and (5) TNF-α (20 ng/mL), TGF-β (2 ng/mL), vorinostat (5 μmol/L), and bortezomib (50 nmol/L).
Cell Death Assay
Cell death during and after treatment was measured with trypan blue. After 24 hours of treatment, cells were trypsinized, stained with 0.4% trypan blue, and counted. After quantification of cell death, the cells were replated for 48 hours without treatment to determine delayed cell death; after this, cell death was again quantified with trypan blue.
Two-Dimensional Invasion Assay
Two-dimensional invasion assays were conducted as previously described.9 Migration and invasion were assessed with commercially available Boyden chambers (BD Biosciences, San Jose, Calif) according to manufacturer protocol. After the addition of cells, the chambers were incubated at 37°C for 48 hours. The percentage of invasion was calculated by dividing the number of invading cells by the number of migrating cells. The invasion percentage was then normalized to 1 to obtain an invasion index with an untreated cell population. Experiments were conducted in triplicate.
Because both bortezomib and vorinostat have known effects on cell growth inhibition, we sought to control for effects on cell growth to determine the true effects of the combined therapy on cancer cell invasion. All cells were recounted, and viability was reassessed before placement into the invasion chambers for all the 2-dimensional assays. We were thus able to control for cell growth inhibition, because the same number of viable cells was placed into each invasion chamber.
Morphometric Assay
SKGT4 cells were plated at a density of 1000 cells/well in 48-well tissue culture plates. After 48-hour cell equilibration in Dulbecco modified Eagle medium, cells were treated with the previously listed treatments for 24 hours. Cells were then fixed and stained according to the protocol described for the 2-dimensional invasion assay. Cell were then photographed with light microscopy.
Three-Dimensional Invasion Assay and E-Cadherin Blocking Antibody Treatment
Tumor spheres were created with the method previously published by our group.9 Briefly, TE2 and SKGT4 cells were diluted to 8 × 10⁵ cells/mL, and drops of the cell suspension (15 μL) were placed onto the lids of 100-mm dishes, which were inverted over dishes containing phosphate-buffered saline solution. The hanging drops were placed into a 37°C incubator for 3 days, after which the spheroids of both cell lines were transferred and implanted into 3-dimensional collagen I gels including 2.5-mg/mL rat collagen I (R&D Systems, Inc, Minneapolis, Minn) and overlaid with 2 mL Roswell Park Memorial Institute or Dulbecco modified Eagle medium containing the previously noted treatment groups. This method is a reproducible, well-accepted approach to determining invasive potential of tumor cells.10 Tumor spheres were treated with E-cadherin–blocking antibody (Sigma DECMA-1 1:100; Sigma Pharmaceuticals).11
Western Blot
Western blots were performed according to standard procedures.4 Mouse primary antibodies to E-cadherin (BD Biosciences) and β-actin (Santa Cruz Biotechnology, Inc, Santa Cruz, Calif) were used. A 50-μg portion of protein lysate for each treatment group was separated with 10% sodium dodecyl sulfate polyacrylamide gel electrophoresis. After transfer, nitrocellulose membranes (Bio-Rad) were probed with primary antibodies at a 1:1,000 dilution and secondary antibodies (Promega) at a 1:5,000 dilution in blocking solution. Proteins were visualized with enhanced chemiluminescent substrate (Pierce; Thermo Fisher Scientific Inc, Rockford, Ill).
Statistical Analysis
Results were expressed as mean ± SD. Comparisons between treatment groups were made with the Student t test
RESULTS
Therapy with vorinostat, bortezomib, or both combined resulted in significantly decreased tumor cell invasion after the induction of EMT in both esophageal squamous carcinoma and adenocarcinoma histologic types (Figure 1). Furthermore, combined treatment with vorinostat and bortezomib significantly decreased invasion of esophageal cancer cells relative to bortezomib therapy alone, and the difference approached significance versus vorinostat therapy alone (P = .07).
FIGURE 1.

Two-dimensional esophageal cancer invasion decreased with vorinostat and bortezomib (Bortez) treatment after induction of epithelial–mesenchymal transition. A, Treatment with vorinostat and bortezomib in esophageal squamous carcinoma (TE2) resulted in significantly decreased cell invasion. B, Treatment with vorinostat and bortezomib in esophageal adenocarcinoma (SKGT4) resulted in significantly decreased cell invasion. Crosshatch denotes P<.05 for control versus for tumor necrosis factor (TNF) and transforming growth factor (TGF). Asterisk denotes P<.01 for treatment group versus tumor necrosis factor and transforming growth factor. Plus sign denotes P<.05 for bortezomib treatment group versus combined vorinostat and bortezomib treatment group.
To assess whether this reduction in cell invasion was primarily related to increased cell death caused by these molecularly targeted agents, we next performed cell death assays. As shown in Figure 2, cell death was noted in 10% to 40% of cells 24 hours after treatment. Further assessment of cell death at 72 hours after treatment was performed to ascertain the contribution of delayed cell death. At 72 hours of treatment, there was only an additional 5% cell death from the original 24-hour assessment. According to this assay, the use of vorinostat, bortezomib, or both thus induces only modest cell death within the first 24 hours of treatment, with most esophageal cancer cells remaining viable afterward.
FIGURE 2.

Combined vorinostat and bortezomib (Bortez) treatment induced modest esophageal cancer cell death in both squamous carcinoma (TE2) and adenocarcinoma (SKGT4) histologic subtypes after 24 hours of treatment.
To investigate further the mechanism for decreased cell invasion with treatment with vorinostat, bortezomib, or both, we performed quantitative reverse transcriptase PCR for known metastatic suppressor genes and markers of EMT (Figures 3 and E1). With the esophageal adenocarcinoma cell line SKGT4, we demonstrated the induction of EMT by a robust increase in the transcription of N-cadherin and vimentin and increased spindle cell morphology associated with TNF-α and TGF-β (Figure E1). Interestingly, we found that the predominant restoration of the epithelial phenotype after TNF-α and TGF-β exposure was related more to the effects of bortezomib and less to those of vorinostat (Figures 1, A, and E1).
FIGURE 3.

Metastasis suppressor gene transcription (CDH1, gene for E-cadherin; BRMS1, breast cancer metastasis suppressor 1 gene; NME1, gene for NM23A; ARHGDIB, gene for Rho guanosine diphosphate dissociation inhibitor [RhoGDI2], CD44; KISS1, gene for KiSS-1) after induction of epithelial-mesenchymal transition and with treatment with vorinostat, bortezomib (Bortez), or both. E-cadherin transcription was significantly upregulated in both esophageal squamous (TE2) and adenocarcinoma cell lines (SKGT4) after combined treatment of vorinostat and bortezomib. In squamous esophageal cancer, combined vorinostat and bortezomib resulted in increased nm23 and RhoGDI2 transcription. Asterisk denotes P <.01 for treatment group versus tumor necrosis factor and transforming growth factor. Plus sign denotes P<.05 for bortezomib treatment versus combined vorinostat and bortezomib treatment. Crosshatch denotes P<.05 for vorinostat treatment versus combined vorinostat and bortezomib treatment. Caret denotes P<.05 for control versus tumor necrosis factor (TNF) and transforming growth factor (TGF). mRNA- Messenger RNA; GAPDH, glyceraldehyde-3-phosphate dehydrogenase.
In light of the evidence supporting EMT in the metastatic process, we assayed metastatic suppressor gene expression as a correlate of the role of these 2 molecularly targeted therapies in augmenting EMT. We found that CDH1 transcription was upregulated 80-fold in squamous carcinoma and 4-fold in adenocarcinoma after treatment with both vorinostat and bortezomib relative to the group with TNF-α and TGF-β treatment alone. Combined therapy also resulted in significant increases in NME1 and ARHGDIB transcriptions in squamous carcinoma but not esophageal adenocarcinoma. No significant differences in transcription with combined therapy were noted for BRMS1, CD44, and KISS1. Thus only CDH1 transcription was robustly increased in both squamous cell carcinoma and adenocarcinoma esophageal cancer histologic types after exposure to vorinostat and bortezomib.
We next examined whether the increase in CDH1 transcription was regulated by increases in activity of the CDH1 promoter. Figure 4 illustrates that combined therapy resulted in increased CDH1 promoter activity in squamous carcinoma relative to control and single-agent therapy. In esophageal adenocarcinoma, combined therapy resulted in significantly higher CDH1 promoter activity relative to the TNF-α and TGF-β group, but the activity was not significantly different from that seen with either single-agent therapy. These observations suggest that increases in CDH1 transcription after combined therapy occurs at the promoter level, particularly for esophageal squamous cell cancer histologic type.
FIGURE 4.

E-cadherin gene promoter activity was increased with combined treatment with vorinostat and bortezomib in both esophageal squamous carcinoma (TE2) and adenocarcinoma (SKGT4). Plus sign denotes P<.05 for vorinostat treatment versus bortezomib (Bort) treatment. Crosshatch denotes P <.05 for bortezomib treatment versus combined vorinostat and bortezomib treatment. Asterisk denotes P <.02 for given treatment group versus tumor necrosis factor and transforming growth factor. Caret denotes P <.05 for control versus tumor necrosis factor (TNF) and transforming growth factor (TGF). RLU, Relative luminescence units; Bgal, β-galactosidase.
Having found CDH1 transcription and promoter activity to be upregulated after combined therapy, we next demonstrated that protein levels of E-cadherin were enhanced after combined therapy (Figure 5). With the TE2 squamous cell carcinoma line, which has very low basal levels of E-cadherin, there was a very modest re-expression of E-cadherin protein with either vorinostat or bortezomib alone but a robust re-expression of E-cadherin protein with combined therapy.
FIGURE 5.
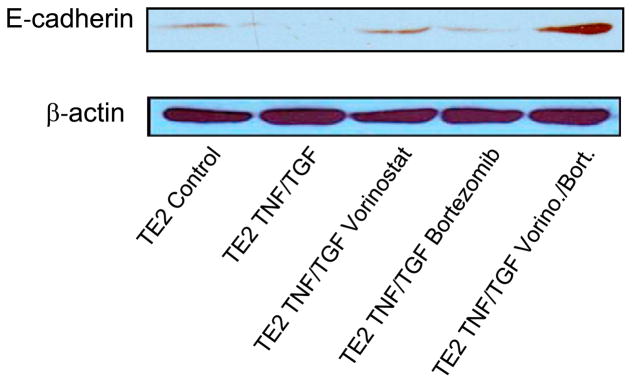
Combined treatment with vorinostat (Vorino) and bortezomib (Bort) induces protein expression of E-cadherin in esophageal cancer (TE2) cells. TNF, Tumor necrosis factor; TGF, transforming growth factor.
Finally, to ascertain the specific role of E-cadherin in modulating the anti-EMT response generated by combined HDAC and proteasome inhibition, 3-dimensional cell cultures were created. As shown in Figure 6, TNF-α and TGF-β–treated cells in 3-dimensional culture invaded and migrated within a collagen matrix, and treatment with combined vorinostat and bortezomib abolished this process of tumor cell invasion. Treatment of the tumor spheres subjected to combined therapy with a specific E-cadherin–blocking antibody resulted in a dramatic increase in cell invasion. This strongly suggests that E-cadherin is a primary mediator of vorinostat and bortezomib–induced abolition of EMT in esophageal cancer cells.
FIGURE 6.

Three-dimensional esophageal cancer metastasis decreased with combined vorinostat (V) and bortezomib (B) treatment. Addition of E-cadherin–blocking antibody (E-cad anti) to tumor cells treated with vorinostat and bortezomib induced increased metastasis in both squamous carcinoma (TE2, A) and adenocarcinoma (SKGT4, B) cell lines.
DISCUSSION
This study demonstrates the potential utility of combined HDAC and proteasome inhibition in attenuating esophageal cancer EMT and suggests that E-cadherin re-expression found with treatment may be critical for metastatic inhibition. E-cadherin is a 120-kDa transmembrane protein critical for maintaining cell–cell interaction. Loss of E-cadherin has been demonstrated in numerous forms of cancer, including esophageal cancer.12 Furthermore, E-cadherin downregulation has been found to be a hallmark of the initiation of EMT.3
The association between decreased E-cadherin expression and esophageal cancer is well documented. A recent review of 187 articles evaluating markers of squamous esophageal cancer concluded that E-cadherin was among the 4 “most potential markers” for the prediction of survival in patients with esophageal cancer.13 Imamura and colleagues14 demonstrated that reduced tumor E-cadherin was associated with poor prognosis in 416 patients with esophageal cancer. In another study of 105 patients, reduced tumor E-cadherin correlated with poorer survival, grade, and clinical stage.15 Additionally, that study found that reduced intratumoral E-cadherin was associated with increased incidence of lymph node and venous metastases.15 With respect to esophageal adenocarcinoma, intratumoral E-cadherin was found in 75% of 59 esophageal adenocarcinoma specimens, and patients with reduced E-cadherin had a significantly worse prognosis, with a hazard ratio of 3.3.16
Our laboratory has previously demonstrated efficacy of the combined molecularly targeted therapy of bortezomib and vorinostat in non–small cell lung cancer.4 Previous studies have demonstrated that the tested concentrations of both vorinostat and bortezomib are safely achievable in human subjects17,18; however, no studies have investigated this combination therapy in the treatment of esophageal cancer. We focused our investigation on the potential properties of these drugs to inhibit EMT because of evidence in the literature supporting the important role of EMT in the metastatic process. We therefore sought to determine the expression patterns of known metastatic suppressor genes, including CDH1, BRMS1, NME1, ARHGDIB, KISS1, and CD44. This use of histone deacetylase and proteasome inhibition in the model was based on previous work with this drug combination with non–small cell lung cancer cell lines and pilot studies from our laboratory with esophageal cancer cell lines.4 Yoshikawa and colleagues5 found that HDAC inhibition suppressed TGF-β1–induced EMT responsible for tubulointerstitial fibrosis of the kidney and that this suppression of EMT was associated with increased E-cadherin transcription. In addition, HDAC inhibition was found to suppress metastasis in pancreatic cancer.19
Bortezomib, a 26S proteasome inhibitor, has been shown to inhibit tumor growth and angiogenesis in human squamous cancer cell lines.20 Saitoh and colleagues21 also demonstrated that bortezomib stabilizes cell surface E-cadherin during TGF-β–induced EMT. In contrast to our work, that study demonstrated no significant decrease in cancer cell mobility after bortezomib treatment. This discrepancy between our findings and those of Saitoh and colleagues21 could be explained by several observations. First, the studies used different cell lines and proteasome inhibitors. Second, Saitoh and colleagues’ work21 used TGF-β3, whereas our model used TGF-β1. Although these isoforms recognize the same receptors, it is known that they have different and sometimes opposing biologic functions in certain models.22 Third, our study used 2 invasion assays to quantify cell mobility, whereas Saitoh and colleagues’ study21 used wound healing assays to characterize mobility.
Recent work may provide some insight into the mechanism by which HDAC inhibition and proteasome inhibition increase E-cadherin at the promoter level. Von Burstin and colleagues19 demonstrated that inactivation of CDH1 expression in metastatic pancreatic cancer cell lines is mediated through a repressor complex containing HDAC1, HDAC2, and SNAIL. Furthermore, that study showed that TGF-β–mediated CDH1 repression is dependent on HDAC activity. Additionally, knowing that SNAIL binding sites are present on the CDH1 promoter, it is possible that bortezomib inhibits SNAIL, thereby relieving the transcriptional repression on the CDH1 promoter.23 Finally, CDH1 promoter activity may also be regulated by methylation through histone modification by means of methyltransferase genes, such as EZH1 and EZH2.24
There has been limited work investigating this combination therapy for the treatment of cancer. Recently, combined vorinostat and bortezomib therapy has been found to prevent synergistically proliferation of colorectal cancer cell lines.25 Previously published work and the results of this study suggest that one mechanism through which this combined therapy inhibits metastasis may be synergistic re-expression of CDH1.
There are several limitations to this study. First, we used only 2 human esophageal cancer cell lines, 1 squamous carcinoma and 1 adenocarcinoma. Thus investigation of other cell lines may be advantageous. Second, this study investigated EMT with only TGF-β and TNF-β. In patients with esophageal cancer metastasis, however, a multitude of cytokines, transcription factors, and proteins likely interact with each other to initiate metastasis. This model cannot account for all these other factors potentially involved in EMT and metastasis. Clearly, animals studies in which these esophageal cancer cell lines undergo EMT and are subsequently evaluated for metastatic lesions after this molecularly targeted therapy would be useful in establishing the validity of this mechanism in vivo.
In conclusion, combined HDAC and proteasome inhibition attenuates esophageal cancer EMT by upregulating E-cadherin expression in human esophageal cancer cell lines. This study highlights the importance of E-cadherin in modulating EMT in esophageal cancer and provides insight into the importance of restoring intratumoral E-cadherin levels to achieve maximal therapeutic efficacy when using these molecularly targeted therapies. Because of the dismal prognosis for patients with esophageal cancer, further investigation of this combined molecularly targeted therapy is warranted.
Supplementary Material
Abbreviations and Acronyms
- ARHGDIB
Rho guanosine diphosphate dissociation inhibitor β gene
- BRMS1
breast cancer metastasis suppressor 1 gene
- CDH1
gene for E-cadherin
- EMT
epithelial–mesenchymal transition
- HDAC
histone deacetylase
- GAPDH
gene for glyceraldehyde-3-phosphate dehydrogenase
- KISS1
KiSS-1 metastasis-suppressor gene
- NME1
protein (NM23A) expressed in nonmetastatic cells 1
- PCR
polymerase chain reaction
- TGF-β
transforming growth factor β
- TNF-α
tumor necrosis factor α
Footnotes
Read in part at the Thirty-fifth Annual Meeting of The Western Thoracic Surgical Association, Banff, Alberta, Canada, June 24–27, 2009.
Disclosures: None.
Supplemental material is available online.
References
- 1.Cui W, Fowlis DJ, Bryson S, Duffie E, Ireland H, Balmain A, et al. TGFβ1 inhibits the formation of benign skin tumors, but enhances progression to invasive spindle carcinomas in transgenic mice. Cell. 1996;86:531–42. doi: 10.1016/s0092-8674(00)80127-0. [DOI] [PubMed] [Google Scholar]
- 2.Derynck R, Akhurst RJ, Balmain A. TGF-β signaling in tumor suppression and cancer progression. Nat Genet. 2001;29:117–29. doi: 10.1038/ng1001-117. [DOI] [PubMed] [Google Scholar]
- 3.Thiery JP. Epithelial-mesenchymal transitions in tumour progression. Nat Rev Cancer. 2002;2:442–54. doi: 10.1038/nrc822. [DOI] [PubMed] [Google Scholar]
- 4.Denlinger CE, Keller MD, Mayo MW, Broad RM, Jones DR. Combined proteasome and histone deacetylase inhibition in non-small cell lung cancer. J Thorac Cardiovasc Surg. 2004;127:1078–86. doi: 10.1016/s0022-5223(03)01321-7. [DOI] [PubMed] [Google Scholar]
- 5.Yoshikawa M, Hishikawa K, Marumo T, Fujita T. Inhibition of histone deacetylase activity suppresses epithelial-to-mesenchymal transition induced by TGF-β1 in human renal epithelial cells. J Am Soc Nephrol. 2007;18:58–65. doi: 10.1681/ASN.2005111187. [DOI] [PubMed] [Google Scholar]
- 6.Hosler MR, Wang-Su ST, Wagner BJ. Role of the proteasome in TGF-β signaling in lens epithelial cells. Invest Ophthalmol Vis Sci. 2006;47:2045–52. doi: 10.1167/iovs.05-0650. [DOI] [PubMed] [Google Scholar]
- 7.Mayo MW, Denlinger CE, Broad RM, Yeung F, Reilly ET, Shi Y, et al. Ineffectiveness of histone deacetylase inhibitors to induce apoptosis involves the transcriptional activation of NF-κ B through the Akt pathway. J Biol Chem. 2003;278:18980–9. doi: 10.1074/jbc.M211695200. [DOI] [PubMed] [Google Scholar]
- 8.Liu Y, Smith PW, Jones DR. Breast cancer metastasis suppressor 1 functions as a corepressor by enhancing histone deacetylase 1-mediated deacetylation of RelA/p65 and promoting apoptosis. Mol Cell Biol. 2006;26:8683–96. doi: 10.1128/MCB.00940-06. [DOI] [PMC free article] [PubMed] [Google Scholar]
- 9.Smith PW, Liu Y, Siefert SA, Moskaluk CA, Petroni GR, Jones DR. Breast cancer metastasis suppressor 1 (BRMS1) suppresses metastasis and correlates with improved patient survival in non–small cell lung cancer. Cancer Lett. 2009;276:196–203. doi: 10.1016/j.canlet.2008.11.024. [DOI] [PMC free article] [PubMed] [Google Scholar]
- 10.Del Duca D, Werbowetski T, Del Maestro RF. Spheroid preparation from hanging drops: characterization of a model of brain tumor invasion. J Neurooncol. 2004;67:295–303. doi: 10.1023/b:neon.0000024220.07063.70. [DOI] [PubMed] [Google Scholar]
- 11.Guo HB, Lee I, Kamar M, Pierce M. N-acetylglucosaminyltransferase V expression levels regulate cadherin-associated homotypic cell-cell adhesion and intracellular signaling pathways. J Biol Chem. 2003;278:52412–24. doi: 10.1074/jbc.M308837200. [DOI] [PubMed] [Google Scholar]
- 12.Wijnhoven BP, Dinjens WN, Pignatelli M. E-cadherin-catenin cell-cell adhesion complex and human cancer. Br J Surg. 2000;87:992–1005. doi: 10.1046/j.1365-2168.2000.01513.x. [DOI] [PubMed] [Google Scholar]
- 13.Lin DC, Du XL, Wang MR. Protein alterations in ESCC and clinical implications: a review. Dis Esophagus. 2009;22:9–20. doi: 10.1111/j.1442-2050.2008.00845.x. [DOI] [PubMed] [Google Scholar]
- 14.Prognostic significance of CyclinD1 and E-Cadherin in patients with esophageal squamous cell carcinoma: multiinstitutional retrospective analysis. Research Committee on Malignancy of Esophageal Cancer, Japanese Society for Esophageal Diseases. J Am Coll Surg. 2001;192:708–18. [PubMed] [Google Scholar]
- 15.Zhao XJ, Li H, Chen H, Liu YX, Zhang LH, Liu SX, et al. Expression of e-cadherin and β-catenin in human esophageal squamous cell carcinoma: relationships with prognosis. World J Gastroenterol. 2003;9:225–32. doi: 10.3748/wjg.v9.i2.225. [DOI] [PMC free article] [PubMed] [Google Scholar]
- 16.Falkenback D, Nilbert M, Oberg S, Johansson J. Prognostic value of cell adhesion in esophageal adenocarcinomas. Dis Esophagus. 2008;21:97–102. doi: 10.1111/j.1442-2050.2007.00749.x. [DOI] [PubMed] [Google Scholar]
- 17.Kelly WK, Richon VM, O’Connor O, Curley T, MacGregor-Curtelli B, Tong W, et al. Phase I clinical trial of histone deacetylase inhibitor: suberoylanilide hydroxamic acid administered intravenously. Clin Cancer Res. 2003;9:3578–88. [PubMed] [Google Scholar]
- 18.Lu C, Gallegos R, Li P, Xia CQ, Pusalkar S, Uttamsingh V, et al. Investigation of drug-drug interaction potential of bortezomib in vivo in female Sprague-Dawley rats and in vitro in human liver microsomes. Drug Metab Dispos. 2006;34:702–8. doi: 10.1124/dmd.105.008060. [DOI] [PubMed] [Google Scholar]
- 19.von Burstin J, Eser S, Paul MC, Seidler B, Brandl M, Messer M, et al. E-cadherin regulates metastasis of pancreatic cancer in vivo and is suppressed by a SNAIL/HDAC1/HDAC2 repressor complex. Gastroenterology. 2009;137:361–71. 371.e1–5. doi: 10.1053/j.gastro.2009.04.004. [DOI] [PubMed] [Google Scholar]
- 20.Sunwoo JB, Chen Z, Dong G, Yeh N, Crowl Bancroft C, Sausville E, et al. Novel proteasome inhibitor PS-341 inhibits activation of nuclear factor-κ B, cell survival, tumor growth, and angiogenesis in squamous cell carcinoma. Clin Cancer Res. 2001;7:1419–28. [PubMed] [Google Scholar]
- 21.Saitoh M, Shirakihara T, Miyazono K. Regulation of the stability of cell surface E-cadherin by the proteasome. Biochem Biophys Res Commun. 2009;381:560–5. doi: 10.1016/j.bbrc.2009.02.098. [DOI] [PubMed] [Google Scholar]
- 22.Foitzik K, Paus R, Doetschman T, Dotto GP. The TGF-β2 isoform is both a required and sufficient inducer of murine hair follicle morphogenesis. Dev Biol. 1999;212:278–89. doi: 10.1006/dbio.1999.9325. [DOI] [PubMed] [Google Scholar]
- 23.Wu Y, Evers BM, Zhou BP. Small C-terminal domain phosphatase enhances snail activity through dephosphorylation. J Biol Chem. 2009;284:640–8. doi: 10.1074/jbc.M806916200. [DOI] [PMC free article] [PubMed] [Google Scholar]
- 24.Blumenberg M, Gao S, Dickman K, Grollman AP, Bottinger EP, Zavadil J. Chromatin structure regulation in transforming growth factor-β-directed epithelial-mesenchymal transition. Cell Tissues Organs. 2007;185:162–74. doi: 10.1159/000101317. [DOI] [PubMed] [Google Scholar]
- 25.Pitts TM, Morrow M, Kaufman SA, Tentler JJ, Eckhardt SG. Vorinostat and bortezomib exert synergistic antiproliferative and proapoptotic effects in colon cancer cell models. Mol Cancer Ther. 2009;8:342–9. doi: 10.1158/1535-7163.MCT-08-0534. [DOI] [PMC free article] [PubMed] [Google Scholar]
Associated Data
This section collects any data citations, data availability statements, or supplementary materials included in this article.