

Abstract
Neurexins and neuroligins are synaptic cell-adhesion molecules that are essential for normal synapse specification and function and are thought to bind to each other trans-synaptically, but such interactions have not been demonstrated directly. Here, we generated neurexin-1β and neuroligin-1 and neuroligin-2 fusion proteins containing complementary “split” GFP fragments positioned such that binding of neurexin-1β to neuroligin-1 or neuroligin-2 allowed GFP reconstitution without dramatically changing their binding affinities. GFP fluorescence was only reconstituted from split-GFP-modified neurexin-1β and neuroligin-1 if and after neurexin-1β bound to its neuroligin partner; reassociation of the split-GFP components with each other did not mediate binding. Using trans-cellular reconstitution of GFP fluorescence from split-GFP-modified neurexin-1β and neuroligins as an assay, we demonstrate that trans-synaptic neurexin/neuroligin binding indeed occurred when mouse hippocampal neurons formed synapses onto non-neuronal COS-7 cells expressing neuroligins or when mouse hippocampal neurons formed synapses with each other. This visualization of synapses by neurexin/neuroligin binding prompted us to refer to this approach as “SynView.” Our data demonstrate that neurexin-1β forms a trans-synaptic complex with neuroligin-1 and neuroligin-2 and that this interaction can be used to label synapses in a specific fashion in vivo.
Keywords: microscopy, neurexin, neuroligin, split-GFP, synapses, SynView
Introduction
Synapse formation and maintenance involves the action of multiple trans-synaptic cell-adhesion molecules, among which neurexins are probably the best characterized (Knight et al., 2011; McMahon and Díaz, 2011; Krueger et al., 2012; Missler et al., 2012; Bang and Owczarek, 2013). Presynaptic neurexins bind to several postsynaptic cell-adhesion molecules, chiefly neuroligins (Ichtchenko et al., 1995 and 1996). However, although neurexins and neuroligins are well characterized, no direct demonstration of their presumed trans-synaptic interaction is available.
Several recent studies attempted to take advantage of the synaptic localization of neuroligins and neurexins for fluorescent tagging of synapses using the split-GFP system (Cabantous et al., 2005), an approach that could also demonstrate their trans-synaptic interaction directly. In the first system, called GFP Reconstitution Across Synaptic Partners (GRASP; Feinberg et al., 2008), the two split-GFP moieties were separately fused to the N-terminus of full-length C. elegans neuroligin-1 and the neuroligin-1 fusion proteins were expressed separately in presynaptic and postsynaptic neurons under the control of tissue-specific promoters (Fig. 1A). Although GRASP was successfully applied in multiple studies (Gordon and Scott, 2009; Kim et al., 2013; Shao et al., 2013), its mechanism of action is unknown because neuroligins are enriched in postsynaptic but not presynaptic specializations, bind to each other only in a cis- but not in a trans-configuration, and do not have N-termini that are close to each other in the homodimer (Araç et al., 2007; Fabrichny et al., 2007; Chen et al., 2008). Therefore, Yamagata and Sanes (2012) improved GRASP by fusing the split GFP moieties separately to the N-termini of rat neurexin-1β and neuroligin-1 (Fig. 1B). Although neurexin-1β and neuroligin-1 bind to each other in trans, it is also unclear how this GRASP version works because the N-termini of neuroligin-1 and neurexin-1β are far apart from each other in the neurexin/neuroligin complex (Araç et al., 2007; Fabrichny et al., 2007; Chen et al., 2008). In a completely different approach called mGRASP, Kim et al. (2012) fused the split-GFP moieties to the C-terminal sequences of rat neurexin-1β and neuroligin-1 with deletion of their extracellular ligand binding domains, but with insertion of an extracellular CD4 sequence into neurexin-1β (Fig. 1C). mGRASP lacks any interactions between the two components apart from their split-GFP moieties, which therefore drive intercellular binding in this system. Although the cytoplasmic sequences of neurexins and neuroligins are not known to drive their localization to synapses and are dispensable for a synaptic localization (but see Dresbach et al., 2004; Ko et al., 2009; Gokce and Südhof, 2013), the mGRASP system also labels synapses efficiently (Kim et al., 2012).
Figure 1.

Comparison of different approaches to visualizing synapses with neurexins and neuroligins and the split-GFP systems. A, Original C. elegans GRASP (Feinberg et al., 2008) in which the split-GFP moieties are fused to the N-termini of C. elegans neuroligin-1 (ceNL1; accession no. Q9XTG1). B, Transgenic GRASP (Yamagata and Sanes, 2012) in which the split-GFP moieties were fused to the N-termini of rat neuroligin-1 (rNL1; accession no. Q62765) and rat neurexin-1β (rNrx1β; accession no. Q63373). C, mGRASP (Kim et al., 2012) in which the split-GFP moieties are fused to the C-terminal sequences of mouse neuroligin-1 (mNL1; accession no. Q99K10) and to the N-terminus of human CD4-2 (hCD4-2; accession no. P01730; residues in blue) that in turn was fused to the C-terminal sequences of rat neurexin-1β (residues in red). D, SynView (this study) in which the split-GFP moieties were inserted into rat neuroligin-1 and neurexin-1β at positions predicted from the crystal structure of their complex to place them into close proximity. The proteins are drawn approximately to scale for comparison purposes; numbers indicate residue numbers. GFP1–10 and GFP11 denote the split-GFP moieties containing β-strands 1–10 and 11, respectively. SP, Signal peptide; EHD, Esterase homology domain; and LNS, laminin/neurexin/sex hormone binding domain.
In the present study, we have engineered novel fusion proteins of the split-GFP moieties with neurexin-1β and neuroligin-1 and neuroligin-2, such that GFP reconstitution from the split-GFP moieties only occurs upon neurexin/neuroligin binding (Fig. 1D). We show that, unlike the various GRASP-related systems, split-GFP complementation in our approach (referred to as “SynView1” and “SynView2” depending on whether neuroligin-1 or neuroligin-2, respectively, are used) requires actual neurexin/neuroligin binding, this binding occurs trans-synaptically, and it can faithfully label synapses.
Materials and Methods
Antibodies.
The following commercial antibodies were used in this study: mouse monoclonal anti-hemagglutinin (Covance, clone 16B12), mouse monoclonal anti-FLAG (Sigma, clone M2), rabbit polyclonal anti-GFP (Invitrogen), rabbit polyclonal anti-vesicular Glutamate Transporter 1 (Synaptic Systems), guinea pig polyclonal anti-vesicular Glutamate Transporter 1 (Millipore) rabbit polyclonal anti-vesicular GABA Transporter (Synaptic Systems), rabbit polyclonal anti-Bassoon (Synaptic Systems), mouse monoclonal anti-Microtubule Associated Protein 2 (Sigma, clone HM-2), and mouse monoclonal anti-PSD-95 (Abcam, clone 6G6–1C9). The rabbit polyclonal anti-synapsin 1 antibody (E028) was described previously (Chubykin et al., 2005).
Plasmid construction.
The sequences for the split GFP pair were based on the previously published bacterial sequences (Cabantous et al., 2005). These sequences were optimized for mammalian expression, flanked by 12 aa linkers, and synthesized as mini-genes (DNA 2.0). The resulting sequences were as follows (with linkers underlined): for GFP1-10, TCCGGAGGAGGTTCAGGTGGAGGTTCAGGAGGAGGAATGGGTGGAACAA GCATGAGCAAAGGTGAGGAACTGTTCACCGGCGTCGTACCTATTCTTGTGGAGCTGGACGGGGACGTCAATGGACACAAATTCTCAGTTCGCGGCGAGGGCGAGGGGGATGCTACCATCGGTAAGCTGACCCTCAAATTCATCTGCACTACGGGCAAGCTGCCGGTTCCCTGGCCTACTCTGGTCACTACACTGACTTACGGGGTCCAATGCTTCTCCAGATATCCCGACCACATGAAGCGGCACGACTTCTTTAAAAGCGCCATGCCGGAGGGGTACGTGCAGGAACGAACCATTTCCTTCAAAGATGATGGTAAGTATAAGACCAGAGCTGTCGTCAAGTTTGAGGGCGACACCCTCGTGAACCGCATCGAACTTAAGGGAACCGATTTTAAGGAAGACGGTAACATCCTGGGCCACAAGCTGGAGTACAATTTCAACTCACATAATGTGTACATTACGGCAGACAAGCAGAAAAACGGGATCAAAGCCAATTTTACAGTACGGCACAATGTCGAGGACGGCAGCGTCCAGCTGGCAGATCATTACCAGCAAAACACGCCTATCGGAGATGGGCCGGTGCTGCTTCCAGATAACCATTACCTTTCCACACAGACCGTGCTGAGCAAGGACCCTAACGAGAAGGGTGGAGGTTCTGGAGGTGGTTCTGGAGGTTCCGGA; for GFP11, ACGCGTGGAGGTTCAGGTGGAGGTTCAGGAGGAGGAAGAGATCACATGGTTTTGCACGAATACGTGAATGCTGCAGGAATTACAGGTGGAGGTTCTGGAGGTGGTTCTGGAGGTACGCGT.
Split-GFP modified Neurexin-1β constructs.
A BspEI site was generated in the CMV5-Nrx1βSS4− plasmid (Boucard et al., 2005) by means of site-directed mutagenesis (Stratagene). This plasmid encodes rat neurexin-1β lacking an insert at spice site 4 and also contains an N-terminal Flag tag and the trypsinogen signal peptide sequence. Insertion of the BspEI site was facilitated using the following oligos: For Nrx1β-GFP1–10S1Flag, 5′-tggcggcagagaactccggagatgccaacatcgc-3′ (sense) and 5′-gcgatgttggcatctccggag ttctctgccgcca-3′ (antisense); for Nrx1β-GFP1–10S2Flag, 5′-catcgaacgataccctgcatcc ggagggcgtcagc-3′ (sense) and 5′- gctgacgccctccggatgcagggtatcgttcgatg-3′ (antisense). The GFP1–10 sequence was then inserted into the generated BspEI sites to produce the final constructs. For Nrx1β-GFP1–10S2, a PCR fragment encoding the first 73 aa of neurexin-1β was amplified from PCMV-Nrx1β (Boucard et al., 2005) and subcloned into the EcoRI-BstEII sites of Nrx1β-GFP1–10S2. The entire neurexin-1β-coding sequence was then extracted by EcoRI-BamHI digest and subcloned in the FUW lentiviral vector to generate Nrx1β-GFP1–10S2. For the IgNrx1β-GFP1–10S2 construct, a PCR fragment containing the coding sequence of the extracellular part of Nrx1β-GFP1–10S2 was subcloned into the EcoRI-SalI sites of the pCMV-IgNrx1β expression vector (Ushkaryov et al., 1994).
Split GFP-modified neuroligin-1 constructs.
The pCMV-NL1FlagΔΒ expression vector, containing the rat neuroligin-1 sequence lacking an insert at splice-site B fused with an N-terminal Flag tag and the trypsinogen signal peptide (Boucard et al., 2005), was used to make the NL1-GFP11S1Flag and NL1-GFP11S2Flag constructs. An MluI site was generated inside the coding sequence of neuroligin-1 by means of site-directed mutagenesis (Stratagene) using the following oligos: for NL1-GFP11S1Flag, 5′- ggagatatt cgggacacgcgtagtgggggtcccaaa-3′ (sense) and 5′-tttgggacccccactacgcgtgtcccgaatatctcc-3′ (antisense); for NL1-GFP11S2Flag, 5′-ataatctcaatgacatttctcagacgcgttatacctcga caacaactaaagt-3′ (sense) and 5′- actttagttgttgtcgaggtataacgcgtctgagaaatgtcattgagattat-3′ (antisense). The GFP11 sequence was then inserted into the engineered MluI sites to make the final constructs. For the NL1-GFP11S2 expression vector, a PCR fragment was amplified from pCMV-NL1ΔΒ (Boucard et al., 2005) encoding the initial 197 aa of neuroligin-1 and subcloned into the EcoRI (blunted) and BsrGI sites of NL1-GFP11S2Flag. Finally, a double hemagglutinin (HA) epitope tag was inserted in the RsrII site by means of oligonucleotide ligation. To generate NL1mt32-GFP11S2Flag, a BsrGI-HpaI fragment from pCMV-NL1mt32 (Ko et al., 2009) was subcloned to the same sites of the NL1-GFP11S2Flag construct. Following the same strategy, the NL1mt32-GFP11S2 construct was made by subcloning into the BsrGI-HpaI sites of NL1-GFP11S2.
Split-GFP-modified neuroligin-2 constructs.
To produce the NL2-GFP11S2 expression construct, a KpnI site was generated in pCMV-NL2 (Lee et al., 2013) by site-directed mutagenesis (Stratagene) using 5′-aacctgcacacagagggtaccctcttcaccaccacc-3′ (sense) and 5′-ggtggtggtgaagagggtaccctctgtgtgcaggtt-3′ (antisense) oligos. The GFP11 sequence was then inserted into the engineered KpnI site. A triple HA epitope tag was inserted in the downstream MFEI site by means of oligonucleotide ligation to generate the final NL2-GFP11S2 expression vector.
Production of recombinant Ig fusion proteins.
For expression of recombinant Ig fusion proteins, HEK293T cells were cultured in 10 cm dishes until they reached 80% confluence. Cells were then transfected using calcium phosphate with 20 μg of cDNA encoding the various Ig fusion proteins. After 4 d, the cell media containing the soluble Ig proteins were harvested and cleared by centrifugation at 1000 × g. Supernatants were adjusted to 10 mm HEPES-NaOH, pH 7.4, 1 mm EDTA, and protease inhibitors (Roche Applied Science) and incubated overnight with protein A-Sepharose beads (GE Healthcare) to bind the human IgG Fc domain. The beads were then washed to remove unbound proteins.
Saturation-ligand-binding assays.
Saturation-ligand-binding assays were performed as described previously (Boucard et al., 2012). Transfected HEK293 cells were incubated in DMEM containing 50 mm HEPES-NaOH, pH 7.4, 2 mm CaCl2, 2 mm MgCl2, 0.1% BSA, and serial dilutions of Ig fusion proteins for a period of 16 h at 4°C with gentle agitation. Cells were then washed 3 times with cold DMEM and fixed with 4% paraformaldehyde for 10 min on ice. Cells were then incubated at room temperature for 15 min in blocking solution containing PBS and 3% BSA, followed by rgw addition of rabbit anti-human IgG antibody coupled to HRP (1:80 000 ratio in blocking solution) for an additional hour. For the colorimetric assay, cells were washed 3 times with blocking solution and once with PBS and incubated with 3,3′,5,5′-tetramethylbenzidine peroxidase enzyme immunoassay solution (Bio-Rad) at room temperature for 10 min under vigorous agitation until appearance of blue coloration. Finally, the reaction was stopped by addition of an equal volume of 1 n sulfuric acid, which produced a yellow coloration, and absorbance at 450 nm was measured using an Apollo-8 LB912 plate reader (Berthold Technologies). The ligand concentration was plotted against the difference in absorbance measured between transfected and mock-transfected cells and the dissociation constant (Kd) was determined using Scatchard plot analysis.
Cell adhesion assays.
HEK293T cells were individually transfected with the different expression vectors as indicated in the figures. After 48 h of incubation, cells were detached using 1 mm EDTA in PBS, mixed, and incubated under slow rotation at room temperature in DMEM containing 10% FBS, 50 mm HEPES-NaOH, pH 7.4, 10 mm CaCl2, and 10 mm MgCl2. The extent of cell aggregation was assessed after 24 h by removing aliquots, spotting them onto culture slides (Falcon; BD Biosciences), and imaging by epifluorescence microscopy. For confocal imaging, assay aliquots were seeded on coverslips and incubated overnight with DMEM containing 10% fetal bovine serum. Coverslips were then fixed with 4% paraformaldehyde and processed for immunocytochemistry. Images were then acquired in a confocal microscope (TCS SP-2; Leica).
Artificial synapse formation assay.
COS-7 cells were transfected with NL1Flag, NL1-GFP11S2Flag, or NL1mt32-GFP11S2Flag using FuGene-6 (Roche). Transfected cells were trypsinized 24 h later and seeded onto cultured hippocampal neurons at 10 d in vitro (DIV 10), which were already infected with Nrx1β-GFP1–10S2 at DIV 4. After 48 h, the cocultures were fixed with 4% paraformaldehyde and immunostained with antibodies against Flag (for neuroligins) and the presynaptic marker synapsin I. All images were acquired by confocal microscopy (TCS SP-2; Leica). For quantifications, the contours of transfected COS-7 cells were chosen as the region of interest. The fluorescence intensities of SynView1 (green) and synapsin I (red) puncta normalized to each COS-7 cell area were quantified using MetaMorph Software (Molecular Devices). Statistical significance was determined using Student's t test.
Primary hippocampal cultures.
Primary hippocampal neuronal cultures were prepared from newborn pups of CD1 mice of either sex according to standard protocols (Maximov et al., 2007). Hippocampi were dissected and dissociated by incubation in a digestion solution containing 10 U/ml papain, 1 μm CaCl2, and 0.5 μm EDTA for 20 min at 37°C. Digested tissue was further dissociated with gentle pipetting and the suspension was plated on Matrigel (Collaborative Biomedical Products)-coated circular glass coverslips (Ø 12 mm) in MEM (Invitrogen) supplemented with B27 (Invitrogen), glucose, transferrin, and 5% fetal bovine serum. Glial growth was controlled by replacing 50% of conditioned media with fresh medium containing 4 mm cytosine arabinoside (Ara-C) 2 d after plating. The cultures were maintained in medium containing 2 mm Ara-C thereafter.
Lentiviral preparation and infection.
Lentiviruses were produced essentially as described previously (Maximov et al., 2009). The lentiviral expression vector for Nrx1β-GFP1–10S2 and three helper plasmids (pRSV-REV, pMDLg/pRRE, and vesicular stomatitis virus G-protein-expressing plasmid) were cotransfected into HEK293T cells at 4, 2, 2, and 2 μg of DNA per 25 cm2 culture area, respectively, using FUGENE 6 transfection reagent (Roche) and following the instructions of the manufacturer. The cell culture medium was harvested 48 h later, clarified from cell debris by centrifugation (750 × g for 5 min), and the supernatant containing lentiviral particles was added directly to the medium of cultured hippocampal neurons in 24-well plates (300 μl of supernatant per well). Hippocampal neuronal cultures were infected with Nrx1β-GFP1–10S2 on DIV 5. All steps were performed under level 2 biosafety conditions.
Transfection of cultured neurons.
Neuronal transfection was performed using calcium phosphate as described previously (Jiang and Chen, 2006).
Immunofluorescence staining of hippocampal neurons.
Primary neurons were washed once with PBS and fixed with 4% paraformaldehyde for 10 min on ice. Cells were then permeabilized with 0.5% Triton X-100 in PBS on ice for 10 min, followed by a room temperature incubation in blocking solution containing 2% goat serum and 0.1% Triton X-100 in PBS for 30 min. Primary antibodies were then added in the same solution and the incubation was continued for another 2 h. Cells were washed 3 times with PBS and incubated for 1 h at room temperature with the corresponding Alexa Fluor–conjugated secondary antibodies (Invitrogen). Cells were finally washed again three times with PBS and once with water before mounting on slides using medium containing DAPI for nuclear staining. Slides were then imaged a Leica TCS2 confocal laser scanning microscope and maximal projections of z-section stacks of images were collected.
Colocalization analysis.
For the computer-based quantitative analysis of colocalization, we used the cell scoring plugin of the MetaMorph Software (Molecular Devices), which provides automated measurements of percentages of positive puncta for a specific marker. Confocal images of 2–3 secondary dendrites from 1 neuron were used for puncta segmentation and determination of overlapping pixels. Data were collectected from 3–4 independent experiments with ∼15–20 neurons analyzed per experiment. Statistical significance was determined using Student's t test.
Results
Here, we aimed to design a molecular tool that would allow us to specifically visualize trans-synaptic interactions between neurexins and neuroligins. The concern with previous GRASP-related approaches that attempted to achieve this goal was that the various systems may not actually report a physiological interaction of a trans-synaptic cell-adhesion complex, but instead monitor the close approximation of two membranes at any given localization (Feinberg et al., 2008; Kim et al., 2012; Yamagata and Sanes, 2012). This concern was raised due to the fact that the cytoplasmic and transmembrane sequences of neurexin and neuroligin may not be sufficient to specifically localize these molecules to synapses, that the formation of GFP from the split-GFP moieties in all of these systems was not dependent on the formation of a neurexin/neuroligin complex, and that the binding of the components of the split-GFP system may cause artificial interactions between presynaptic and postsynaptic neurons that do not normally exist. Therefore, different from the GRASP approaches, the goal of the current experiments was to make split-GFP complementation dependent on a trans-synaptic interaction between neurexin and neuroligin.
SynView1 design
To devise an approach that would permit selective labeling of synapses, we took advantage of the split-GFP system similar to the GRASP approaches. Split-GFP strategies have been repeatedly and successfully implemented for identification of protein–protein interactions in living cells (Zhang et al., 2004; Kerppola, 2008). However, split-GFP based methods suffer from two potential problems.
The first potential problem is that fusion of exogenous fragments to a protein can impede its folding and destabilize it. To prevent this potential problem (which is especially relevant for membrane proteins), we used a split version of the superfolder GFP protein (Cabantous et al., 2005), which has been used successfully in the past for similar purposes (Feinberg et al., 2008; Kim et al., 2012; Yamagata and Sanes, 2012). Moreover, we based all fusions on the atomic structure of the neurexin-1β/neuroligin-1 complex that we had previously determined (Araç et al., 2007; Ko et al., 2009). In this manner, we inserted the split-GFP fragments into neurexin-1β and neuroligin-1 specifically at positions that do not impair their normal folding or their interactions.
The second potential problem of split-GFP approaches is that the GFP reconstitution itself may cause binding of the two fusion proteins to each other or dramatically increase their binding affinities, thereby producing false-positive results. To address this problem, we designed our split-GFP fusions in a manner—again, based on the crystal structure—whereby the split-GFP moieties would only become close to each other after binding of their resident neurexin-1β and neuroligin-1 moieties to each other. In this design, we inserted the larger GFP1–10 fragment into neurexin-1β and the smaller GFP11 fragment into neuroligin-1. Both fragments were inserted into internal sequences of neurexin-1β and neuroligin-1 because the crystal structure predicted that simply fusing the split-GFP moieties to the neurexin-1β and neuroligin-1 N-terminal sequences would not allow efficient reconstitution of GFP after neurexin/neuroligin binding.
Based on our structural analyses, we identified two potential combinations of insertion points for the split-GFP moieties in neurexin-1β and neuroligin-1 (referred to as the “S1” and “S2” versions). The corresponding insertion points for neurexin-1β were between residues N275 and D276 (generating Nrx1β-GFP1–10S1Flag, which also includes an N-terminal Flag epitope), and between A200 and G201 (generating Nrx1β-GFP1–10S2 and Nrx1β-GFP1–10S2Flag, which lack or include an N-terminal Flag epitope; Fig. 2A). The corresponding insertion points for neuroligin-1 were between residues D188 and S189 (generating NL1-GFP11S1Flag, which includes an N-terminal Flag epitope) and between residues Q641 and Y642 (generating NL1-GFP11S2 and NL1-GFP11S2Flag, which lack or include an N-terminal Flag epitope, respectively; Fig. 2A).
Figure 2.
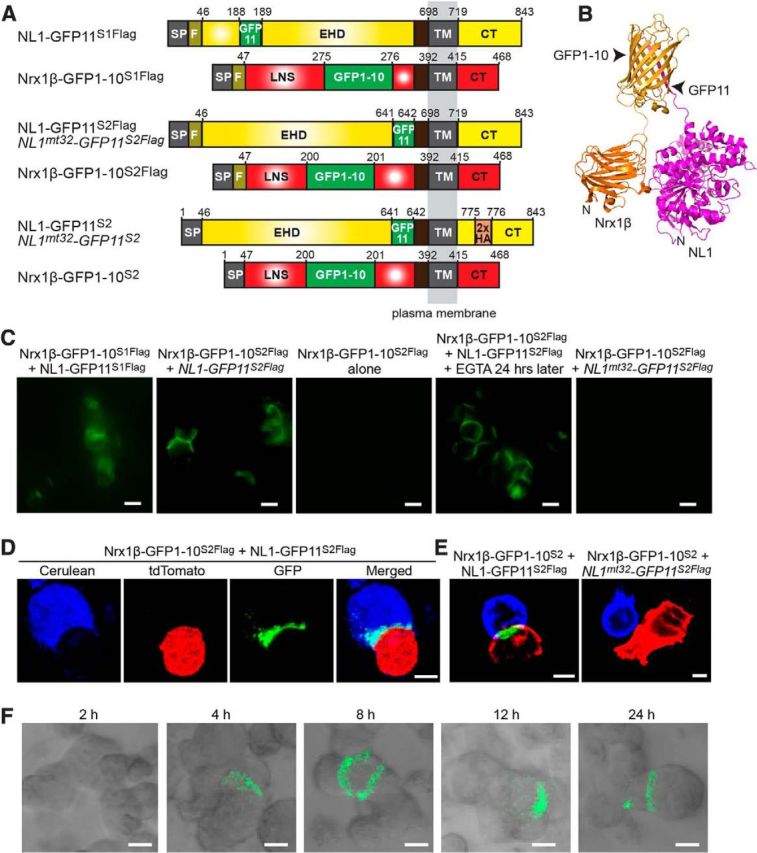
Design and validation of SynView1. A, Constructs used for the development of the SynView1 system. Numbers represent amino acid residues in sequences of rat neuroligin-1 (NL1) lacking splice site B (accession no. Q62765) and rat neurexin-1β (Nrx1β) lacking splice site 4 (accession no. Q63373). For the neurexin-binding mutant NL1mt32-GFP11S2, 5 point mutations were incorporated into the original NL1-GFP11S2 construct (L399A/N400A/D402N/E297A/K306A; Ko et al., 2009). SP, Signal peptide; F, Flag epitope; EHD, Esterase homology domain; TM, transmembrane region; CT, cytoplasmic tail; and LNS, laminin/neurexin/sex hormone binding domain. B, Graphic representation of the predicted structure of Nrx1β-GFP1–10S2 bound to NL1-GFP11S2, allowing the reconstitution of the two split-GFP fragments. C, HEK293 cells expressing different SynView1 constructs as indicated were mixed and the reconstituted GFP fluorescence was imaged after a 24 h coincubation in suspension culture. For EGTA-treated cells (fourth panel), cells were incubated a further 24 h in 5 mm EGTA. Scale bars, 10 μm. D, HEK293 cells expressing Nrx1β-GFP1–10S2Flag plus cerulean were mixed with cells coexpressing NL1-GFP11S2Flag plus tdTomato; development of GFP signal in the border of cell membrane contacts was monitored by fluorescence microscopy using three-color imaging for cerulean (blue), tdTomato (red), and GFP (green) Scale bar, 5 μm. E, HEK293 cells expressing Nrx1β-GFP1–10S2 were mixed with cells expressing NL1-GFP11S2Flag or NL1mt32-GFP11S2Flag and nonpermeabilized cells were immunostained with an anti-Flag antibody (blue) to visualize surface-exposed NL1-GFP11S2Flag or NL1mt32-GFP11S2Flag and an anti-GFP antibody (red) to label surface-exposed Nrx1β-GFP1–10S2. Cells were then imaged in a confocal microscope (green, SynView1 GFP-fluorescence); note that the GFP fragment present in Nrx1β-GFP1–10S2 reacts with GFP antibodies but does not exhibit fluorescence on its own and that, even though in the fifth panel, cells expressing Nrx1β-GFP1–10S2 and NL1mt32-GFP11S2Flag are brought into close proximity, no GFP reconstitution occurs. Scale bars, 5 μm. F, HEK293 cells expressing Nrx1β-GFP1–10S2Flag were mixed with cells expressing NL1-GFP11S2Flag and the reconstituted GFP fluorescence was imaged at the indicated time points after coincubation in suspension culture. Scale bars, 5 μm. Data show representative experiments independently repeated at least 3 times.
We also produced split-GFP-modified versions of the second insertion of split-GFP into neuroligin-1, but using the neuroligin-1 mutant “32” that we previously characterized, which is unable to bind to neurexin-1β but exhibits normal folding, surface transport, and targeting to dendritic spines (Araç et al., 2007; Ko et al., 2009). The latter manipulation generated NL1mt32-GFP11S2 and NL1mt32-GFP11S2Flag lacking or containing a Flag-epitope (Fig. 2A). The 32 mutant of neuroligin-1 serves as an excellent control for testing whether GFP-reconstitution requires neurexin-1β and neuroligin-1 binding. For all of our constructs, we modified the DNA sequences of the split-GFP fragments by optimizing codon usage for mice without altering the encoded amino acid sequence and included linker sequences of 12 residues composed of glycine and serine for all insertions to provide structural flexibility of the split-GFP moieties.
Specific trans-cellular interaction of split-GFP-modified neurexin-1β and neuroligin-1
We first aimed to test our SynView1 designs and their relative effectiveness. We transfected HEK293T cells separately with the neurexin-1β and neuroligin-1 expression plasmids (Fig. 2A) and mixed neurexin- and neuroligin-1-expressing cell populations 48 h after transfection (Fig. 2C). After overnight incubations, we monitored cell aggregates under a fluorescence microscope. In both the S1 and the S2 version of SynView1, we observed the appearance of GFP signal that was derived from the reconstitution of the split-GFP fragments (Fig. 2C,D). In the case of the S2 version, the fluorescence was defining the borders of the cell contacts; in contrast, the S1 version produced a diffuse cell staining. Therefore, we decided to use the design of the S2 pair (Fig. 2B) for all subsequent experiments. No signal was detected when only cells expressing Nrx1β-GFP1–10S2Flag were mixed. The GFP reconstitution appeared to be irreversible, because the signal persisted even after further incubation of the cell aggregates in EGTA-containing medium for up to 24 h (Fig. 2C).
A major issue that arises using split-GFP fusion interacting proteins is that the GFP fragments themselves have a significant binding affinity for each other (Cabantous et al., 2005), which could result in GFP reconstitution that is independent of neuroligin/neurexin binding. To control for the specificity of the GFP signal in our SynView1 system, we inserted the split-GFP moiety into mutant neuroligin-1, which is unable to bind to neurexin-1β (the 32 mutant neuroligin-1; Ko et al., 2009). No fluorescence was observed when cells expressing Nrx1β-GFP1–10S2Flag were mixed with cells expressing the neurexin-binding mutant NL1mt32-GFP11S2Flag (Fig. 2C,E). To verify that NL1mt32-GFP11S2Flag traffics normally and is expressed on the surface of HEK293 cells, we performed immunostaining in nonpermeabilized cells. Both NL1-GFP11S2 and NL1mt32-GFP11S2 were expressed in the surface of HEK293 cells (Fig. 2E). We next wanted to assess the kinetics of the GFP reconstitution in our SynView1 system. Therefore, we mixed cell populations expressing the two variants and incubated them at 37°C. We monitored the development of GFP fluorescence in samples taken at different time points and observed GFP signal appear after 4 h of incubation (Fig. 2F). Together, these data demonstrate that our SynView1 strategy allows the faithful detection of trans-cellular neurexin and neuroligin complexes with nondetectable unspecific cross-talk due to self-assembly of the split-GFP fragments.
Split-GFP modified neurexin-1β and neuroligin-1 interact with a nearly physiological affinity
To determine the affinity of the SynView1 pair interaction, we performed quantitative cell surface binding assays, which were previously shown to permit approximate calculations of binding affinities (Boucard et al., 2012). We produced and purified recombinant IgNrx1β and IgNrx1β-GFP1–10S2 (Fig. 3A). Transfected HEK293T cells expressing wild-type neuroligin-1 (NL1), NL1-GFP11S2Flag, or NL1mt32-GFP11S2Flag were incubated with increasing concentrations of soluble IgNrx1β or IgNrx-1β-GFP1–10S2. Mock-transfected HEK293T cells were used as negative controls and bound Ig fusion protein was quantified using an HRP-tagged secondary antibody against human Ig. Binding affinities were measured with a colorimetric assay and the net binding of IgNrx1β protein was calculated and plotted as a function of the protein concentration (Fig. 3B). Binding could be saturated and exhibited good reproducibility in independent transfection and incubation experiments.
Figure 3.

Binding affinities of Neurxin-1β and Neuroligin-1 are modestly increased upon insertion of split-GFP components. A, Purified soluble Ig-Nrx1β and Nrx1β-GFP1–10S2 fusion proteins containing the entire extracellular neurexin-1β sequences were analyzed by SDS-PAGE and Coomassie staining. HC, Heavy-chain Ig. B, Mock-transfected HEK293 cells or HEK293 cells expressing neuroligin-1 (NL1) or NL1-GFP11S2Flag were incubated with increasing concentrations of soluble Ig-Nrx1β or Ig-Nrx1β-GFP1–10S2 proteins, washed, and reacted with an HRP-conjugated antibody against the Ig domain. Ig-fusion-protein binding was determined colorimetrically and plotted as a function of Ig-Nrx1β or Nrx1β-GFP1–10S2 concentration after subtraction of the amount bound on mock-transfected cells. Data show representative experiment independently repeated multiple times. C, Binding affinities for each pair of neurexin-1β- and neuroligin-1-binding partners were calculated by Scatchard analysis. Affinities are shown as mean Kd values ± SEM (Nrx1β, n = 4; Nrx1β-GFP1–10S2, n = 3).
The Kds of the binding reactions were computed by fitting the binding curve to a Scatchard equation and assuming a single independent binding site for neurexin-1β in a neuroligin-1 molecule (Fig. 3B,C). Consistent with previous reports (Comoletti et al., 2006), we estimated a nanomolar affinity of neurexin-1β for neuroligin-1 (Kd = 1.2 ± 0.19 nm) and a similar high affinity for NL1-GFP11S2Flag (Kd = 1.29 ± 0.36 nm). Conversely, we calculated a lower binding affinity of Nrx1β-GFP1–10S2 for wild-type neuroligin-1 (Kd = 20.1 ± 2.8 nm), which was increased 3-fold when NL1-GFP11S2Flag was used (Kd = 6.9 ± 0.85 nm). No binding was observed on cells transfected with the neurexin-binding mutant NL1mt32-GFP11S2Flag (data not shown). These results show that the SynView1 partners exhibit a high binding affinity, which is in a similar nanomolar range as the binding affinity of the corresponding wild-type neurexin-1β and neuroligin-1 molecules. Importantly, the binding affinity of the SynView1 pair was not fortified by the presence of split-GFP fragments, providing another demonstration that our design primarily favors the neurexin–neuroligin binding instead of the self-assembly of the GFP pair.
SynView1 partners interact functionally to label synapses in artificial synapse formation assays
To determine whether the trans-interaction of the SynView1 partners is functional in a way that can tag synaptic specifications upon neurexin–neuroligin binding, we used a neuron–fibroblast coculture approach (Südhof, 2008). It has been shown previously that NL-1 expressed in non-neuronal cells such as COS-7 cells induces the formation of presynaptic specifications in contacting neuronal axons in the absence of other postsynaptic scaffolding proteins (Scheiffele et al., 2000; Chubykin et al., 2005; Ko et al., 2009). The formation of synapses in this preparation is referred to as the artificial synapse formation assay because the synapses induced represent a reduced system.
We infected cultures of hippocampal neurons at DIV 5 with lentiviruses expressing Nrx1β-GFP1–10S2 and, at DIV 10, we seeded on these cultures COS-7 cells transfected with NL1-GFP11S2Flag. When we imaged these cells 2 d later, we observed green fluorescent puncta on the surface of COS-7 cells at points of contact with axons of neurons expressing Nrx1β-GFP1–10S2 (Fig. 4A). These puncta colocalized with the presynaptic protein synapsin that was clustered on NL1-GFP11S2Flag-expressing COS-7 cells (Fig. 4C). In parallel experiments, we compared the synaptogenetic properties of NL1-GFP11S2Flag with those of wild-type NL1 carrying the same Flag epitope (NL1Flag; Fig. 4B). These two versions were indistinguishable in their ability to induce presynaptic clustering of synapsin (Fig. 4E). In contrast, we did not observe any GFP-positive signal on COS-7 cells transfected with the neurexin-binding mutant NL1mt32-GFP11S2Flag (Fig. 4D,E). These cells also did not show any synapsin clustering, which is consistent with previously published results (Ko et al., 2009). These data indicate that the SynView1 partners are both functional such that NL1-GFP11S2Flag can induce the clustering of presynaptic markers and Nrx1β-GFP1–10S2 facilitates this effect via binding to NL1-GFP11S2Flag. The resulting GFP signal effectively labels these artificial synaptic contacts, as shown by its colocalization with synapsin.
Figure 4.
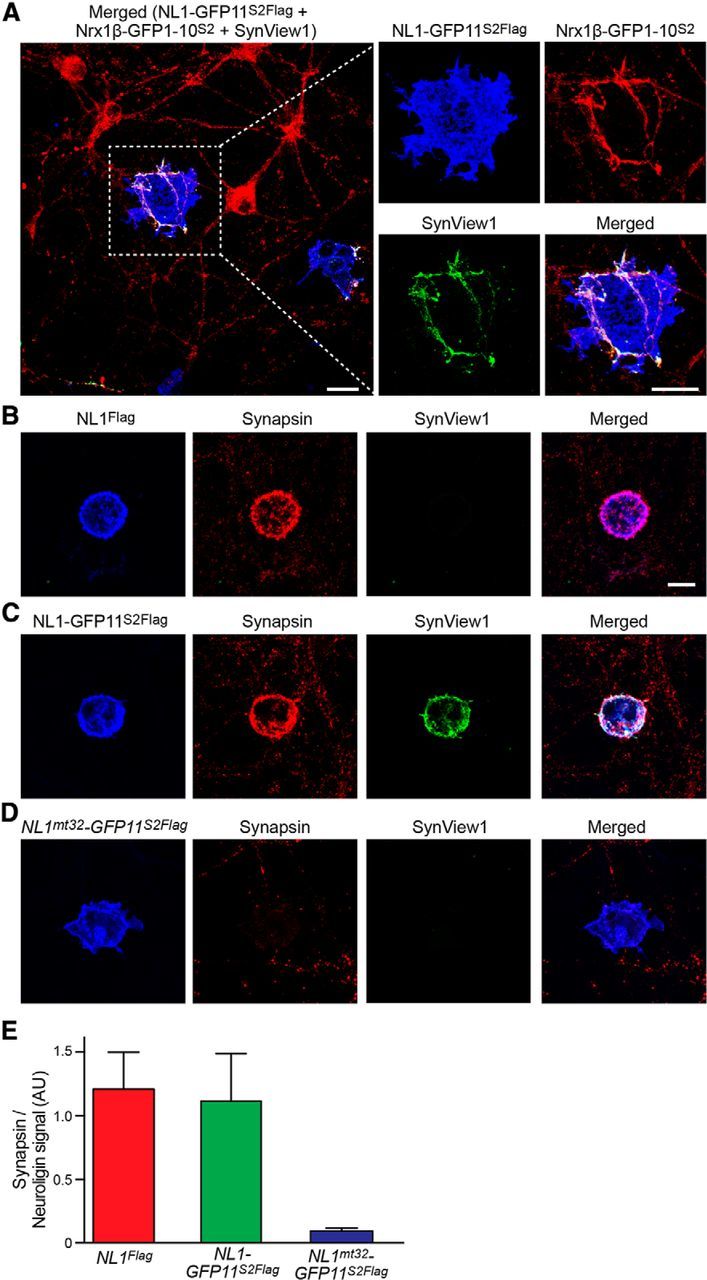
Analysis of artificial synapse formation between neurexin-1β expressing hippocampal neurons and neuroligin-1 expressing COS-7 cells using SynView1. A–D, Cultured hippocampal neurons were infected with a lentivirus expressing Nrx1β-GFP1–10S2 and cocultured with COS-7 cells expressing NL1-GFP11S2Flag (A, C), wild-type NL1 (NL1Flag; B) or NL1mt32-GFP11S2Flag (which lacks neurexin-binding; D). Reconstituted GFP fluorescence (green) representing SynView signal was combined with two-color immunoflurorescence labeling using antibodies against the Flag epitope to detect wild-type NL1Flag, NL1-GFP11S2Flag and NL1mt32 GFP11S2Flag (blue) (A–D) against GFP to detect Nrx1β-GFP1–10S2 (the split-GFP component of which reacts with GFP antibodies; red, A), or against synapsin to mark presynaptic terminals (red, B–D). Data show representative experiments independently repeated at least 3 times. Scale bars, 10 μm. E, Quantitative analysis of synapsin puncta intensities on COS-7 cells transfected with different NL1 constructs after 48 h of coculture with hippocampal neurons expressing Nrx1β-GFP1–10S2 (data are means ± SEM and are normalized to the respective NL1 signal; n = 3 independent experiments).
We next investigated whether SynView1 fluorescence could be used to monitor synapse formation in real time or if it lagged behind the actual synapse formation process due to the time required for GFP refolding to achieve a fluorescent GFP protein. To address this question, we measured SynView1 fluorescence signals at different time points during the artificial synapse formation assay and compared the SynView1 fluorescence signals with the presynaptic clustering of synapsin as a measure of synapse formation (Fig. 5A). Strikingly, we found that the SynView1 fluorescence signal was significantly delayed compared with presynaptic clustering of synapsin (Fig. 5B). Presynaptic synapsin clustering could be observed after as little as 5 h of coculture, whereas the SynView1 GFP signal did not develop until 48 h of coculture. The delay in SynView1 signal is probably caused by the time needed for the maturation of the GFP protein after reconstitution of the two fragments, but also indicates that this system—or any other split-GFP-based system—cannot be used to monitor the dynamics of synapse formation accurately.
Figure 5.
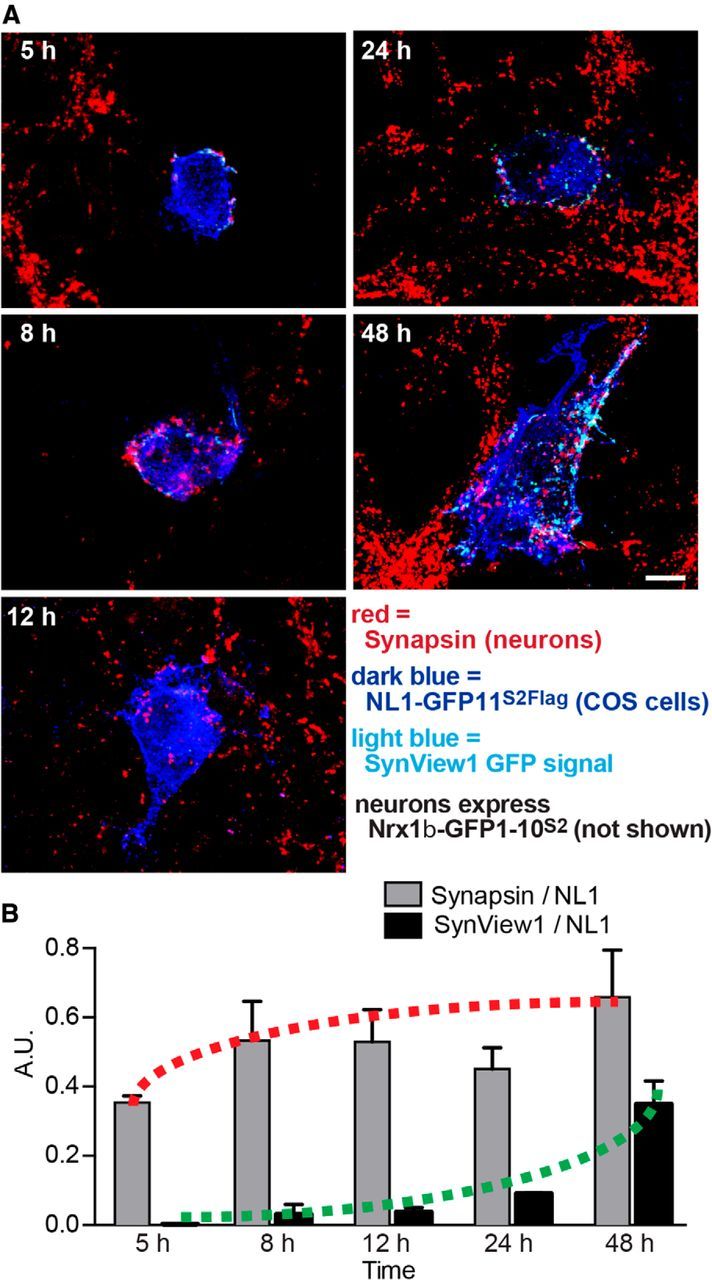
Time course of GFP complementation during artificial synapse formation monitored by SynView1. A, Representative images of COS-7 cells transfected with NL1-GFP11S2Flag and cocultured for 5, 8, 12, 24, and 48 h with hippocampal neurons expressing Nrx1β-GFP1–10S2. Cultured neurons were fixed and stained with antibodies to the Flag epitope of NL1-GFP11S2Flag (blue) and to the synaptic vesicle protein synapsin (red) and simultaneously imaged for native GFP fluorescence from the SynView1 signal. Scale bar, 5 μm. Data show representative experiments independently repeated at least 3 times. B, Quantitative analysis of the SynView1 and synapsin puncta intensities developing as a function of time on COS-7 cells during artificial synapse formation assays (data are means ± SEM and are normalized to the NL1-GFP11S2Flag signal; n = 3 independent experiments with minimum 15 cells at each time point).
Synview1 labels synapses in cultured neurons
We next explored the use of SynView1 in monitoring neurexin–neuroligin interactions at physiological synapses formed between neurons. Primary cultures of hippocampal neurons were infected with lentiviruses expressing the neurexin counterpart of SynView1, Nrx1β-GFP1–10S2, at DIV 5. At DIV 10, we transfected the same cultured neurons with a construct expressing NL1-GFP11S2. As a result of this experimental design, all neurons express presynaptic Nrx1β-GFP1–10S2, whereas a few sparsely transfected neurons additionally express NL1-GFP11S2.
Cultured neurons were fixed at DIV 14, immunolabeled, and imaged under confocal microscopy. We observed a very prominent punctate GFP signal, which colocalized perfectly with the expression of NL1-GFP11S2 (Fig. 6A,B). This signal was not present when the cultured neurons were transfected with NL1mt32-GFP11S2, which cannot bind neurexins (Fig. 6E–G), an indication that the SynView1 signal is specific to bound neurexin–neuroligin complexes and did not result from random reconstitution of the two GFP fragments.
Figure 6.
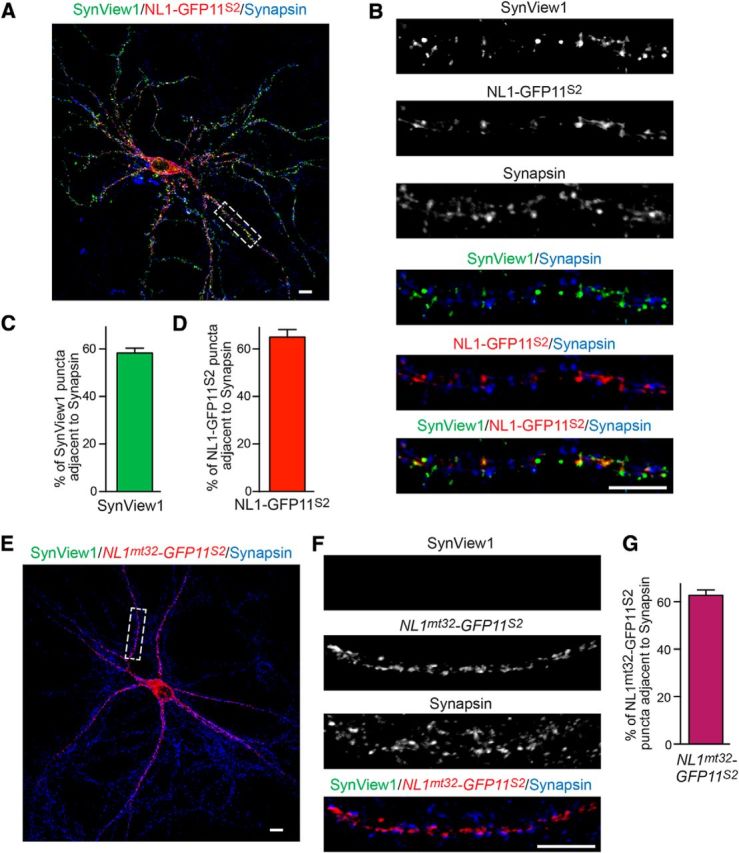
Visualization of synapses using SynView1 in cultured hippocampal neurons. A, Representative image of a transfected hippocampal neuron expressing NL1-GFP11S2 that is surrounded by neurons expressing Nrx1β-GFP1–10S2. Punctate SynView1 GFP fluorescence (green) was combined with immunofluorescence staining for NL1-GFP11S2 (using an anti-HA antibody; red) and synapsin (blue). Scale bar, 10 μm. B, High-magnification image of the boxed area in A showing individual and composite images of the Synview signal and NL1-GFP11S2 and synapsin-positive puncta. Scale bar, 10 μm. C, D, Quantitative analysis of the fraction of SynView1-positive (C) and NL1-GFP11S2-positive puncta (D) that are adjacent to synapsin-positive puncta. Data represent means ± SEM; n = 3 independent experiments. E, Representative image of a transfected hippocampal neuron expressing NL1mt32-GFP11S2 that is surrounded by neurons expressing Nrx1β-GFP1–10S2. No GFP fluorescence was observed, indicating inability of reconstitution of the split-GFP moieties. Cultures were stained for NL1mt32-GFP11S2 (using an anti-HA antibody; red) and synapsin (blue). Scale bar, 10 μm. F, High-magnification images of the boxed area in E showing individual and composite images of the different stainings. Scale bar, 10 μm. G, Quantitative analysis of the fraction of NL1mt32-GFP11S2-positive puncta that are adjacent to synapsin-positive puncta. Data represent means ± SEM; n = 3 independent experiments. Data show representative experiments independently repeated at least 3 times.
To validate that this signal was synaptic, we performed an extensive immunofluorescence analysis using antibodies against various synaptic markers (Figs. 6,7). We observed that SynView1 fluorescence was localized in close proximity to the synaptic vesicle protein synapsin (Fig. 6A,B). We then perfomed colocalization analyses by counting the fraction of SynView positive puncta that had overlapping areas with synapsin-positive puncta. Almost 60% of SynView puncta overlapped with synapsin (Fig. 6C). However, when we estimated the fraction of the NL1-GFP11S2-positive signal that was actually synaptic, we also found a similar percentage (Fig. 6D). These results suggest that there must be a small percentage of Nrx1β-GFP1–10S2 complexes with NL1-GFP11S2, which is extrasynaptic in our SynView in vitro setup. The SynView1 signal preferentially detected excitatory synapses, as indicated from the significantly higher colocalization with the excitatory synaptic marker vGLUT-1 compared with the inhibitory synaptic marker vGAT (Fig. 7A–C). Together, these data demonstrate that SynView1 can reliably label synaptic contacts in cultured neurons with a strong preference to excitatory synapses and without requirement for the use of antibodies.
Figure 7.

Analysis of SynView1-positive synapses in cultured neurons. A, Representative image of a transfected hippocampal neuron expressing NL1-GFP11S2 that is surrounded by neurons expressing Nrx1β-GFP1–10S2. Punctate SynView1 GFP fluorescence (green) was combined with immunofluorescence staining for vGAT (red) and vGLUT-1 (blue). Scale bar, 10 μm. B, High-magnification images of the boxed dendritic segment in A showing individual and composite images of the different stainings. Scale bar, 10 μm. C, Quantitative analysis of the percentage of SynView1-positive puncta that are adjacent to vGLUT1- or vGAT-positive puncta. Data represent means ± SEM; n = 3 independent experiments; **p < 0.01. Data show representative experiments independently repeated at least 3 times.
Neuroligin-2 can be successfully implemented in the SynView approach
The mouse genome contains 4 neuroligin genes, of which neuroligin-1, neuroligin-2, and neuroligin-3 are expressed at robust levels, whereas neuroligin-4 is expressed at vanishingly low levels (Varoqueaux et al., 2006). Recent studies have shown that, in contrast to neuroligin-1, which seems to be important for excitatory synaptic function, neuroligin-2 functions predominantly in inhibitory synapses (Chubykin et al., 2007; Poulopoulos et al., 2009). Therefore, we were interested in using neuroligin-2 in the SynView system, following the same strategy as for neuroligin-1.
We designed a SynView version of neuroligin-2 (called SynView2) by inserting the small GFP11 fragment into rat neuroligin-2 close to the C-terminal end of the esterase-homology domain at a position that is equivalent to that used for SynView1 in NL1-GFP11S2. Specifically, GFP11 was inserted between residues E614 and L615; in addition, a triple HA-epitope tag was inserted between residues P652 and E653 and the resulting construct was referred to as NL2-GFP11S2 (Fig. 8A).
Figure 8.

Development of neuroligin-2-based SynView2. A, Schematic drawing of the NL2-GFP11S2 construct used for SynView2. Numbers represent amino acid residues of rat neuroligin-2 (accession no. Q62888). SP, signal peptide; EHD, Esterase homology domain; TM, transmembrane region; and CT, cytoplasmic tail. B, HEK293 cells expressing Nrx1β-GFP1–10S2 were mixed with cells expressing NL2-GFP11S2 and development of the reconstituted GFP signal at the border of cell membrane contacts was monitored by fluorescence microscopy. Scale bar, 10 μm. C, Image of a hippocampal neuron sparsely transfected with NL2-GFP11S2 surrounded by neurons expressing lentivirally transduced Nrx1β-GFP1–10S2. Punctate SynView2 GFP fluorescence (green) was combined with immunofluorescence staining to NL2-GFP11S2 (using an anti-HA antibody; red) and synapsin (blue). D, High-magnification images of the boxed dendritic area in C illustrate individual and composite images of the Synview2 signal and NL2-GFP11S2 and synapsin-positive puncta. Scale bar, 10 μm. E, F, Quantitative analysis of the fraction of SynView2-positive (E) and NL1-GFP11S2-positive puncta (F) that are adjacent to synapsin-positive puncta. Data represent means ± SEM; n = 3 independent experiments. Data show representative experiments independently repeated at least 3 times.
We transfected HEK293T cells separately with Nrx1β-GFP1–10S2 or NL2-GFP11S2, mixed the cells, and imaged the resulting cell aggregates with an epifluorescence microscope. Similar to what we observed in our original approach using NL1-GFP11S2, we detected GFP signal across the border of contacting cells (Fig. 8B). No fluorescence appeared when cells expressing Nrx1β-GFP1–10S2 or NL2-GFP11S2 alone were mixed (data not shown). When applied in cultured hippocampal neurons, we observed that the signal was enriched in spines and colocalized to a high extent with synapsin (Fig. 8C–F). The GFP signal was also preferentially localized in inhibitory synapses, because GFP-positive puncta showed significantly higher colocalization with vGAT compared with vGLUT-1 (Fig. 9A–C). Together, these results show that neuroligin-2 could effectively replace neuroligin-1 in SynView approach to form a trans-synaptic junction with neurexin-1β that allows visualization of synapses in vitro.
Figure 9.

Analysis of SynView2-positive synapses in cultured neurons. A, Representative image of a transfected hippocampal neuron expressing NL2-GFP11S2 that is surrounded by neurons expressing Nrx1β-GFP1–10S2. Punctate SynView1 GFP fluorescence (green) was combined with immunofluorescence staining for vGAT (red) and vGLUT-1 (blue). Scale bar, 10 μm. B, High-magnification images of the boxed dendritic segment in A showing individual and composite images of the different stainings. Scale bar, 10 μm. C, Quantitative analysis of the percentage of SynView2-positive puncta that are adjacent to vGLUT1- or vGAT-positive puncta. Data represent means ± SEM; n = 3 independent experiments; *p < 0.05. Data show representative experiments independently repeated at least 3 times.
Discussion
In the present study, we used the crystal structure of the neurexin-1β/neuroligin-1 complex (Araç et al., 2007) as a guide to engineer into neurexin-1β and neuroligin-1 or neuroligin-2 the two components of the split-GFP system (Cabantous et al., 2005). We tested two versions of the constructs with different insertion positions for neuroligin-1 and identified one version that, in transfected HEK293 cells, mediates not only intercellular adhesion but also allows reconstitution of fluorescent GFP (Fig. 2). We then generated a mutant version of the split-GFP neuroligin-1/neurexin-1β pair in which neuroligin-1 carries point mutations that block Neurexin-1β binding (Ko et al., 2009). We found that these mutations also block reconstitution of GFP from the split-GFP present in the neuroligin-1/neurexin-1β pair, demonstrating that the split-GFP fragments can only form a fluorescent protein after neuroligin-1 and neurexin-1β binding (Fig. 2). This is a surprising result because, in the related GRASP and mGRASP systems, the split-GFP components were found to mediate intercellular adhesion on their own when displayed on the cell surface without any additional sequences that would place the split-GFP components into close proximity (Feinberg et al., 2008; Kim et al., 2012).
The fact that, in our system, the split-GFP components were only capable of reconstituting fluorescent GFP when neuroligin-1 and neurexin-1β bind to each other in an intercellular junction shows that our system allows direct visualization of a trans-cellular neuroligin-1/neurexin-1β interaction. We demonstrate that this interaction occurs at synapses, leading us to refer to the system as SynView1 (for neuroligin-1) or SynView2 (for neuroligin-2). To the best of our knowledge, this is the first direct visualization of a trans-cellular interaction in a manner dependent on the binding of the cell-adhesion molecules involved, the first direct visualization of a trans-synaptic cell-adhesion event, and the first direct demonstration of trans-synaptic neurexin–neuroligin interactions.
Clearly, the two fragments comprising the split-GFP system bind to each other on their own with a significant affinity and may enhance the interaction of proteins to which they are fused. However, we found that this interaction alone in our system was unable to support intercellular cell adhesion, possibly because of how they were placed into neurexin-1β and neuroligin-1. Specifically, when we inserted the split-GFP fragments into mutant neuroligin-1, which cannot bind neurexin-1β, no complementation was detected (Fig. 2C,E). Moreover, we found that, although neurexin-1β and neuroligin-1 containing the components of the split-GFP system exhibit a higher binding affinity than their wild-type counterparts, the increase was only modest (Fig. 3). It is possible that the addition of the split-GFP component gives the complex higher stability because we showed persistence of fluorescence after treatment with EGTA (Fig. 2C). In view of these findings, it is surprising that the split-GFP fragments, when fused to just the C-terminal, noninteracting sequences of neurexin-1β and neuroligin-1, associate into fluorescent GFP in the mGRASP system (Kim et al., 2012). We cannot at present explain these apparently contradictory observations.
We validated the SynView1 system in the artificial synapse-formation assay in which a non-neuronal cell (in our case, COS-7 cells) expresses a postsynaptic cell-adhesion molecule (in our case, neuroligin-1) and is cocultured with primary neurons (Figs. 4,5). We found that modified wild-type neuroligin-1 containing the split-GFP component fully mediated synapse formation in this assay and formed fluorescent GFP with presynaptic neurexin-1β that contains a split-GFP fragment and was expressed in primary neurons before coculture with the neuroligin-1-expressing COS-7 cells. Again, mutant neuroligin-1 that does not bind to neurexin-1β but still contains a split-GFP moiety was unable to either mediate synapse formation, as described previously (Ko et al., 2009), or to reconstitute GFP fluorescence (Fig. 4). The artificial synapse formation assay thus unequivocally demonstrated that neurexin-1β trans-synaptically interacts with neuroligin-1.
The artificial synapse-formation assay allowed us to measure the time course of the formation of a fluorescent GFP from the split-GFP components in direct comparison with synapse formation. This experiment demonstrated that the reformation of GFP from the split-GFP-components lagged far behind synapse formation, probably because it involves a major folding reaction. Therefore, GFP fluorescence in this system cannot be used to follow synapse formation in real time. This suggests that, in general, reconstitution of fluorescent GFP from split-GFP fragments is too slow to allow analyses of biological reaction kinetics, limiting the usefulness of this approach.
Although not suitable for studying the dynamics of synapse formation, SynView1 could mark synaptic connections with relatively high precision (Fig. 6). Interestingly, SynView1 exhibited a significant preference for excitatory versus inhibitory synapses (Fig. 7), supporting previous evidence for a predominant function of neuroligin-1 in excitatory synapses (Chubykin et al., 2007). Finally, we produced a SynView2 system in which the split-GFP component GFP11 is inserted into neuroligin-2 instead of neuroligin-1. Like SynView1, SynView2 marked synapses and had a preference for inhibitory synapses (Figs. 8,9). Despite this preference, however, approximately half of SynView2 puncta colocalized with the excitatory synaptic marker vGLUT-1, showing that this approach cannot mark inhibitory versus excitatory synapses with increased specificity. Further development and validation of this method by incorporating a neurexin-binding mutant similar to SynView1 will be necessary to evaluate its usefulness.
The most important advance we report in the present study is probably the direct visualization of the neurexin-1β/neuroligin-1 interaction at a synapse by means of an advanced split GFP design approach and the evidence of the synaptic localization of the complex. We show that, although the formation of fluorescent GFP from the split-GFP components in neurexin-1β and neuroligin-1 is slow, it is completely dependent on the binding of neurexin-1β and neuroligin-1 to each other. Therefore, surprisingly, the binding of the split-GFP components in our system is not sufficient to mediate trans-cellular adhesion or to visualize synapses. This result is in stark contrast to the results obtained with other systems using the GRASP approach, in which the split-GFP components are simply attached in the N′-termini (Feinberg et al., 2008; Yamagata and Sanes, 2012) or extracellularly to the transmembrane regions and cytoplasmic sequences of neuroligin-1 and neurexin-1β, with deletion of the extracellular interacting sequences from these molecules (Kim et al., 2012). It has been shown that, when expressed in invertebrates and vertebrates, the split-GFP in the GRASP system itself is sufficient to mediate a trans-cellular interaction and localizes to synapses. However, the GRASP system has not been demonstrated in a non-neuronal system to mediate intercellular adhesion and expression of the GRASP components separately in neurons has not been shown to lead to a synaptic localization. At present, we cannot resolve these puzzling discrepancies.
Footnotes
This study was supported by the National Institute of Mental Health–National Institutes of Health (Grant MH052804) and the National Institute of Neurological Disorders and Stroke–National Institutes of Health (Grant NS077906). T.T. was supported by long-term postdoctoral fellowship LT-000135/2009-L from the Human Frontiers in Science Program Organization (HFSPO).
The authors declare no competing financial interests.
References
- Araç D, Boucard AA, Ozkan E, Strop P, Newell E, Südhof TC, Brunger AT. Structures of neuroligin-1 and the neuroligin-1/neurexin-1 beta complex reveal specific protein-protein and protein-Ca2+ interactions. Neuron. 2007;56:992–1003. doi: 10.1016/j.neuron.2007.12.002. [DOI] [PubMed] [Google Scholar]
- Bang ML, Owczarek S. A matter of balance: role of neurexin and neuroligin at the synapse. Neurochem Res. 2013;38:1174–1189. doi: 10.1007/s11064-013-1029-9. [DOI] [PubMed] [Google Scholar]
- Boucard AA, Chubykin AA, Comoletti D, Taylor P, Südhof TC. A splice code for trans-synaptic cell adhesion mediated by binding of neuroligin 1 to alpha- and beta-neurexins. Neuron. 2005;48:229–236. doi: 10.1016/j.neuron.2005.08.026. [DOI] [PubMed] [Google Scholar]
- Boucard AA, Ko J, Südhof TC. High affinity neurexin binding to cell adhesion G-protein-coupled receptor CIRL1/latrophilin-1 produces an intercellular adhesion complex. J Biol Chem. 2012;287:9399–9413. doi: 10.1074/jbc.M111.318659. [DOI] [PMC free article] [PubMed] [Google Scholar]
- Cabantous S, Terwilliger TC, Waldo GS. Protein tagging and detection with engineered self-assembling fragments of green fluorescent protein. Nat Biotechnol. 2005;23:102–107. doi: 10.1038/nbt1044. [DOI] [PubMed] [Google Scholar]
- Chen X, Liu H, Shim AH, Focia PJ, He X. Structural basis for synaptic adhesion mediated by neuroligin-neurexin interactions. Nat Struct Mol Biol. 2008;15:50–56. doi: 10.1038/nsmb1350. [DOI] [PMC free article] [PubMed] [Google Scholar]
- Chubykin AA, Liu X, Comoletti D, Tsigelny I, Taylor P, Südhof TC. Dissection of synapse induction by neuroligins: effect of a neuroligin mutation associated with autism. J Biol Chem. 2005;280:22365–22374. doi: 10.1074/jbc.M410723200. [DOI] [PubMed] [Google Scholar]
- Chubykin AA, Atasoy D, Etherton MR, Brose N, Kavalali ET, Gibson JR, Südhof TC. Activity-dependent validation of excitatory versus inhibitory synapses by neuroligin-1 versus neuroligin-2. Neuron. 2007;54:919–931. doi: 10.1016/j.neuron.2007.05.029. [DOI] [PMC free article] [PubMed] [Google Scholar]
- Comoletti D, Flynn RE, Boucard AA, Demeler B, Schirf V, Shi J, Jennings LL, Newlin HR, Südhof TC, Taylor P. Gene selection, alternative splicing, and post-translational processing regulate neuroligin selectivity for beta-neurexins. Biochemistry. 2006;45:12816–12827. doi: 10.1021/bi0614131. [DOI] [PubMed] [Google Scholar]
- Dresbach T, Neeb A, Meyer G, Gundelfinger ED, Brose N. Synaptic targeting of neuroligin is independent of neurexin and SAP90/PSD95 binding. Mol Cell Neurosci. 2004;27:227–235. doi: 10.1016/j.mcn.2004.06.013. [DOI] [PubMed] [Google Scholar]
- Fabrichny IP, Leone P, Sulzenbacher G, Comoletti D, Miller MT, Taylor P, Bourne Y, Marchot P. Structural analysis of the synaptic protein neuroligin and its beta-neurexin complex: determinants for folding and cell adhesion. Neuron. 2007;56:979–991. doi: 10.1016/j.neuron.2007.11.013. [DOI] [PMC free article] [PubMed] [Google Scholar]
- Feinberg EH, Vanhoven MK, Bendesky A, Wang G, Fetter RD, Shen K, Bargmann CI. GFP Reconstitution Across Synaptic Partners (GRASP) defines cell contacts and synapses in living nervous systems. Neuron. 2008;57:353–363. doi: 10.1016/j.neuron.2007.11.030. [DOI] [PubMed] [Google Scholar]
- Gokce O, Südhof TC. Membrane-tethered monomeric neurexin LNS-domain triggers synapse formation. J Neurosci. 2013;33:14617–14628. doi: 10.1523/JNEUROSCI.1232-13.2013. [DOI] [PMC free article] [PubMed] [Google Scholar]
- Gordon MD, Scott K. Motor control in a Drosophila taste circuit. Neuron. 2009;61:373–384. doi: 10.1016/j.neuron.2008.12.033. [DOI] [PMC free article] [PubMed] [Google Scholar]
- Ichtchenko K, Hata Y, Nguyen T, Ullrich B, Missler M, Moomaw C, Südhof TC. Neuroligin 1: a splice site-specific ligand for beta-neurexins. Cell. 1995;81:435–443. doi: 10.1016/0092-8674(95)90396-8. [DOI] [PubMed] [Google Scholar]
- Ichtchenko K, Nguyen T, Südhof TC. Structures, alternative splicing, and neurexin binding of multiple neuroligins. J Biol Chem. 1996;271:2676–2682. doi: 10.1074/jbc.271.5.2676. [DOI] [PubMed] [Google Scholar]
- Jiang M, Chen G. High Ca2+-phosphate transfection efficiency in low-density neuronal cultures. Nat Protoc. 2006;1:695–700. doi: 10.1038/nprot.2006.86. [DOI] [PubMed] [Google Scholar]
- Kerppola TK. Bimolecular fluorescence complementation (BiFC) analysis as a probe of protein interactions in living cells. Annu Rev Biophys. 2008;37:465–487. doi: 10.1146/annurev.biophys.37.032807.125842. [DOI] [PMC free article] [PubMed] [Google Scholar]
- Kim J, Zhao T, Petralia RS, Yu Y, Peng H, Myers E, Magee JC. mGRASP enables mapping mammalian synaptic connectivity with light microscopy. Nat Methods. 2012;9:96–102. doi: 10.1038/nmeth.1784. [DOI] [PMC free article] [PubMed] [Google Scholar]
- Kim WJ, Jan LY, Jan YN. A PDF/NPF neuropeptide signaling circuitry of male Drosophila melanogaster controls rival-induced prolonged mating. Neuron. 2013;80:1190–1205. doi: 10.1016/j.neuron.2013.09.034. [DOI] [PMC free article] [PubMed] [Google Scholar]
- Knight D, Xie W, Boulianne GL. Neurexins and neuroligins: recent insights from invertebrates. Mol Neurobiol. 2011;44:426–440. doi: 10.1007/s12035-011-8213-1. [DOI] [PMC free article] [PubMed] [Google Scholar]
- Ko J, Zhang C, Araç D, Boucard AA, Brunger AT, Südhof TC. Neuroligin-1 performs neurexin-dependent and neurexin-independent functions in synapse validation. EMBO J. 2009;28:3244–3255. doi: 10.1038/emboj.2009.249. [DOI] [PMC free article] [PubMed] [Google Scholar]
- Krueger DD, Tuffy LP, Papadopoulos T, Brose N. The role of neurexins and neuroligins in the formation, maturation, and function of vertebrate synapses. Curr Opin Neurobiol. 2012;22:412–422. doi: 10.1016/j.conb.2012.02.012. [DOI] [PubMed] [Google Scholar]
- Lee K, Kim Y, Lee SJ, Qiang Y, Lee D, Lee HW, Kim H, Je HS, Sudhof TC, Ko J. MDGAs interact selectively with neuroligin-2 but not other neuroligins to regulate inhibitory synapse development. Proc Natl Acad Sci U S A. 2013;110:336–341. doi: 10.1073/pnas.1219987110. [DOI] [PMC free article] [PubMed] [Google Scholar]
- Maximov A, Pang ZP, Tervo DG, Südhof TC. Monitoring synaptic transmission in primary neuronal cultures using local extracellular stimulation. J Neurosci Methods. 2007;161:75–87. doi: 10.1016/j.jneumeth.2006.10.009. [DOI] [PubMed] [Google Scholar]
- Maximov A, Tang J, Yang X, Pang ZP, Südhof TC. Complexin controls the force transfer from SNARE complexes to membranes in fusion. Science. 2009;323:516–521. doi: 10.1126/science.1166505. [DOI] [PMC free article] [PubMed] [Google Scholar]
- McMahon SA, Díaz E. Mechanisms of excitatory synapse maturation by trans-synaptic organizing complexes. Current opinion in neurobiology. 2011;21:221–227. doi: 10.1016/j.conb.2010.12.005. [DOI] [PMC free article] [PubMed] [Google Scholar]
- Missler M, Sudhof TC, Biederer T. Synaptic cell adhesion. Cold Spring Harb Perspect Biol. 2012;4:a005694. doi: 10.1101/cshperspect.a005694. [DOI] [PMC free article] [PubMed] [Google Scholar]
- Poulopoulos A, Aramuni G, Meyer G, Soykan T, Hoon M, Papadopoulos T, Zhang M, Paarmann I, Fuchs C, Harvey K, Jedlicka P, Schwarzacher SW, Betz H, Harvey RJ, Brose N, Zhang W, Varoqueaux F. Neuroligin 2 drives postsynaptic assembly at perisomatic inhibitory synapses through gephyrin and collybistin. Neuron. 2009;63:628–642. doi: 10.1016/j.neuron.2009.08.023. [DOI] [PubMed] [Google Scholar]
- Scheiffele P, Fan J, Choih J, Fetter R, Serafini T. Neuroligin expressed in nonneuronal cells triggers presynaptic development in contacting axons. Cell. 2000;101:657–669. doi: 10.1016/S0092-8674(00)80877-6. [DOI] [PubMed] [Google Scholar]
- Shao Z, Watanabe S, Christensen R, Jorgensen EM, Colón-Ramos DA. Synapse location during growth depends on glia location. Cell. 2013;154:337–350. doi: 10.1016/j.cell.2013.06.028. [DOI] [PMC free article] [PubMed] [Google Scholar]
- Südhof TC. Neuroligins and neurexins link synaptic function to cognitive disease. Nature. 2008;455:903–911. doi: 10.1038/nature07456. [DOI] [PMC free article] [PubMed] [Google Scholar]
- Ushkaryov YA, Hata Y, Ichtchenko K, Moomaw C, Afendis S, Slaughter CA, Südhof TC. Conserved domain structure of beta-neurexins. Unusual cleaved signal sequences in receptor-like neuronal cell-surface proteins. J Biol Chem. 1994;269:11987–11992. [PubMed] [Google Scholar]
- Varoqueaux F, Aramuni G, Rawson RL, Mohrmann R, Missler M, Gottmann K, Zhang W, Südhof TC, Brose N. Neuroligins determine synapse maturation and function. Neuron. 2006;51:741–754. doi: 10.1016/j.neuron.2006.09.003. [DOI] [PubMed] [Google Scholar]
- Yamagata M, Sanes JR. Transgenic strategy for identifying synaptic connections in mice by fluorescence complementation (GRASP) Front Mol Neurosci. 2012;5:18. doi: 10.3389/fnmol.2012.00018. [DOI] [PMC free article] [PubMed] [Google Scholar]
- Zhang S, Ma C, Chalfie M. Combinatorial marking of cells and organelles with reconstituted fluorescent proteins. Cell. 2004;119:137–144. doi: 10.1016/j.cell.2004.09.012. [DOI] [PubMed] [Google Scholar]