Abstract
Previous studies have demonstrated that factors such as airway wall motion, inhalation waveform, and geometric complexity influence the deposition of aerosols in the alveolar airways. However, deposition fraction correlations are not available that account for these factors in determining alveolar deposition. The objective of this study was to generate a new space-filling model of the pulmonary acinus region and implement this model to develop correlations of aerosol deposition that can be used to predict the alveolar dose of inhaled pharmaceutical products. A series of acinar models was constructed containing different numbers of alveolar duct generations based on space-filling 14-hedron elements. Selected ventilation waveforms were quick-and-deep and slow-and-deep inhalation consistent with the use of most pharmaceutical aerosol inhalers. Computational fluid dynamics simulations were used to predict aerosol transport and deposition in the series of acinar models across various orientations with gravity where ventilation was driven by wall motion. Primary findings indicated that increasing the number of alveolar duct generations beyond 3 had a negligible impact on total acinar deposition, and total acinar deposition was not affected by gravity orientation angle. A characteristic model containing three alveolar duct generations (D3) was then used to develop correlations of aerosol deposition in the alveolar airways as a function of particle size and particle residence time in the geometry. An alveolar deposition parameter was determined in which deposition correlated with d2t over the first half of inhalation followed by correlation with dt2, where d is the aerodynamic diameter of the particles and t is the potential particle residence time in the alveolar model. Optimal breath-hold times to allow 95% deposition of inhaled 1, 2, and 3 μm particles once inside the alveolar region were approximately >10, 2.7, and 1.2 s, respectively. Coupling of the deposition correlations with previous stochastic individual path (SIP) model predictions of tracheobronchial deposition was demonstrated to predict alveolar dose of commercial pharmaceutical products. In conclusion, this study completes an initiative to determine the fate of inhaled pharmaceutical aerosols throughout the respiratory airways using CFD simulations.
Keywords: aerosol deposition, acinar model, respiratory drug delivery, metered dose inhalers, dry powder inhalers, nebulizers, alveolar dose
1. Introduction
The alveolar surface of the lungs represents a very large and thin barrier separating inhaled gases and particles from the blood (Weibel et al., 2005). Knowledge of aerosol deposition in the alveolar region is important for the toxicological assessment of inhaled pollutants (ICRP, 1994). Similarly, the alveolar region is the target for the deposition and absorption of systemically acting inhaled medications (Patton & Byron, 2007). Examples of inhaled medications intended for alveolar delivery and systemic absorption include proteins and peptides (e.g., inhaled insulin), some antibiotics (e.g., anti-tuberculosis drugs), and inhaled pain medications (e.g., rapid acting migraine medications). In contrast, the alveolar deposition of medications intended for the tracheobronchial region can represent a source of unwanted systemic exposure and increased side effects. As a result, it is critical to predict the deposition of inhaled aerosol in the alveolar region in an accurate manner for the assessment of both inhaled pollutants and inhaled pharmaceutical products.
Due to the extremely small size of individual alveoli (characteristic dimension ~180 μm), both computational fluid dynamics (CFD) analysis and scaled-up in vitro models provide effective tools for analyzing the fluid flow and associated aerosol transport. It is not possible to construct complete models of the alveolar airspace or even a single acinar unit considering the small size of the alveoli and total number of alveoli in the lungs [~ 480 million (Ochs et al., 2004)]. An understanding of general transport within the alveolar region has been gained from the analysis of individual alveolus models consisting of a single hemispherical shell or single alveolus attached to a tube (Balashazy et al., 2008; Haber et al., 2000; Haber et al., 2003; Lee & Lee, 2003; Sznitman et al., 2007a; Sznitman et al., 2009). From these individual alveolus approaches, geometric complexity has increased to include channels with multiple attached hemispheres (Tsuda et al., 1992), 3D tubular models (Darquenne & Paiva, 1996; Karl et al., 2004), bifurcating models with rectangular alveoli compartments (Harrington et al., 2006; Ma et al., 2009), tubular bifurcating models with attached hemispheres (Ma & Darquenne, 2012), tubes or bifurcating networks using a honeycomb or polyhedral structure of attached alveoli (Fung, 1988; Kumar et al., 2009; Sznitman et al., 2009), and cast or image-based geometries (Berg et al., 2010; Sznitman et al., 2010). Typical findings from these studies are summarized as follows:
Gravity dominates the deposition of particles ≥ 3 μm whereas smaller particles (but above ~400 nm) are controlled by both gravity and convection (Haber et al., 2003).
Wall motion, which drives alveolar airflow, is an important component (Balashazy et al., 2008; Lee & Lee, 2003; Sznitman et al., 2007b).
Unsteady flow has a large effect on transport dynamics (Haber et al., 2000; Sznitman et al., 2007a; Tippe & Tsuda, 2000).
The presence of multiple alveoli in a model has an effect on the flow field and particle trajectories (Sznitman et al., 2009; Tsuda et al., 1992).
Bifurcations and complexity of the airway geometry strongly influence aerosol deposition (Berg & Robinson, 2011; Fung, 1988; Harrington et al., 2006; Karl et al., 2004; Ma & Darquenne, 2012).
These findings have provided an excellent understanding of alveolar transport and aerosol deposition. However, aerosol deposition correlations that take these features into account have previously not been developed. Clearly, the generation of a model to predict alveolar deposition needs to include these reported aspects of transport dynamics.
As reviewed by Longest & Holbrook (2012), regional lung deposition is often predicted using whole-lung one-dimensional (1D) models (Asgharian et al., 2001a; Koblinger & Hofmann, 1990; Martonen, 1982; Yeh & Schum, 1980). These models implement analytic approximations of the various particle transport mechanisms to predict deposition at the level of individual bifurcations throughout the airways (Isaacs et al., 2005). The correlations used for alveolar deposition are typically based on aerosol sedimentation in a fixed inclined tube during steady flow (Finlay, 2001; Heyder & Gebhart, 1977). However, this approach omits a number of factors that were determined to be important for accurately capturing alveolar transport and deposition, as described above. For example, Kojic & Tsuda (2004) showed the importance of considering oscillating flow in determining gravitational sedimentation in a simple pipe model. Kim (2009) and Choi & Kim (2007) demonstrated that airway wall motion was important to accurately match in vivo alveolar deposition data with 1D model predictions. Despite the limitations of current 1D models, these approaches show reasonable agreement with in vivo determined slow clearance (> 24 hours) from the lung (Hofmann & Koblinger, 1990, 1992). Still, the slow clearance of deposited aerosol mass as measured by gamma scintigraphy and used for alveolar model validation is not synonymous with alveolar deposition (Asgharian et al., 2001b). There is often a significant tracheobronchial fraction that clears slowly, possibly due to macrophage uptake, entrapment in the cilia, binding to epithelial cells, intersubject variability, and airway paths of different lengths (Asgharian et al., 2001b; ICRP, 1994). Furthermore, pulmonary predictions of deposition are typically of lowest accuracy in the range of 1–3 μm particle diameter, which is the expected range of pharmaceutical aerosols that reach the alveolar airways. Improved alveolar deposition correlations are needed that take into account recent findings related to alveolar transport and deposition. The benefits of these correlations can be determined through comparisons with the currently implemented inclined straight tube models.
In a series of studies, a CFD approach has recently been developed to simulate the delivery of pharmaceutical aerosols throughout the conducting airways (Longest et al., 2012a; Longest et al., 2012b; Tian et al., 2011). Using this approach, CFD simulations are used to capture spray and jet effects of the inhaler (Longest et al., 2008) and the inhalation profile (Byron et al., 2013) in characteristic geometries that extend through approximately the lobar bronchi, i.e., bifurcation B3 with the trachea and main bronchi representing B1. Stochastic individual path (SIP) models are then evaluated extending into each of the five lung lobes through the terminal bronchioles (typically bifurcation B15). By evaluating a sufficient number of SIPs, convergence of the regional deposition fractions emerge. Advantages of this approach include accurate prediction of complex physical effects associated with pharmaceutical aerosols, geometric realism of the model, consideration of bifurcation asymmetry and out-of-plane rotations, and the prediction of highly localized deposition patterns (Longest & Holbrook, 2012). The model also provides the aerosol penetration fraction exiting the terminal bronchioles (B15) and entering the alveolar region over time. However, the CFD model has previously not been extended to predict alveolar deposition. A CFD-based technique is needed that can predict alveolar deposition accounting for known physically relevant factors for inhalation waveforms consistent with pharmaceutical aerosol delivery.
The objective of this study is to generate a new space-filling model of the pulmonary acinus region and implement this model to develop correlations of aerosol deposition that can be used to predict the alveolar dose of inhaled pharmaceutical products. The acinar model is based on the space-filling polyhedral method proposed by Fung (1988) and implemented by Sznitman et al. (2009). Model development steps include (1) determining if a truncated model can be used to predict total acinar deposition, (2) determining the effect of gravity angle on deposition in the alveolar model, and (3) implementing the selected model for development of effective correlations describing aerosol deposition throughout the alveolar region. Improved predictive power of the new correlation is sought in the critical particle diameter range of 500 nm – 3 μm. The connection of the developed models with the previously developed SIP method is then demonstrated to create a complete CFD-based approach for predicting pharmaceutical aerosol deposition throughout the airways (oral or nasal inhalation through the alveolar sacs).
2. Methods
2.1. Alveolar model development
The study of Weibel et al. (2005) describes an acinar unit as the alveolated pulmonary region following from each terminal bronchiole. The acinus consists of approximately three generations (G1–G3) of respiratory bronchioles, followed by on average 4 alveolar ducts (G4–G7) and ending with an alveolar sac (G8). Not all pathways end at G8 with alveolar sacs occurring between approximately G6 and G12 (Weibel et al., 2005). Therefore, the number of branches per generation number n does not match the true bifurcating scaling factor 2n. The study of Haefeli-Bleuer & Weibel (1988) used a casting technique to measure alveolar dimensions, which is known to inflate the acinar volume to approximately total lung capacity (Yeh & Schum, 1980). Assuming that the alveolar cast was at total lung capacity (~ 6L) and the normal lung volume of an adult at the end of exhalation is 3 L, the approximate scaled inner and outer diameters of the alveolar ducts are 200 and 560 μm, respectively.
To match the alveolar lung structure, Fung (1988) selected space filling polyhedral elements. Of the available options, Fung (1988) reasoned that the 14-hedron (or tetrakaidecahedron) was the correct physical structure due to its faces being composed of rectangles, hexagons, and pentagons, which match physiological observations of alveolar surfaces. The cross section of an alveolar ducts is composed of 6 14-hedron connected symmetrically with the inner faces removed to create an open luminal airspace surrounded by alveoli. These cross-sectional elements are then assembled linearly in sets of 3 to form a duct. To create a respiratory bronchiole, single 14-hedron elements are connected linearly with additional units added to the surface to form the limited attached alveoli. An alveolar sac consists of an alveolar duct with a closed end and terminates each airflow pathway. Ducts bifurcate on hexagonal faces of the 14-hedron elements resulting in a constant bifurcating angle of 75.5°.
The 14-hedron elements are constructed by cutting the 6 corners off a regular octahedron. The characteristic dimension of the structure is Δ, which is defined as the distance between two hexagon faces. In this study, the end expiratory volume of an alveolus was selected as 0.0042 mm3 based on the study of Ochs et al. (2004), which did not employ an inflation and casting technique. This value provided inner and outer alveolar duct diameters of ~ 174 μm and 540 μm, respectively, which is in good agreement with the scaled values of the Haefeli-Bleuer & Weibel (1988) data. Considering lengths, respiratory bronchioles, alveolar ducts, and alveolar sacs consisted to 4, 3, and 2 linear 14-hedron units. The corresponding constant lengths were 0.72, 0.54, and 0.36 mm, respectively, which are also consistent with the measurements provided by Haefeli-Bleuer & Weibel (1988). All 14-hedron units were of equal size, which gives the alveolar airway units consistent dimensions. This is reasonable considering the relatively constant alveolar region measurements reported Haefeli-Bleuer & Weibel (1988).
Clearly, all approximately 15,000 (Haefeli-Bleuer & Weibel, 1988; Ochs et al., 2004) alveoli in an acinar unit cannot be simulated in a reasonable CFD model. The focus of this study is to develop a geometry that can capture total acinar deposition. The approach taken was to develop a series of simplified models and evaluate the effect of additional ducts on deposition efficiency. All models began with one respiratory bronchiole and terminate with an alveolar sac at the end of each airflow pathway. The different models then contained 2, 3, or 4 generations of alveolar ducts and were termed D2, D3, and D4, respectively (Fig. 1). Table 1 provides the geometric specifications of each model including the airway length, which is the summation of the lengths down a single pathway. Comparing total deposition in the models will allow for evaluating the effects of including additional ducts. If the inclusion of addition ducts has a negligible effect on total deposition fraction, then a truncated model can be used to predict total acinar delivery.
Figure 1.
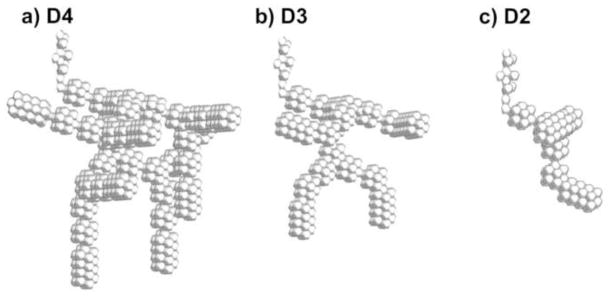
Approximate models of the acinar airway containing different numbers of alveolar duct generations: (a) model with 4 duct generations (D4), (b) model with 3 duct generations (D3), and (c) model with 2 duct generations (D2). All models begin with a respiratory bronchiole, which is divided using a symmetry plane to reduce the size of the geometry, and all pathways end with alveolar sacs.
Table 1.
Parameters describing the acinar models with different numbers of alveolar duct generations.
| Model | Number of Alveolar Duct Generations | Number of Alveoli | Length (mm) | Volume (mm3) | Bifurcation Angle |
|---|---|---|---|---|---|
| D4 | 4 | 1378 | 6.48 | 3.09 | 75.5° |
| D3 | 3 | 668 | 5.40 | 1.50 | 75.5° |
| D2 | 2 | 312 | 4.30 | 7.00 | 75.5° |
As described by Fung (1988), alveolar branches have a random orientation in the airways. Considering branches filling a spherical volume, the average branch orientation is calculated to be 38.4° with respect to the horizontal plane where the gravity vector acts in the vertical direction (Finlay, 2001). In the acinar model, total deposition will be affected by the orientation of the inlet branch. Thereafter, it is expected that inclusion of enough branching generations will make the model independent of acinar gravity angle in terms of predicted total deposition. As a result, the inlet branch angle was set to 38.4° with respect to the horizontal plane (51.6° with respect to the gravity vector). Beyond the inlet respiratory bronchiole, the geometry was pivoted in increments of 60° to evaluate the effects of gravity angle on total deposition fraction. In this manner, the respiratory bronchiole was held at a constant angle with respect to gravity while the remainder of the geometry was rotated.
To further simplify the model and make the calculations more efficient, a symmetry plane was added to the inlet respiratory bronchiole. The gravity vector was oriented such that it did not act in the direction of the symmetry plane. Considering that the model starts with the third respiratory bronchiole, the geometries can be viewed as approximations to a 1/8 acinar unit, which was a base repeating unit as viewed by Haefeli-Bleuer & Weibel (1988). Both the inclusion of the symmetry plane and use of reduced numbers of ducts represent simplifications of the 1/8 acinar anatomical geometry that enable effective calculation of this highly complex structure.
2.2. Inhalation breathing pattern and model actuation
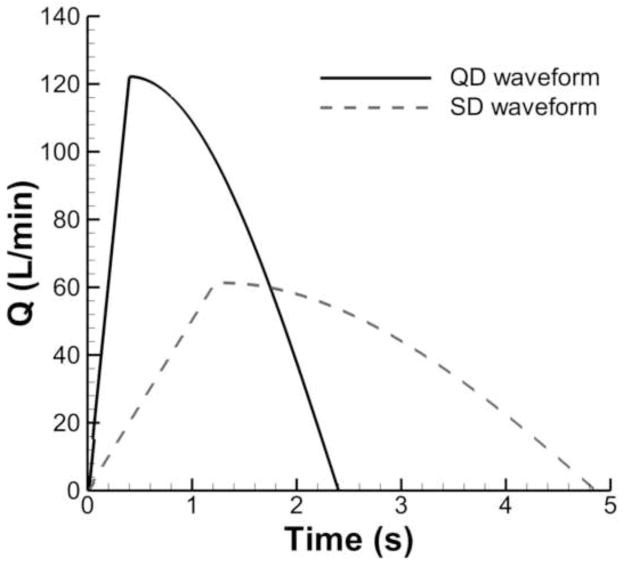
In this study, two realistic inhalation waveforms, i.e., “quick-and-deep (QD)” and “slow-and-deep (SD)” are considered for the evaluation of pharmaceutical aerosol transport and deposition. Parameters describing the transient QD and SD waveforms are listed in Table 2 and plotted in Fig. 2 based on the study of Longest et al. (2012b). As can be seen for both cases, the waveforms accelerate sharply until the peak inspiratory flow rate (PIFR) is reached and then decelerate according to a sinusoidal pattern (Tian et al., 2011). Equations describing these waveforms are:
| 1 |
| 2 |
| 3 |
Table 2.
Parameters describing transient QD and SD waveforms
| Parameters | Units | Description | QD profile | SD profile |
|---|---|---|---|---|
| PIFR | L/min | Peak inhalation flow rate | 122.2 | 61.4 |
| Q(t) | L/min | Transient inhalation flow rate | Eq. 2 | Eq. 2 |
| Q̄ | L/min | Mean inhalation flow rate | 75 | 37 |
| T | s | Period of inhalation | 2.4 | 4.86 |
| TPIFR | s | Time to peak inhalation flow rate | 0.4 | 1.22 |
| TFPIFR | - | Time fraction of peak inhalation flow rate | 1/6 | 1/4 |
| Vinhale | L | Total volume inhaled | 3 | 3 |
Figure 2.
Waveforms consistent with pharmaceutical inhalers described by quick-and-deep (QD) and slow-and-deep (SD) inhalations.
The total inhaled volume for QD and SD are the same, equal to 3 L, while mean flow rate for QD inhalation is approximately twice that of the SD waveform (Table 2). The resulting QD and SD inhalation periods (T) are 2.4 and 4.86 s, respectively. When using pharmaceutical inhalers, QD and SD inhalations are typically followed by a breath-hold which lasts up to 10 s. A breath-hold period at maximum lung inhalation was included in the simulations in this study and used to develop a variable time correlation for predicting aerosol deposition.
Expansion of the geometry was based on uniform scaling in all three coordinate directions with the length scaling factor proportional to the 1/3 power of airway volume change. At each time, the current lung volume was calculated as
| 4 |
where tcurrent is the current time, Q(t) is the inhalation flow rate from Fig. 2 and V is the initial lung volume at the end of expiration, assumed to be 3 L. The volume excursion for self-similar expansion over a series of time steps is then calculated as
| 5 |
where Vold represents the volume at the previous time step. The linear expansion for the current time step (βlocal) is calculated as
| 6 |
The total change or length scaling factor from the initial volume V is calculated as
| 7 |
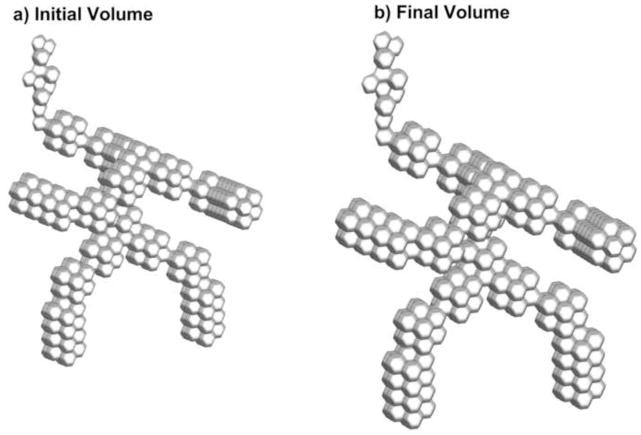
where the βtotal on the right hand side of the equation is the total expansion at the previous time step. For the QD waveform, total lung expansions at the PIFR and end of inspiration are 5.9% and 26%, respectively. Similarly, total expansions at PIFR and end of inspiration for SD inhalation are 6.5 and 26%, respectively. Based on the same inhaled volume, both models expand by the same amount; however, the QD waveform expands the model faster, which will magnify the effects of wall induced flows. Figure 3 displays the D3 model at the beginning (Fig. 3a) and end of inhalation (Fig. 3b), which illustrates that the volume is doubled through this process.
Figure 3.
D3 model: (a) at the beginning of inhalation and (b) at the end of inhalation when the airway volume is doubled.
2.3. Transport dynamics
Computational fluid dynamics (CFD) simulations were conducted to evaluate the flow field dynamics and particle transport. A transient flow field was generated by the moving wall boundaries. Flow field assumptions included constant properties, laminar flow, and isothermal conditions. The transient mass and momentum transport equations for laminar flow with moving wall boundaries were previously provided by Longest & Kleinstreuer (2004). During the transient flow field solution, Lagrangian particle tracking was used to evaluate aerosol transport and deposition for a particle size range of 0.5 – 10.0 μm. For this aerosol size range, forces included in the equation of particle motion were drag, based on the expression of Morsi and Alexander (1972), and gravity, including the buoyant force. The relevant particle transport equation was previously reported by Longest and Vinchurkar (2007). Particle deposition occurred when the particle center of mass touched the moving alveolar surface boundary. The particles were assumed spherical with unit density and did not change size due to evaporation and condensation. Due to relatively low flow rates during both QD and SD inhalation, the initial particle velocity had an insignificant contribution on deposition calculation and was therefore assumed to be zero.
Solution of the governing equations was accomplished using a combination of a commercial code (Fluent 14, ANSYS, Inc.) and user-defined functions (UDFs). The UDFs were employed to simulate airway wall motion and to calculate particle deposition fractions over time. In performing the CFD simulations, all discretizations were at least 2nd order accurate. Time step independence of the solution was established for a value of 0.05 s. Due to the complexity of the geometric model, a tetrahedral grid was employed. Tetrahedral grids can be effectively used with the moving/deforming mesh (MDM) implemented in Fluent 14 to enable the use of both a grid smoothing scheme as well as local remeshing scheme. It is noted that the smoothing scheme enables the displacement of nodes while the wall is moving and local remeshing enables adding new control volumes (CVs) or removing old CVs. The approximate total numbers of CVs for the D4, D3, and D2 models were 1.7, 1.0, and 0.4 million, respectively. Convergence of the flow field solution was assumed when the global mass residual had been reduced from its original value by five orders of magnitude and when the residual-reduction-rates for both mass and momentum were sufficiently small. To improve accuracy and to better resolve the circulation of flow and particle deposition in the alveolar region, all calculations were performed in double precision.
Two particle injection styles are used in this transient study, i.e., bolus injection and continuous injection. With bolus injection, 90,000 particles are released at a single time step and tracked through the space and time domains of a flow field solution. In contrast, continuous injection implements 900 particles injected at each time step during the inhalation period of a flow field solution. All injections occurred at the inlet to the respiratory bronchiole with a spatially uniform distribution. Doubling the number of particles considered had a negligible impact on both total and sectional deposition results. Particle aerodynamic diameters were distributed over 9 bin sizes in the range of 0.5 – 10 μm. In all cases, aerodynamic particle diameter is reported, which is equal to the geometric particle diameter for the unit density (1 g/cm3) spherical particles considered.
2.4. Calculation of deposition fractions
The deposition fraction (DF) for a single bolus injection at the start of inhalation can be calculated as
| 8 |
In the lungs, particles enter the alveolar region over the time course of the inhalation period. The deposition of these particles is affected by both the time in the alveolar region and the size of the expanding airways. What is desired is a deposition correlation that takes into account the particle diameter, residence time and changing geometric conditions. To capture these effects, particle release was considered at 10 injection times (tinject,i) for the QD and SD waveforms, where i denotes the injection time index. The potential residence time in the geometry between the point of injection and the end of inhalation is then calculated as
| 9 |
The deposition fraction for each injection time index i is then calculated as
| 10 |
Let f(ti) denote the normalized fraction of aerosol entering the alveolar region at each time index i. The aerosol DF during QD or SD inhalation is then
| 11 |
where n represents the total number of particle injections.
For the breath-hold period, no new particles enter the geometry. The DF during breath-hold for each particle size bin is then
| 12 |
where tBH is the time period of the BH phase.
The total DF combining QD or SD inhalation and the BH period is then
| 13 |
for each particle size. Finally, alveolar deposition is dependent on deposition in the upper airways. Previous studies define a fraction remaining (FR) entering the alveolar region based on the initially inhaled dose. The alveolar deposition fraction taking into account upper airway deposition then becomes
| 14 |
for each particle size considered.
As an alternative to conducting 10 separate flow field simulations with 10 individual bolus injections, continuous injection at each time step may be implemented into a single simulation. A transient deposition efficiency is then calculated as
| 15 |
The transient DEs can then be combined using the standard formula for converting a series of DEs to a DF as follows
| 16 |
where i=1 and i=n correspond with injection start time (t=0) and end time (t=T). The DE approach was using in this study for evaluating the effects of model simplification and gravity angle whereas the more exact approach of bolus injection at different times over multiple simulations was used for the calculation of final alveolar DF correlations.
2.5. Validation of predictions in an inclined tube
As a validation of the simulations, a comparison was performed between the CFD predictions and analytical results for particle deposition in a cylindrical tube at two different angles from the horizontal plane (θ=0° and 30°) and two different flow profiles (Poiseuille and plug flow). The cylinder diameter and length were D=0.5 mm and L=4 mm, respectively. Velocity was set to an approximate value in the alveolar region during normal ventilation with a value of 0.2 m/s producing a Reynolds number of 6.45 in the tube. This simplified validation is useful to show the prediction capability of the CFD simulation for the particle deposition due to sedimentation in different flow fields. The analytical solutions for the Poiseuille and plug flow particle deposition in the tube with an inclination angle of θ are based on the studies of Wang (1975) and Heyder (1975), as reported by Finlay (2001) Eqns. (7.6) and (7.16). The comparisons displayed in Figure 4 show good agreement between the CFD simulation and analytical results for both flow fields and inclination angles, e.g., the maximum relative percent difference at particle diameter of 10 μm is 2.7%.
Figure 4.
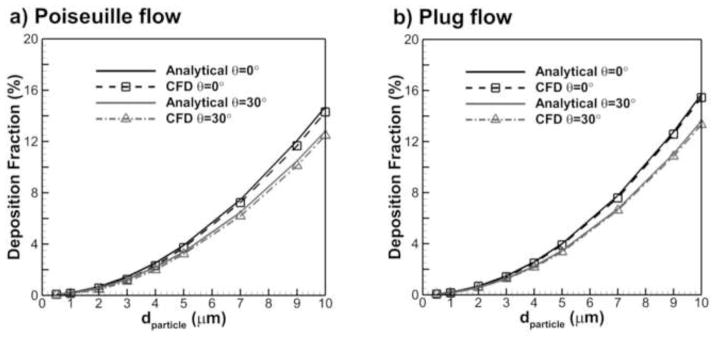
Comparison of CFD prediction and analytical correlation results for particle deposition fraction in a cylindrical tube at an angle θ from the horizontal with (a) Poiseuille flow and (b) plug (or uniform) flow.
3. Results
3.1. Comparison of existing correlations with acinar model predictions
To demonstrate the need for developing the moving wall acinar geometry, comparisons were made between analytical solutions for deposition in a one-dimensional (1-D) model and the CFD predictions with the D3 geometry. The term 1-D refers to the fact that this style of model only considers distance traveled in a tubular network, but neglects flows created by secondary motion and complex geometries. The 1-D model was designed to match the D3 geometry as closely as possible. Specifically, a multi-sectioned straight pipe geometry with total length (L = 5.4 mm) and diameter (D = 0.184 mm) equal to the D3 model was considered. The tubular inclination angle of each section and length were matched to the D3 branch angles and lengths. Average velocity in the model was set to capture the residence time of the inhalation period for SD and QD inhalation, respectively, and to include the effects of bifurcating flow. In the 1-D model, sedimentation and impaction were predicted using the expressions of Wang (1975) and Chan & Lippmann (1980), respectively, as reported in Finlay (2001) Eqns. 7.6 and 7.48. Total deposition in the 1-D approximation was based on the standard combined impaction and sedimentation DF formula.
Figure 5 shows the CFD predictions of deposition in the D3 model for both QD and SD inhalations compared with the 1-D analytical model. For the 1-D model, separate deposition fractions due to impaction and sedimentation are shown. As expected, the contribution of impaction on the total particle deposition in the 1-D model is negligible due to very slow flow in the lung distal regions. It can be seen that there is a significant difference in the prediction of particle deposition with both inhalations using a CFD alveolated model with moving walls in comparison with the 1-D solution. As a result, it appears that the use of the 1-D model cannot accurately predict deposition in an alveolated airway, which makes the evaluation of more complete alveolar models with moving walls necessary.
Figure 5.
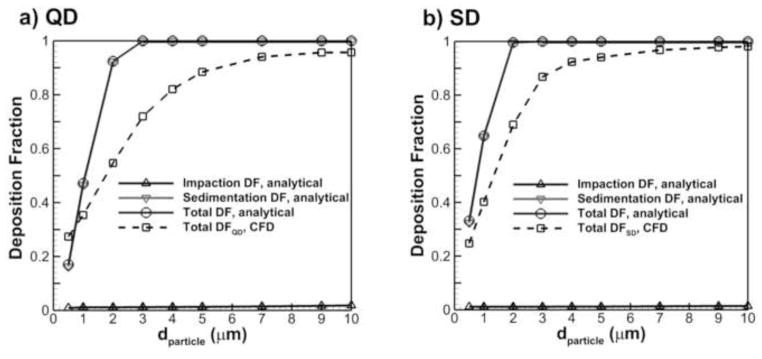
Comparison of CFD results for particle deposition in the acinar region using the D3 model with predictions for the 1-D analytical model.
3.2. Use of a truncated model
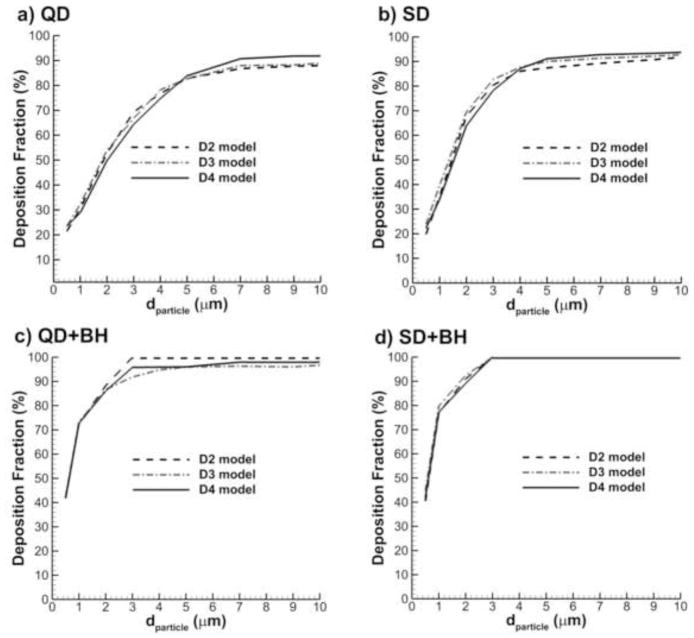
Figure 6 shows comparisons of deposition in the D2 through D4 models over a particle size distribution of 0.5–10 μm for the following conditions: 1) QD inhalation, 2) SD inhalation, 3) QD inhalation plus 10 second breath-hold, i.e., QD+BH, and 4) SD inhalation plus 10 second breath-hold, i.e., SD+BH. For this comparison, the gravity vector was parallel to the inlet respiratory bronchiole. In all cases, the general trends of deposition fraction profiles are very similar among the three geometries considered. It can be seen that moving from the D2 to the D3 model changes the deposition fraction by the largest amount; however, moving from the D3 to the D4 model does not add significant benefit. Therefore, the D3 model was selected as a representative geometry and is implemented in the remainder of the study.
Figure 6.
Effect of the number of alveolar ducts on total acinar deposition for the D2, D3, and D4 models with inhalations (a) QD and (b) SD as well as breath-hold periods following inhalation described by (c) QD+BH and (d) SD+BH.
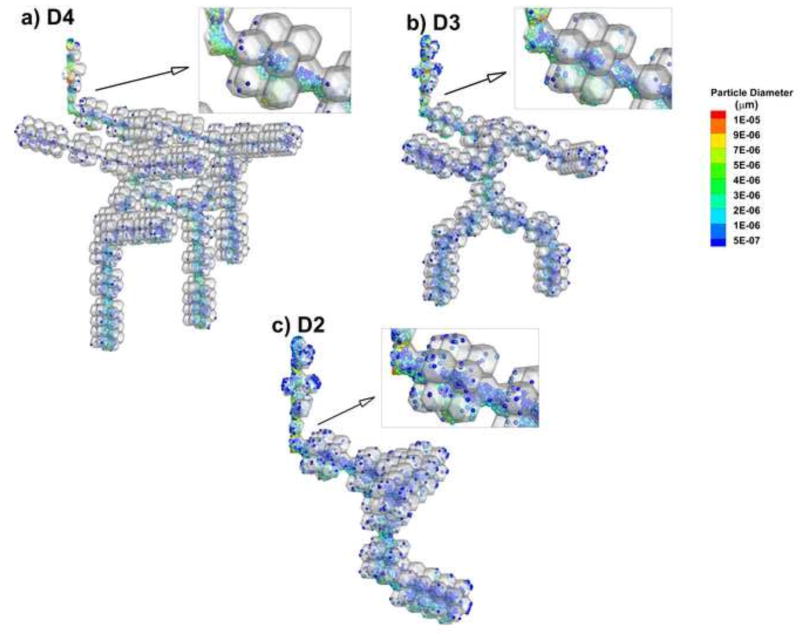
Another aspect of ensuring that a truncated model is appropriate is the consideration of particle transport and deposition patterns in the acinar airways. Figure 7 illustrates airborne particles at the end of QD inhalation in the D2 through D4 models. It is observed that particle transport patterns and regions of deposition are almost identical among the three geometries. One difference is that the particles in the D3 and D2 models appear more concentrated compared with D4, i.e., higher values of number concentration with very similar transport patterns. It is noted that the same number of particles was injected into all geometries. Therefore, it is reasonable to expect that the smaller geometries have higher local number concentrations. Based on this comparison, it appears that truncating the models does not change the aerosol transport and deposition pattern considering relative numbers of particles in the lumen vs. the alveoli and relative numbers of particles in the ducts vs. sacs. However, care should be exercised in calculating dose per unit surface area in the truncated geometries.
Figure 7.
Comparison of particle locations in the acinar models at the end of QD inhalation (t=2.4 s) with the (a) D4, (b) D3, and (c) D2 geometries.
3.3. Evaluation of gravity angles
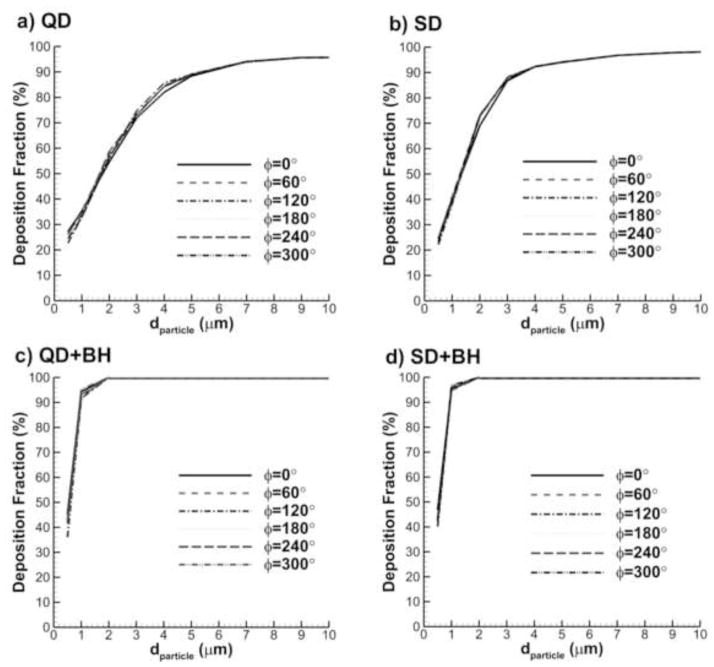
The effects of gravity angle on total deposition in the acinar airway models are displayed in Figure 8 for different inhalation conditions. In these simulations, the inlet respiratory bronchiole had an inclined angle of 38.4 degrees with respect to the horizontal, which is the expected average inclined angle across all branches in the acinar airways. The acinar model was then pivoted around the junction of the respiratory bronchiole and first alveolar duct in increments of 60 degrees. As observed in the figure, rotation angle of the total acinar geometry has a negligible impact on total deposition. This lack of sensitivity to gravity angle is because the D3 model contains enough complexity to capture sedimentation effects in multiple directions. Because gravity angle does not affect total acinar deposition, correlations of deposition can be developed that are independent of the gravity vector direction.
Figure 8.
Comparison of acinar deposition fractions DF (%) at six different gravity angles for (a) QD, (b) SD, (c) QD+BH, and (d) SD+BH conditions.
3.4. Aerosol deposition during inhalation
Deposition fractions as a function of residence time and aerodynamic particle diameter are displayed in Figure 9 for both QD and SD inhalation. As described in the Methods, particles were injected at 10 evenly divided time points during separate simulations in order to capture the effects of geometry expansion and residence time on DF. The times shown in Fig. 9 represent the potential aerosol residence time in the geometry (tres) and the curves provide the expected DF for particles at these tres values. As expected, aerosol diameter and residence time have a strong effect on deposition. However, it appears that the relative importance of diameter and residence time may shift at different time points in the inhalation period. Particles in the size range of 0.5–2 μm are observed to have incomplete deposition even with the full period of QD or SD inhalation.
Figure 9.
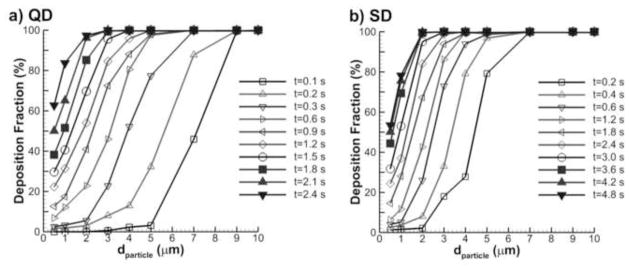
Total deposition fractions (%) in the D3 characteristic acinar model for (a) QD and (b) SD inhalations as a function of particle aerodynamic diameter and potential residence time.
Deposition fractions from Fig. 9 were collapsed to representative curves by selecting a physically relevant alveolar deposition parameter X = dαtβ, where d is the aerosol aerodynamic diameter and t is the potential residence time in the alveolar model. A best fit error minimization approach resulted in the following DF correlations, which are illustrated in Fig. 10. For QD inhalation
Figure 10.
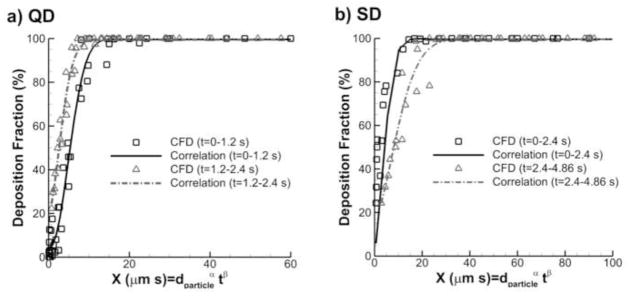
Correlations of total acinar deposition fraction (%) with the D3 characteristic model for (a) QD and (b) SD inhalations.
| 17 |
and for the SD inhalation
| 18 |
Overall, the fits to the deposition data are very good with R2 values above 0.9. Surprisingly, the deposition parameter shifts from X = td2 in the first half of the period to X = t2d in the second half. It is expected that this shift occurs because the geometry is expanding over time. Initially, the particle diameter is the main factor controlling deposition. However, once a sufficient level of geometric expansion has occurred the increasing geometric size becomes more important. More complex relationships could be developed that capture this shift on a gradual basis. However the simple exponents used in the current parameter appears to provide a high quality fit to the data.
3.5 Aerosol deposition during breath-hold
Depositions fraction during the breath-hold period are displayed in Fig. 11 for multiple particle residence times. Initial particle conditions were estimated by simulating continuous injection with QD and SD inhalation, respectively. As illustrated in Fig. 11, the subsequent deposition during BH at each time point showed very little difference between QD and SD initial conditions. Particles with d > 5 μm quickly deposited during the BH period while smaller particles stayed in the acinar airway even until the end of breath-hold (BH). As a result, breath-holds longer than 10 s are need for the smaller size particles d <2 μm to fully deposit inside the alveolar region. As the deposition fractions of breath-hold for both QD and SD inhalations are similar, one single correlation can be used with a R2 value of 0.9972 as
Figure 11.
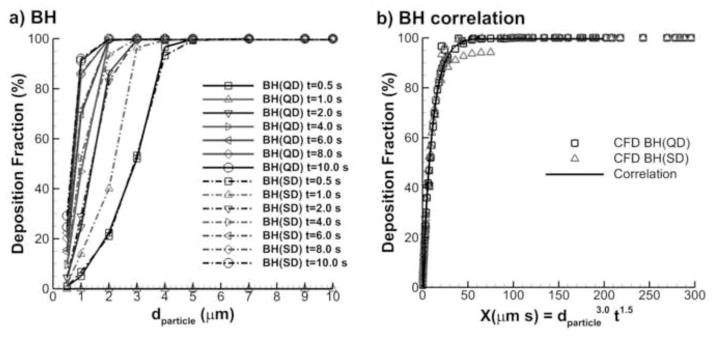
Deposition fractions at different breath-hold times following both QD and SD inhalation as a function of (a) particle aerodynamic diameter and (b) the alveolar deposition parameter.
| 19 |
The DF correlation for breath-hold is more influenced by diameter than residence time based on the exponent factors. This is expected due to the lack of wall motion during the breath-hold period. It is noted that the DFBH correlation captures deposition only during the breath-hold period and must be combined with DFQD/SD using Eqns. (17) and (18) to capture total deposition during the QD or SD and breath-hold period (Eqn. (13)).
4. Discussion
In this study, a moving wall model of a pulmonary acinus was developed based on the space filling approach developed by Fung (1988). The physiologically accurate model included a respiratory bronchiole, a variable number of alveolar duct generations, and multiple branch pathways that were ended with alveolar sacs. Particle deposition was evaluated for characteristic inhalation profiles used with pharmaceutical inhalers (Longest et al., 2012b). Primary findings were (i) that 1-D models and analytical correlations cannot capture deposition in the highly complex transient acinar structure with airflow driven by wall motion; (ii) a truncated acinar model can be implemented to capture total deposition; and (iii) gravity angle of the acinar unit does not significantly affect total deposition. Based on these findings, new correlations were developed that can be used to predict alveolar deposition as a function of breathing conditions used with pharmaceutical aerosols. The correlations complete an initiative to predict pharmaceutical aerosol deposition starting with an inhaler (Longest et al., 2008), continuing through the TB airways (Longest et al., 2012a; Longest et al., 2012b; Tian et al., 2011), and now including the alveolar region.
A number of simplified airway models have demonstrated that factors such as inclusion of alveoli (Haber et al., 2000; Tsuda et al., 1994; Tsuda et al., 2002), wall motion (Balashazy et al., 2008; Sznitman et al., 2009), and alveolar bifurcations (Balashazy & Hofmann, 1995; Hegedus et al., 2004; Ma & Darquenne, 2012) are important for capturing accurate transport patterns and deposition fractions in the alveolar region. Therefore, it is not surprising that the 1-D analytical predictions did not match the CFD predictions in the D3 geometry. However, 1-D models of lung deposition continue to implement analytical correlations for rigid tubes in predicting alveolar deposition. The result is a general inaccuracy in the range of 1–3 μm particles when compared with human in vivo slow clearance data. Correlations based on in vivo slow clearance data do not implement inhalation profiles consistent with the use of pharmaceutical inhalers (Heyder et al., 1986). For the first time the current study developed correlations for deposition that incorporate the range of factors known to influence aerosol deposition in the alveolar airways including geometric realism, transient flow, and airway wall motion. These correlations can be incorporated with current analytical 1-D models or CFD models of TB transport and deposition to better predict the alveolar deposition fraction of pharmaceutical aerosols.
A previous impediment to developing correlations for deposition in the alveolar region was the geometric complexity of the acinar unit. Based on data from Haefeli-Bleuer & Weibel (1988) and Ochs et al. (2004), there are on average 15,000 alveoli in a single acinus arranged in a complex space filling branching structure. Previous studies by Ma & Darquenne (2012) and Sznitman et al. (2009) have emphasized the importance of including geometric complexity in alveolar models. However, the effects of reducing the number of branches in an acinar unit have not previously been systematically considered. A primary finding of this study is that a simplified acinar model is representative of more complete geometries. Specifically, the number of alveolar duct generations used can be reduced to 3 without affecting total deposition. Haefeli-Bleuer & Weibel (1988) described how the acinar structure is self-seminar beginning with approximately the third respiratory bronchiole. Therefore, the simplified D3 model appears to provide a reasonable representation to total acinar deposition with a geometry that can be meshed and simulated with reasonable computational resources.
Another primary finding of the current study is that total acinar deposition is not dependent on the orientation with gravity. Previous studies have highlighted the effect of gravity angle on deposition in a single alveolus (Haber et al., 2003; Tsuda et al., 2002) and branching alveolar structure (Balashazy & Hofmann, 1995; Hegedus et al., 2004; Ma & Darquenne, 2012). However, it has not been previously demonstrated that total acinar deposition is independent of gravity angle. This independence was observed with the inclusion of a sufficient number of alveolar ducts. As a result, the D3 model was implemented to develop alveolar deposition correlations that were independent of gravity angle. These resulting correlations cannot be used to predict deposition in single branches, which would depend on gravity orientation. However, CFD simulations of the acinar models demonstrate the formation of hotspots and the accumulation of particles in the direction of the gravity vector. Therefore, the model can also be used to predict local accumulations of particle mass and hotspot formation within a representative acinar structure.
The developed alveolar correlation can be used to predict the complete lung deposition of pharmaceutical aerosols and to make quick estimates of alveolar deposition to determine required breath hold periods. Considering lung deposition estimates, Longest and Holbrook (2012) previously reviewed the advantages of CFD in simulating the transport and deposition of pharmaceutical aerosol in the extrathoracic and upper airways. In a series of studies, Longest and colleagues (Longest et al., 2012a; Longest et al., 2012b; Tian et al., 2011) have developed the SIP approach to provide CFD predictions of aerosol deposition throughout the TB airways to the terminal bronchioles. This approach provides a fraction of remaining (FR) aerosol exiting the terminal bronchioles and entering the alveolar region over time. The current correlations, combined with Eqns. (10–16) can be integrated with results from the SIP modeling approach to predict the complete lung deposition of pharmaceutical aerosols. Considering more direct estimates, it is often questioned how long of a breath-hold period is required for full retention of an inhaled aerosol. Patients with lung disease often struggle with the prescribed breath-hold period such that it should be as short as possible. Based on results from Eq. (19), 95% deposition occurs for particles with sizes of 1, 2, and 3 μm at breath-holds of >10, 2.7, and 1.2 s, respectively. The use of aerosols that change size in the airways can dramatically reduce or eliminate these breath-hold periods (Hindle & Longest, 2010).
As an example of calculating alveolar deposition with realistic inhalers, the study of (Longest et al., 2012a) was considered, which evaluated the Novolizer dry powder inhaler with QD inhalation and the Respimat soft mist inhaler with SD inhalation. The FRs of the inhaled aerosols entering the alveolar region with the Novolizer and Respimat were 0.32 and 0.52, respectively. The corresponding time distributions of the aerosols exiting B15 and entering the respiratory bronchioles are shown in Fig. 12a. Applying these time distributions to the span of particle aerodynamic diameters considered in the current study (0.5 – 10 μm), and including the FR estimates, the predicted alveolar deposition fractions are shown in 12b for QD and SD inhalation with a 10 s breath hold. The MMADs of the aerosols exiting the terminal bronchioles are also shown for both inhalers. In the previous study (Longest et al., 2012a) with Novolizer and Respimat inhalers, it was assumed that the particles entering the alveolar region were fully deposited. However, Fig. 12b shows that this assumption overestimates alveolar deposition with the Novolizer and Respimat inhalers by relative differences of approximately 5 and 10%, respectively.
Figure 12.
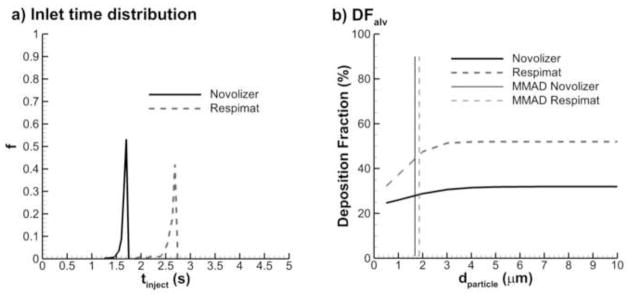
Sample calculation of alveolar dose for a Novolizer DPI and Respimat SMI in terms of (a) particle time distribution entering the alveolar region from SIP model simulations and (b) alveolar deposition fraction accounting for upper airway deposition and deposition probability in the alveolar region.
Limitations of the current study include CFD model validation for only the cylindrical duct, use of a single respiratory bronchiole, not including exhalation, and dependence of the solution on two inhalation waveforms. In Section. 2.5, the CFD model validation is limited to particle deposition fraction predictions in cylindrical tubes, for which there are analytical solutions that can be used for validation. Similar analytical solutions do not exist for the case of wall motion. As described, Haefeli-Bleuer & Weibel (1988) considered the third respiratory bronchiole to be the inlet of a repeating self-similar 1/8 acinar unit. However, the model did not take into account deposition in the first two respiratory bronchioles, which have limited alveolar structure. Deposition was considered through a 10 s breath-hold; however, not all particles were deposited in this time period. The fate of these particles will depend on exhalation. Finally, the results were dependent upon the flow waveforms considered. Figure 13 shows a comparison of deposition fraction during QD and SD inhalations at time points of (a) 0.6 s and (b) 1.2 s. The large differences in particle deposition curve shapes indicate that particle deposition in the acinar region is flow waveform depended. Therefore, further investigation is needed to develop correlations that include the effects of multiple flow waveforms.
Figure 13.
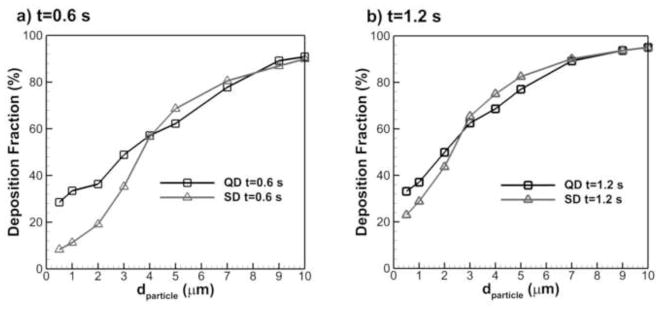
Comparison of particle deposition fraction with QD and SD inhalations at two time points: (a) t=0.6 s, and (b) t=1.2 s.
In conclusion, the correlations developed in this study can be used to predict the fate of pharmaceutical aerosols in the alveolar region that are inhaled with characteristic QD and SD waveforms with or without a breath-hold period. It was determined that increasing the number of alveolar ducts beyond 3 and gravity orientation had negligible impacts on total acinar deposition. As a result, a characteristic acinar airway model (D3) was developed and used for the development of deposition correlations. Furthermore, it was determined that particle transport and local deposition in this geometry appeared similar to both more simplified (D2) and more complex (D4) models. The characteristic model geometry can be used in future studies to investigate the effects of different inhalation profiles and compare with in vivo reported slow clearance estimates of alveolar deposition, which are available for passive breathing. It was demonstrated that results from previous tracheobronchial simulations could be extended to predict regional deposition throughout the lungs using the developed correlations. Finally, optimal breath-hold periods were established that can be used to reduce the prescribed breath-hold time thereby making pharmaceutical aerosols easier to administer. Future studies are needed to explore transport in the upper respiratory bronchioles, different inhalation waveforms, and the effects of exhalation on alveolar deposition.
Highlights.
A space filling acinar model with moving walls was developed
A geometry with three alveolar ducts was found to be acceptable
Gravity angle did not influence total aerosol deposition in the acinar geometry
Correlations are developed to predict the alveolar deposition of pharmaceutical aerosols
Correlations include slow/fast and deep inhalation and a variable breath hold
Acknowledgments
This study was supported by Award U01 FD004570 from the US FDA and Award R01 HL107333 from the National Heart, Lung, and Blood Institute.
Footnotes
The content is solely the responsibility of the authors and does not necessarily represent the official views of the US FDA, the National Heart, Lung, and Blood Institute or the National Institutes of Health.
Publisher's Disclaimer: This is a PDF file of an unedited manuscript that has been accepted for publication. As a service to our customers we are providing this early version of the manuscript. The manuscript will undergo copyediting, typesetting, and review of the resulting proof before it is published in its final citable form. Please note that during the production process errors may be discovered which could affect the content, and all legal disclaimers that apply to the journal pertain.
References
- Asgharian B, Hofmann W, Bergmann R. Particle deposition in a multiple-path model of the human lung. Aerosol Science and Technology. 2001a;34:332–339. [Google Scholar]
- Asgharian B, Hofmann W, Miller FJ. Mucociliary clearance of insoluble particles from the tracheobronchial airways of the human lung. J Aerosol Science. 2001b;32:817–832. [Google Scholar]
- Balashazy I, Hofmann W. Deposition of aerosols in asymmetric airway bifurcations. Journal of Aerosol Science. 1995;26:273–292. [Google Scholar]
- Balashazy I, Hofmann W, Farkas A, Madas BG. Three-dimensional model for aerosol transport and deposition in expanding and contracting alveoli. Inhalation Toxicology. 2008;20:611–621. doi: 10.1080/08958370801915291. [DOI] [PubMed] [Google Scholar]
- Berg E, Robinson RJ. Stereoscopic particle image velocimetry analysis of healthy and emphysemic alveolar sac models. Journal of Biomechanical Engineering. 2011;133:061004-061001-061008. doi: 10.1115/1.4004251. [DOI] [PubMed] [Google Scholar]
- Berg EJ, Weisman JL, Oldham MJ, Robinson RJ. Flow field analysis in a compliant acinus replica model using particle image velocimetry (PIV) Journal Of Biomechanics. 2010;43:1039–1047. doi: 10.1016/j.jbiomech.2009.12.019. [DOI] [PubMed] [Google Scholar]
- Byron PR, Wei X, Delvadia RR, Longest PW. Standardizing in vitro test methods to support aerosol drug evaluation in the clinic. Respiratory Drug Delivery Europe. 2013;2013:85–92. [Google Scholar]
- Chan TL, Lippmann M. Experimental measurements and emperical modeling of the regional deposition of inhaled particles in humans. American Industrial Hygiene Association Journal. 1980;41:399–409. doi: 10.1080/15298668091424942. [DOI] [PubMed] [Google Scholar]
- Choi J, Kim CS. Mathematical analysis of particle deposition in human lungs: an improved single path transport model. Inhalation Toxicology. 2007;19:925–939. doi: 10.1080/08958370701513014. [DOI] [PubMed] [Google Scholar]
- Darquenne C, Paiva M. Two- and three dimensional simulations of aerosol transport and deposition in alveolar zone of human lung. Journal of Applied Physiology. 1996;80:1401–1414. doi: 10.1152/jappl.1996.80.4.1401. [DOI] [PubMed] [Google Scholar]
- Finlay WH. The Mechanics of Inhaled Pharmaceutical Aerosols. Academic Press; San Diego: 2001. [Google Scholar]
- Fung YC. A model of the lung structure and its validation. J Appl Physiol. 1988;64:2132–2141. doi: 10.1152/jappl.1988.64.5.2132. [DOI] [PubMed] [Google Scholar]
- Haber S, Butler JP, Brenner H, Emanuel I, Tsuda A. Shear flow over a self-similar expanding pulmonary alveolus during rhythmical breathing. Journal of Fluid Mechanics. 2000;405:243–268. [Google Scholar]
- Haber S, Yitzhak D, Tsuda A. Gravitational deposition in a rhythmically expanding and contracting alveolus. Journal of Applied Physiology. 2003;95:657–671. doi: 10.1152/japplphysiol.00770.2002. [DOI] [PubMed] [Google Scholar]
- Haefeli-Bleuer B, Weibel ER. Morphometry of the human pulmonary acinus. The Anatomical Record. 1988;220:401–411. doi: 10.1002/ar.1092200410. [DOI] [PubMed] [Google Scholar]
- Harrington L, Prisk GK, Darqueene C. Importance of the bifurcation zone and branch orientation in simulated aerosol deposition in the alveolar zone of the human lung. Aerosol Science. 2006;37:37–62. [Google Scholar]
- Hegedus CJ, Balashazy I, Farkas A. Detailed mathematical descirption of the geomtry of airway bifurcations. Respiratory Physiology and Neurobiology. 2004;141:99–114. doi: 10.1016/j.resp.2004.03.004. [DOI] [PubMed] [Google Scholar]
- Heyder J. Gravitational deposition of aerosol particles within a system of randomly oriented tubes. Journal of Aerosol Science. 1975;6:133–137. [Google Scholar]
- Heyder J, Gebhart J. Gravitational deposition of particles from laminar aerosol flow through inclined circular tubes. Journal of Aerosol Science. 1977;8:289–295. [Google Scholar]
- Heyder J, Gebhart J, Rudolf G, Schiller CF, Stahlhofen W. Deposition of particles in the human respiratory tract in the size range of 0.005 – 15 microns. Journal of Aerosol Science. 1986;17:811–825. [Google Scholar]
- Hindle M, Longest PW. Evaluation of enhanced condensational growth (ECG) for controlled respiratory drug delivery in a mouth-throat and upper tracheobronchial model. Pharmaceutical Research. 2010;27:1800–1811. doi: 10.1007/s11095-010-0165-z. [DOI] [PMC free article] [PubMed] [Google Scholar]
- Hofmann W, Koblinger L. Monte-Carlo Modeling Of Aerosol Deposition In Human Lungs .2. Deposition Fractions And Their Sensitivity To Parameter Variations. Journal Of Aerosol Science. 1990;21:675–688. [Google Scholar]
- Hofmann W, Koblinger L. Monte-Carlo Modeling Of Aerosol Deposition In Human Lungs .3. Comparison With Experimental-Data. Journal Of Aerosol Science. 1992;23:51–63. [Google Scholar]
- ICRP. Human Respiratory Tract Model for Radiological Protection. Vol. 66. Elsevier Science Ltd; New York: 1994. [Google Scholar]
- Isaacs KK, Rosati JA, Martonen TB. Mechanisms of particle deposition. In: Ruzer LS, Harley NH, editors. Aerosols Handbook. CRC Press; City: 2005. pp. 75–99. [Google Scholar]
- Karl A, Henry FS, Tsuda A. Low Reynolds number viscous flow in an alveolated duct. Journal Of Biomechanical Engineering-Transactions Of The Asme. 2004;126:420–429. doi: 10.1115/1.1784476. [DOI] [PubMed] [Google Scholar]
- Kim CS. Deposition of aerosol particles in human lungs: in vivo measurement and modeling. Biomarkers. 2009;14(S1):54–58. doi: 10.1080/13547500902965286. [DOI] [PubMed] [Google Scholar]
- Koblinger L, Hofmann W. Monte Carlo modeling of aerosol deposition in human lungs. Part I: Simulation of particle transport in a stochastic lung structure. Journal of Aerosol Science. 1990;21:661–674. [Google Scholar]
- Kojic M, Tsuda A. A simple model for gravitational deposition of non-diffusing particles in oscillatory laminar pipe flow and its application to small airways. Journal of Aerosol Science. 2004;35:245–261. [Google Scholar]
- Kumar H, Tawhai MH, Hoffman EA, Lin CL. The effects of geometry on airflow in the acinar region of the human lung. Journal Of Biomechanics. 2009;42:1635–1642. doi: 10.1016/j.jbiomech.2009.04.046. [DOI] [PMC free article] [PubMed] [Google Scholar]
- Lee DY, Lee JW. Characteristics of particle transport in an expanding or contracting alveolated tube. Journal of Aerosol Science. 2003;34:1193–1215. [Google Scholar]
- Longest PW, Hindle M, Das Choudhuri S, Xi J. Comparison of ambient and spray aerosol deposition in a standard induction port and more realistic mouth-throat geometry. Journal of Aerosol Science. 2008;39:572–591. [Google Scholar]
- Longest PW, Holbrook LT. In silico models of aerosol delivery to the respiratory tract - Development and applications. Advanced Drug Delivery Reviews. 2012;64:296–311. doi: 10.1016/j.addr.2011.05.009. [DOI] [PMC free article] [PubMed] [Google Scholar]
- Longest PW, Kleinstreuer C. Interacting effects of uniform flow, plane shear, and near-wall proximity on the heat and mass transfer of respiratory aerosols. International Journal of Heat and Mass Transfer. 2004;47:4745–4759. [Google Scholar]
- Longest PW, Tian G, Delvadia R, Hindle M. Development of a stochastic individual path (SIP) model for predicting the deposition of pharmaceutical aerosols: Effects of turbulence, polydisperse aerosol size, and evaluation of multiple lung lobes. Aerosol Science and Technology. 2012a;46:1271–1285. [Google Scholar]
- Longest PW, Tian G, Walenga RL, Hindle M. Comparing MDI and DPI aerosol deposition using in vitro experiments and a new stochastic individual path (SIP) model of the conducting airways. Pharmaceutical Research. 2012b;29:1670–1688. doi: 10.1007/s11095-012-0691-y. [DOI] [PubMed] [Google Scholar]
- Longest PW, Vinchurkar S. Validating CFD predictions of respiratory aerosol deposition: effects of upstream transition and turbulence. Journal of Biomechanics. 2007;40:305–316. doi: 10.1016/j.jbiomech.2006.01.006. [DOI] [PubMed] [Google Scholar]
- Ma B, Darquenne C. Aerosol bolus dispersion in acinar airways-influence of gravity and airway asymmetry. J Appl Physiol. 2012;113:442–450. doi: 10.1152/japplphysiol.01549.2011. [DOI] [PMC free article] [PubMed] [Google Scholar]
- Ma B, Ruwet V, Corieri P, Theunissen R, Riethmuller M, Darqueene C. CFD simulation and experimental validation of fluid flow and particle transport in a model of alveolated airways. J Aerosol Science. 2009;40:403–414. doi: 10.1016/j.jaerosci.2009.01.002. [DOI] [PMC free article] [PubMed] [Google Scholar]
- Martonen TB. Analytical model of hygroscopic particle behavior in human airways. Bulletin of Mathematical Biology. 1982;44:425–442. doi: 10.1007/BF02462290. [DOI] [PubMed] [Google Scholar]
- Morsi SA, Alexander AJ. An investigation of particle trajectories in two-phase flow systems. Journal of Fluid Mechanics. 1972;55:193–208. [Google Scholar]
- Ochs M, Nyengaard LR, Lung A, Knudsen L, Voigt M, Wahlers T, Richter J, Gundersen HJG. The number of alveoli in the human lung. American Journal Of Respiratory And Critical Care Medicine. 2004;169:120–124. doi: 10.1164/rccm.200308-1107OC. [DOI] [PubMed] [Google Scholar]
- Patton JS, Byron PR. Inhaling medicines: delivering drugs to the body through the lungs. Nature Reviews Drug Discovery. 2007;6:67–74. doi: 10.1038/nrd2153. [DOI] [PubMed] [Google Scholar]
- Sznitman J, Heimsch F, Heimsch T, Rusch D, Rosgen T. Three-dimensional convective alveolar flow induced by rythmic breathing motion of the pulmonary acinus. ASME Journal of Biomechanical Engineering. 2007a;129:658–665. doi: 10.1115/1.2768109. [DOI] [PubMed] [Google Scholar]
- Sznitman J, Heimsch F, Heimsch T, Rusch D, Rösgen T. Three-Dimensional Convective Alveolar Flow Induced by Rhythmic Breathing Motion of the Pulmonary Acinus. Transactions of the ASME. 2007b;129:658–665. doi: 10.1115/1.2768109. [DOI] [PubMed] [Google Scholar]
- Sznitman J, Heimshch T, Wildhaber JH, Tsuda A, Rosgen T. Respiratory flow phenomena and gravitational deposition in a three-dimensional space-filling model of the pulmonary acinar tree. Journal of Biomechanical Engineering. 2009;131:031010-031011-031015. doi: 10.1115/1.3049481. [DOI] [PubMed] [Google Scholar]
- Sznitman J, Sutter R, Altorfer D, Stampanonim M, Rosgen T, Schittny JC. Visualization of respiratory flows from 3D reconstructed alveolar airsapces using X-ray tomographic microscopy. J Vis. 2010;13:337–345. [Google Scholar]
- Tian G, Longest PW, Su G, Walenga RL, Hindle M. Development of a stochastic individual path (SIP) model for predicting the tracheobronchial deposition of pharmaceutical aerosols: Effects of transient inhalation and sampling the airways. Journal of Aerosol Science. 2011;42:781–799. [Google Scholar]
- Tippe A, Tsuda A. Recirculating flow in an expanding alveolar model: Experimental evidence of flow-induced mixing of aerosols in the pulmonary acinus. Journal of Aerosol Science. 2000;31:979–986. [Google Scholar]
- Tsuda A, Butler JP, Fredberg JJ. Aerosol deposition in the pulmonary acinus. Journal of Aerosol Science. 1992;23:S461–S464. [Google Scholar]
- Tsuda A, Butler JP, Fredberg JJ. Effects of alveolated duct structure on aerosol kinetics. I. Diffusional deposition in the absence of gravity. Journal of Applied Physiology. 1994;76:2497–2509. doi: 10.1152/jappl.1994.76.6.2497. [DOI] [PubMed] [Google Scholar]
- Tsuda A, Rogers RA, Hydon PE, Butler JP. Chaotic mixing deep in the lung. Proceedings of the National Academy of Sciences of the United States of America. 2002;99:10173–10178. doi: 10.1073/pnas.102318299. [DOI] [PMC free article] [PubMed] [Google Scholar]
- Wang CS. Gravitational deposition of particles from laminar flows in inclined channels. Journal of Aerosol Science. 1975;6:191–204. [Google Scholar]
- Weibel ER, Sapoval B, Filoche M. Design of peripheral airways for efficient gas exhange. Respiratory Physiology and Neurobiology. 2005;148:3–21. doi: 10.1016/j.resp.2005.03.005. [DOI] [PubMed] [Google Scholar]
- Yeh HC, Schum GM. Models of human lung airways and their application to inhaled particle deposition. Bull Math Biology. 1980;42:461–480. doi: 10.1007/BF02460796. [DOI] [PubMed] [Google Scholar]


