

Abstract
Purpose
There is a critical need for improvements in the noninvasive diagnosis of lung cancer. We hypothesized that matrix-assisted laser desorption ionization mass spectrometry (MALDI MS) analysis of the most abundant peptides in the serum may distinguish lung cancer cases from matched controls.
Patients and Methods
We used MALDI MS to analyze unfractionated serum from a total of 288 cases and matched controls split into training (n = 182) and test sets (n = 106). We used a training–testing paradigm with application of the model profile defined in a training set to a blinded test cohort.
Results
Reproducibility and lack of analytical bias was confirmed in quality-control studies. A serum proteomic signature of seven features in the training set reached an overall accuracy of 78%, a sensitivity of 67.4%, and a specificity of 88.9%. In the blinded test set, this signature reached an overall accuracy of 72.6 %, a sensitivity of 58%, and a specificity of 85.7%. The serum signature was associated with the diagnosis of lung cancer independently of gender, smoking status, smoking pack-years, and C-reactive protein levels. From this signature, we identified three discriminatory features as members of a cluster of truncated forms of serum amyloid A.
Conclusions
We found a serum proteomic profile that discriminates lung cancer from matched controls. Proteomic analysis of unfractionated serum may have a role in the noninvasive diagnosis of lung cancer and will require methodological refinements and prospective validation to achieve clinical utility.
Keywords: Mass spectrometry, Biomarker, Blood, Diagnosis
Lung cancer is the third most common cancer in the United States, but it is the leading cause of cancer-related deaths in both sexes.1 The reference (“gold”) standard in diagnosing lung cancer is pathological evidence of malignant cells, which typically requires an invasive strategy such as bronchoscopy, transthoracic needle aspiration, or even surgery. New, noninvasive approaches are urgently needed to improve our diagnostic accuracy and to avoid futile thoracotomies and missed chances of taking patients to surgery early when needed. Although various serum biomarkers have been investigated in lung cancer diagnosis, none has proven useful in general clinical practice, primarily because of limited sensitivity and specificity. Among the most extensively investigated biomarkers, the literature is very heterogeneous, and most biomarkers lack validation in large, prospective studies. The sensitivity of carcinoembryonic antigen in the diagnosis of lung cancer ranges from 26% to 33% when the specificity is set at the 95% level.2-4 For squamous cell carcinoma antigen, the sensitivity ranges between 39% and 41% when specificity is set at 95%.2,3 The sensitivity of cytokeratin 19 fragment ranges between 36% and 81% with a specificity set at 95%.2-4 Finally, for neuron-specific enolase, the sensitivity ranges between 18% and 39% with a specificity set at 95%.2,4 Thus, their use for diagnosis has not had a significant impact on patient care.
With recent advances in mass spectrometry techniques, it is now possible to investigate protein expression profiles from biological specimens, in health and disease, over a wide range of molecular weights.5,6 We and others have recently demonstrated that proteomic profiling of lung tumors using matrix-assisted laser desorption ionization mass spectrometry (MALDI MS) or two-dimensional gel electrophoresis methods allows distinction between normal and cancer tissue, and may predict lymph node involvement or survival.7,8 Recent studies have reported serum protein expression profiles that distinguish cancer patients diagnosis and outcomes with a variety of malignancies from controls using MALDI-based approaches.9-14 Questions about analytical reproducibility and validation have led to some controversy about this and other “-omics” discovery approaches.15-20
The goal of this study was to identify a proteomic signature directly obtained from unfractionated serum to distinguish lung cancer cases from matched controls with an easy, rapid technology such as MALDI MS. Careful attention has been directed to those critical issues of reproducibility and variability (both analytical and biological) in a large number of samples from two institutions. A serum protein signature consisting of seven peptides is found to be associated with lung cancer, which was tested in a blinded test set of matched samples.
PATIENTS AND METHODS
Study Subjects
Sera from a total of 142 patients with lung cancer (cases) and 146 individuals with no evidence of cancer were included in this matched case–control study (Tables 1 and 2). Cases were included with pathologically proven lung cancer of common subtypes and at all stages. The cases did not have therapeutic intervention for lung cancer within the 3 months preceding the blood draw. One hundred twenty-four patients carrying a diagnosis of chronic obstructive pulmonary disease, 28 with asthma, 59 with coronary artery disease, 30 with diabetes mellitus, and 53 with hypercholesterolemia were included and were evenly distributed between cases and controls (see Supplemental Table 1). Sera were collected prospectively from Vanderbilt University Medical Center Clinics, the Nashville VA Medical Center clinics, and the University of Pittsburgh Cancer Institute Lung Cancer SPORE Lung CT Screening Study between Jan 2001 and Aug 2003 (see Supplemental Table 2).
TABLE 1.
Clinical Characteristics of the 288 Lung Cancer Cases and Matched Controls in the Training and Test Sets
| Training Set (182)
|
Matched Test Set (106)
|
|||
|---|---|---|---|---|
| Cases | Controls | Cases | Controls | |
| Individuals, no. | 92 | 90 | 50 | 56 |
| Sex, no. (%) | ||||
| Male | 61 (66) | 60 (67) | 30 (60) | 29 (52) |
| Female | 31 (34) | 30 (33) | 20 (40) | 27 (48) |
| Age (yr), mean ± SD | 63.7 (9.7) | 61.2 (7.1) | 63.6 (12.0) | 60.9 (9.2) |
| Smoking status, no. (%) | ||||
| Ex | 48 (52) | 48 (53) | 25 (50) | 25 (45) |
| Current | 41 (45) | 39 (43) | 20 (40) | 27 (48) |
| Never | 3 (3) | 3 (5) | 5 (10) | 4 (7) |
| Smoking (pack-years), mean ± SD | 58.6 (34.5) | 68.2 (40.1) | 49.1 (26.6) | 60.8 (23.6) |
PKY, pack-years (product of the number of packs of cigarettes smoked per day and the number of years of smoking).
TABLE 2.
Patient’s Clinical Characteristics in the Training and Test Lung Cancer Case Sets
| Training Cases (92), n (%) | Matched Test Cases (50), n (%) | |
|---|---|---|
| Stage NSCLC | ||
| I | 24 (26.1) | 14 (28) |
| II | 8 (8.7) | 4 (8) |
| III | 29 (31.5) | 12 (24) |
| IV | 22 (23.9) | 15 (30) |
| Stage SCLC | ||
| Limited | 4 (4.3) | 2 (4) |
| Extensive | 5 (5.4) | 3 (6) |
| Histology | ||
| Squamous | 34 (37) | 16 (32) |
| Adenocarinoma | 33 (35.9) | 21 (42) |
| Large | 5 (5.4) | 2 (4) |
| NSCLC | 9 (9.8) | 5 (10) |
| Small cell | 9 (9.8) | 5 (10) |
| Other | 2 (2.2) | 1 (2) |
| Nodal Status | ||
| N0 | 34 (37) | 18 (36) |
| N1 | 6 (6.5) | 5 (10) |
| N2 | 27 (29.3) | 14 (28) |
| N3 | 10 (10.9) | 6 (12) |
| Unknown | 15 (16.3) | 7 (14.0) |
NSCLC, non-small cell lung cancer; SCLC, small-cell lung cancer; n, number of individuals.
Study Design
The case–control study design is summarized in Figure 1. The cases and controls were matched to avoid confounding variables such as age, sex, and particularly smoking history to explain the difference between groups. The matched cases and controls were split into a training (n = 182) and a test set (n = 106). A model signature defined in a training set was tested in the test set of matched cases and controls. Cases were individually matched with controls according to sex, age, smoking status, and total pack-year history. Two thirds of the serum paired samples were assigned to a training set, and the remaining third of the samples were assigned to a validation test set. Training and test sets were matched according to the same criteria and balanced for histology, stage, and nodal status (Tables 1 and 2). Forty control samples from the University of Pittsburgh were distributed equally between training and test sets. The institutional review boards of Vanderbilt University and the University of Pittsburgh approved this study.
FIGURE 1.
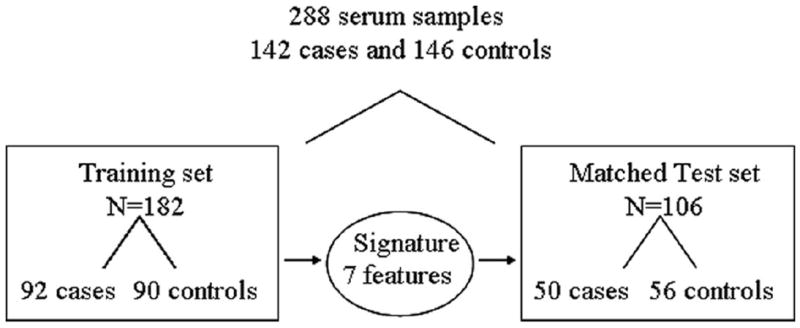
Flowchart describing the study design. A set of matched cases and controls (n = 288) was split into a training set (n = 182) and a test set (n = 106). A model signature defined in a training set was tested in a test set of matched cases and controls.
To determine whether our signature was associated with the diagnosis of lung cancer independently of an inflammatory response, the association between the signature and C-reactive protein (CRP) levels (high-sensitivity CRP, Alfa Wassermann, West Caldwell, NJ)21 in 223 of 288 serum samples was examined using the multivariable model of analysis described below.
Sample Preparation, MALDI MS Spectrum Acquisition, and Data Processing
Peripheral blood was collected without additive, incubated at room temperature for 60 minutes, and centrifuged. Serum was aliquoted and stored within 4 hours at −80° C until analysis. Thawed serum samples were diluted 1:10 in water. One microliter of matrix solution (sinapinic acid in acetonitrile/water 50:50 v/v containing 0.1% trifluoroacetic acid) was mixed with one microliter of diluted serum and directly spotted in duplicate onto a gold-coated stainless steel MALDI target plate (PE Biosystems, Foster City, CA). Spectra were acquired with a Voyager-Elite MALDI mass spectrometer (Applied Biosystems, Foster City, CA). Spectra were generated in the mass to charge (m/z) 3,000 to 20,000. Internal calibration was performed using the hemoglobin β = chain ([M+H]+ = 15868) and APO-C1 ([M+H]+ = 6631). The data preprocessing consisted of internal calibration, smoothing, baseline correction, normalization to the total ion current, feature selection with a signal-to-noise ratio, and binning of features (see Supplemental Data 1a). The processing resulted in 120 m/z peaks per spectrum on average. A total of 162 bins from m/z ratios of 3,000 to 20,000 were selected. In addition, 75 bins reached S/N ≥3, from which five peaks related to hemoglobin were removed from the analysis. The 70 remaining peaks were used for statistical analysis. Data acquisition and processing are summarized in Figure 2.
FIGURE 2.
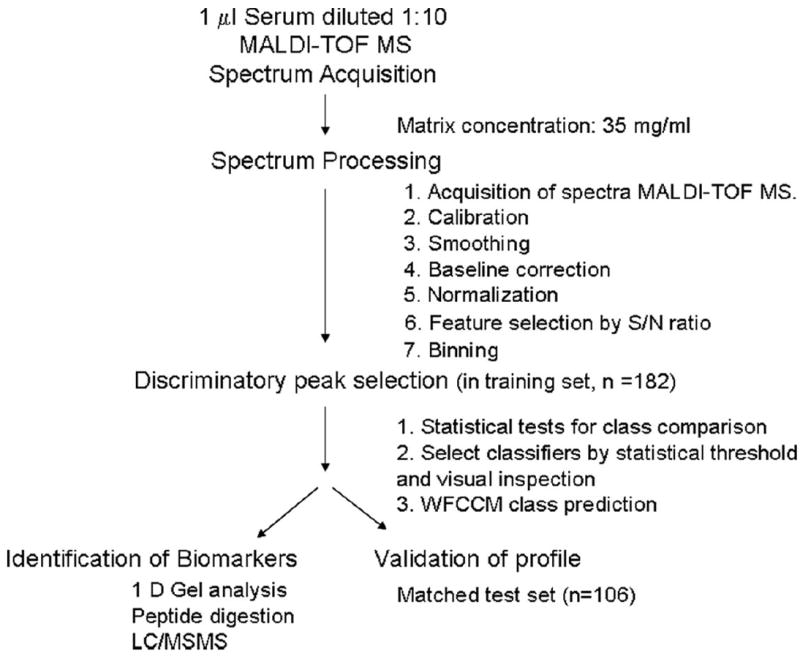
Workflow of serum profiling by MALDI MS acquisition and data processing. One-microliter samples were diluted 1:10 in water before printing to a MALDI plate. One microliter of 10 mg/ml 3,5-dimethoxy-4-hydroxy-cinnamic acid in 50:50 acetonitrile/0.1% trifluoroacetic acid was placed on the surface and allowed to dry. MALDI-MS spectra were acquired using a PerSeptive Voyage Elite time-of-flight mass spectrometer equipped with delayed extraction and a nitrogen laser (337 nm). All spectra were acquired in the linear mode with delayed extraction, using a laser intensity of 2300 (arbitrary units). Signal-to-noise (S/N) calculations included both chemical and electronic noise. Data were then processed for calibration, smoothing, baseline correction, normalization, feature selection by S/N ratio, binning, alignment, and normalization. Data were analyzed, and discriminatory signatures were obtained after statistical tests for class comparison. Discriminatory features were selected after statistical threshold and visual confirmation of the nature of the peak. Prediction of diagnostic accuracy was provided by the weighted flexible compound covariate method. Signature was validated in two independent sets of spectra. A subgroup of masses was identified by gel electrophoresis, followed by protein digestion and tandem MS–MS.
Multidimensional LC/MS/MS Analyses and Protein Identification
Proteins from case and control samples were separated by one-dimensional gel electrophoresis. Bands were excised in the molecular weight range of 11,000 to 12,000 Da, corresponding to a subset of m/z of discriminatory peaks. Bands were in-gel tryptic digested, and subjected to LC/MS/MS analysis on a Thermo LTQ linear ion trap instrument equipped with a thermonanoelectrospray source, Surveyor LC system, and autosampler (Thermo Fisher, San Jose, CA). Tandem MS spectra were matched to the human database sequences using SEQUEST (Thermo Fisher, San Jose, CA). SEQUEST results were filtered according to stringent charge and cross-correlation scores (XCorr) and RSp (ranking of primary score) value of <5 and Sp value (primary score) >350. SEQUEST-identified peptide sequences, protein accession numbers, and target MALDI MS m/z values were entered into FRAGMINT, a new software utility that generated candidate protein fragments consistent with the identified protein and peptide sequences and the observed MALDI MS m/z values.22
Statistical Analysis
The statistical analyses for the primary objective were focused on the following steps: (a) selection of MS features and differential expression levels between the study groups (for details, see Supplemental Data 2); (b) on the basis of the selected features, a class-prediction model7,23-26 was applied to determine whether the proteomic patterns could classify cases from controls. The misclassification rate was estimated using the leave-one-out cross-validation. (c) The prediction model generated from the training set was applied to the blinded test set. Receiver operating characteristic curves based on the weighted flexible compound covariate method models were also evaluated. Detailed statistical methods are provided in Supplemental Data 2. The accuracy rate was also estimated using the support vector machine (SVM) method with the polynomial kernel of degree 3.27 The SVM performs classification by constructing an n-dimensional hyperplane that optimally separates the data into two categories: cases versus controls. SVM models are closely related to neural networks and are widely used in high-dimensional data analysis. In addition, to assess the consistency of the analysis of the data, the entire raw dataset (288 spectra) was independently processed and analyzed by a collaborator (HR) at an outside institution. Finally, the multivariate logistic regression model was applied to study the association between serum profile and the diagnosis of lung cancer, adjusted for age, gender, pack-years of smoking, and CRP levels.
RESULTS
Reproducibility and Variability
The reproducibility and variability (both analytical and biological) were first tested in a total of 312 spectra from a total of 18 serum samples. We first analyzed the variance between all m/z peak intensities after calibration, smoothing, alignment, and normalization from the same sample. Quadruplicate MS spectra of the same spots were obtained, and each sample was analyzed four times on different spots. Reported are coefficients of variation (CV) for four spectra obtained from the same spot across four separate samples (same spot, CV = 1.43%), and variability of four separate samples (spot to spot, CV = 1.15%) (Table 3). The variability of spectra acquired from the same serum spotted on four different days (day to day) and before and after four cycles of freezing and thawing was examined, and overall CVs of 6.24% and 1.76% to 12.21%, respectively, were obtained. To quantify the reproducibility of MALDI MS spectra measurement, the intraclass correlation coefficient among 18 samples processed in quadruplicate was determined. The average intraclass variability was 32%, and the intersample variability was 68%. CVs for candidate biomarkers across training and test sets are shown in Table 3, with no significant differences found between the groups. In addition, we did not find significant difference in the CVs for each of the seven classifiers between controls from either institution. Hierarchical clustering analysis also demonstrated that the profiles did not cluster according to days of operation or institution of origin (data not shown).
TABLE 3.
Reproducibility and Variability of Matrix-Assisted Laser Desorption Ionization Mass Spectrometry Approach to Unfractionated Serum
| Analytical Variability | Average CV (%) for All Masses to Charge | No. of Spectra | Average CV (%) for Specific Masses to Charge | No. of Spectra Testing Set |
|---|---|---|---|---|
| Same spot | 1.43 | 64 | ||
| Spot to spot | 1.15 | 64 | ||
| Freeze-and-thaw cycles (overall) | 6.24 | 64 | ||
| 1 | 7.9 | 16 | ||
| 2 | 3.09 | 16 | ||
| 3 | 1.76 | 16 | ||
| 4 | 12.21 | 16 | ||
| Day to day (overall) | 3.53 | 256 | ||
| Day 1 | 5.46 | 16 | ||
| Day 2 | 2.38 | 16 | ||
| Day 3 | 4 | 16 | ||
| Day 4 | 2.27 | 16 | ||
| Masses to charge of classifiers | ||||
| 4155 | 5.28 | 182 | 5.37 | 106 |
| 7616 | 4.77 | 182 | 5.68 | 106 |
| 8765 | 5.27 | 182 | 5.04 | 106 |
| 11440 | 9.70 | 182 | 7.87 | 106 |
| 11526 | 11.43 | 182 | 9.60 | 106 |
| 11683 | 12.96 | 182 | 11.52 | 106 |
| 13762 | 5.42 | 182 | 4.44 | 106 |
Average CV assesses variance using all m/z peaks and corresponds to averages using coefficients of variation from quadruplicates. For m/z of classifiers, average CV assesses variance using a given peak and corresponds to averages over samples using coefficients of variation from the duplicates.
Serum Proteomic Profile Diagnostic Performance in Training and Test Sets
From the preprocessing, 75 of 162 peaks with signal-to-noise ratios ≥3 were selected. From the training set, 14 peaks were selected to reach the statistical criteria, using a p < 10−7 (and not according to the best fit of the model). Seven of the 14 features most likely corresponded to Na+ or K+ adducts or double-charged ions of other peptides already considered as discriminatory features; therefore, they were removed from the list of features. Our prediction analysis was thus based on a conservative selection of seven individual m/z values, listed and presented graphically in Supplemental Data 4.
On the basis of these seven discriminatory features, we correctly classified 62 of 92 cases and 80 of 90 controls in the training set, yielding a sensitivity of 67.4%, a specificity of 88.9%, and an overall classification accuracy of 78%. We applied this signature to the matched blinded test set, and we correctly classified 29 of 50 cases and 48 of 56 controls (sensitivity of 58% and specificity of 85.7%) (Table 4). Misclassified serum samples were found among all histological subgroups and pathological stages. Very similar results are reported from our SVM analysis (Table 4). In addition, totally independent analysis of our dataset reported similar prediction rates and selection of classifiers (Supplemental Data 3). Average intensities of MALDI MS serum spectra from cases and matched controls are presented in Figure 3 and Supplemental Data 1b.
TABLE 4.
Performance of Matrix-Assisted Laser Desorption Ionization Mass Spectrometry Serum Signature (Seven Features) to Distinguish Cases of Lung Cancer from Matched Controls After Two Methods of Analysis: the Weighted Flexible Compound Covariate Method (WFCCM) and Support Vector Machine (SVM)
| Training Set
|
Test Set
|
|||
|---|---|---|---|---|
| WFCCM | SVM | WFCCM | SVM | |
| Cases | 92 | 92 | 50 | 50 |
| Controls | 90 | 90 | 56 | 56 |
| Accuracy (95% CI) | 78.0 (72, 84) | 81.32 | 72.6 (64, 81) | 79.25 |
| Sensitivity (95% CI) | 67.4 (58, 77) | 70.00 | 58.0 (44, 72) | 64.00 |
| Specificity (95% CI) | 88.9 (82, 95) | 93.33 | 85.7 (77, 95) | 92.86 |
| Misclassified cases | 30 | 28 | 21 | 18 |
| Misclassified controls | 10 | 6 | 8 | 4 |
FIGURE 3.
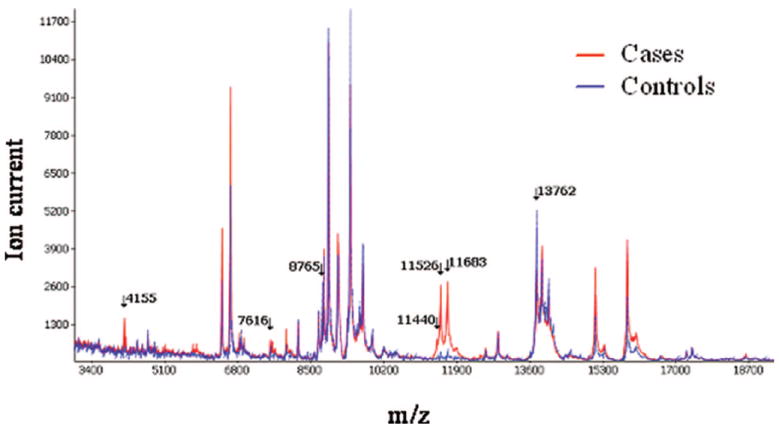
MALDI MS serum spectra from individuals with lung cancer and matched controls. Average intensity of spectrum analysis between matched cases (red plain line) and controls (blue dotted line) are presented. Arrows point to m/z values of discriminatory features.
Receiver operating characteristic analysis illustrates the efficacy of the serum proteomic profile in distinguishing between cases and controls in the two datasets (182 training sample set, 106 matched test set) and are shown in Figure 4A.
FIGURE 4.
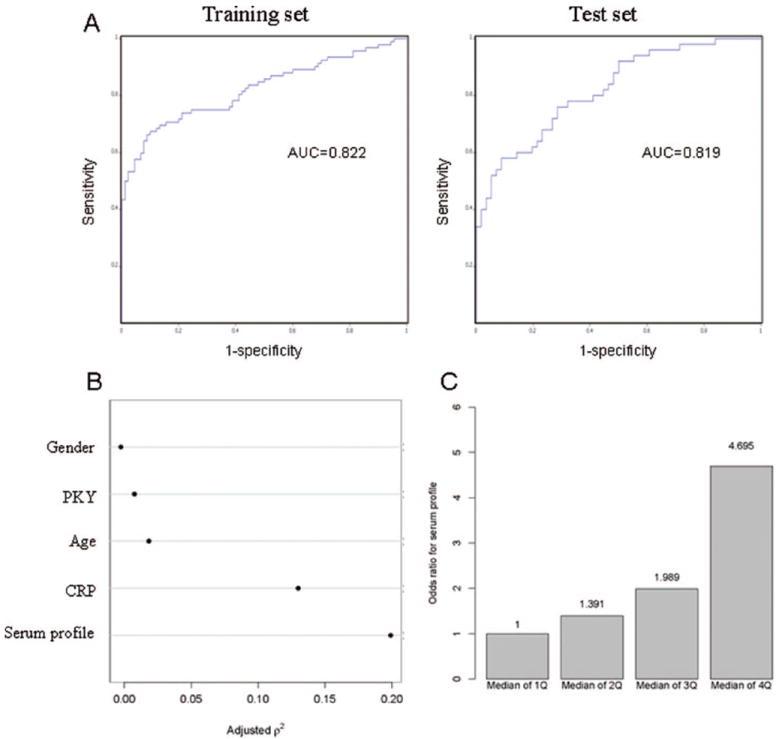
(A) Receiver operating characteristic curves addressing diagnostic efficacy of cases and controls in the two datasets (182 training sample set, 106 matched test set). (B) Nonmonotonic (quadratic in ranks) generalization of the Spearman rank–correlation coefficient, for each of these five predictors. The generalized Spearman coefficient helps to describe the strength of marginal relationships between each of these predictor variables and the response (being with lung cancer or not). This plot shows that the serum profile has the strongest correlation with the response among these five predictors. (C) Odds ratio of being diagnosed with lung cancer according to serum profile quantile distribution.
The clinical impact of a diagnostic signature for lung cancer would be greatest if it were able to identify cases of early-stage lung cancer. We therefore searched for a protein signature discriminating stage I lung cancer from matched controls. Despite the smaller sample size, we identified a set of six MS signals that detected stage I lung cancer with sensitivity and specificity of 70.8% and 84.4%, respectively, in a training set, and 57.1% and 71.4% in the test set (see Supplemental Table 3).
To assess the effect of serum proteomic profile on the diagnosis of lung cancer, the multivariable logistic regression model was applied on a total of 223 samples, including both cases and controls. The serum proteomic profile was associated with the diagnosis of lung cancer after adjustment for age, gender, pack-years of smoking, and CRP levels (p < 0.001). The serum proteomic profile has the strongest association with the diagnosis of lung cancer among all the covariates in the model (Figure 4B). The odds of being diagnosed of lung cancer increased with the strength of the serum proteomic profile; the odds ratio of being diagnosed with lung cancer are 4.7, when comparing serum proteomic profile in the fourth quantile with those in the first quantile (Figure 4C).
Protein Identification
Although not the primary goal of this report, three features were identified with the highest discriminatory value. Statistical rank, relative m/z peak intensity, and prevalence of the discriminatory peak were used to select the features of interest. We identified a cluster of peptides around 11,500 Da, which are part of the signature distinguishing cases from controls. After SDS-PAGE separation of serum proteins, the 11,500-Da region of the gel was excised, digested, and analyzed using microcapillary LC/MS/MS followed by data analysis. On the basis of the SEQUEST-identified peptides, FRAGMINT generated three candidate truncated fragments originating from serum amyloid A (SAA) at 11,440, 11,525, and 11,682 Da (Figure 5A and B), which were consistent with the molecular weights of the discriminatory m/z values. Both peptides GPGGAWAAEVISDAR and GPGGVWAAEISDAR were identified in the lung cancer serum signature, allowing for both SAA protein precursor and serum amyloid A1 isoform 2 to be considered as possible sources of these discriminatory peaks in the MALDI MS spectra. These results were further confirmed by Western analysis on 10 cases and control serum samples (Figure 5C) and by immunodepletion showing that the SAA peaks disappeared (Figure 5D).
FIGURE 5.
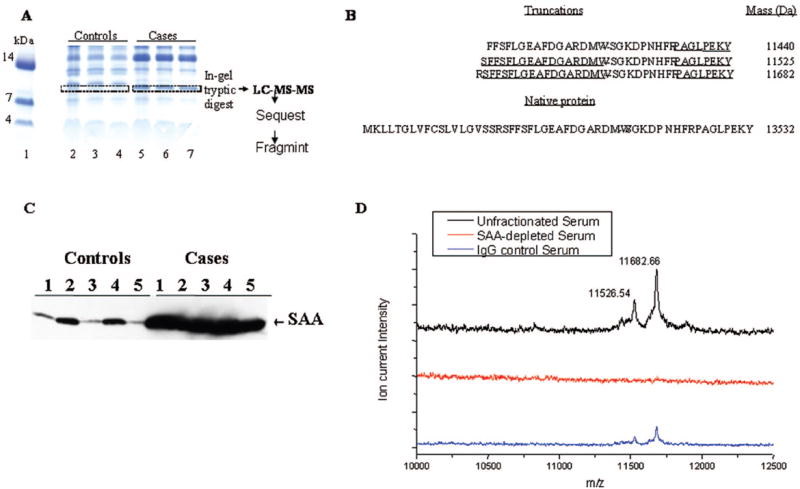
(A) One-dimensional SDS-PAGE analysis of proteins from control and lung cancer serum samples. Serum proteins were separated using SDS-PAGE on a 10% to 20% tricine gel and stained using colloidal blue. The gel illustrates a band in the molecular weight range of 11 to 12 kDa that appears frequently in lung cancer samples but is absent in the controls. This region was excised from control and cancer samples, trypsin digested, and subjected to LC-MS-MS analysis. Lane 1, molecular weight markers; lanes 2 through 4, control serum; lanes 5 through 7, lung cancer serum. (B) Proteins identified from these bands included several variants of serum amyloid A (SAA) that were unique to the lung cancer samples. FRAGMINT generated candidate protein fragments from serum amyloid A1 isoform 2, which contained the SEQUEST-identified peptides and were consistent with the observed MALDI MS m/z values. Peptides identified are underlined. The peptides contained in the sequence from positions 43 to 105 were also identified but are not shown. The intact sequence for serum amyloid A1 isoform 2, with an intact m/z value of 13532, is presented below the possible truncated forms. (C) SAA protein expression assessed by Western blot analysis in 10 serum samples, five from patients with lung cancer (cases) and five from controls. (D) Immunodepletion of SAA removes the peaks at m/z of 11526 and 11682 from serum samples of patients with cancer. Twenty microliters of packed rec-protein G–sepharose 4B conjugate (Zymed Lab Inc., CA) were incubated for 2 hours with 40 μg of mouse monoclonal antihuman SAA antibody (Antigenix America Inc., NY) or with immunoglobulins (mouse IgG, Santa Cruz, CA). Antibody–protein G–sepharose complex was washed with phosphate-buffered saline and incubated with 20 μl of serum overnight at +40°C. The supernatant collected after brief centrifugation was considered as SAA-depleted serum. One microliter each of the serum, the SAA-depleted serum, and the serum incubated with control immunoglobulins were diluted 1:10 and subjected to MALDI MS analysis.
DISCUSSION
We report a protein signature consisting of seven features obtained by MALDI MS directly from 1 μl of unfractionated serum that distinguishes patients with lung cancer from matched controls with an overall 72.6% accuracy in a blinded test set of matched cases and controls. This proteomic signature classifies cases from matched controls, independently of sex, smoking status, pack-years of smoking history, or CRP levels. This suggests that this signature identifies more than a nonspecific inflammatory response. In addition, the specificity of this signature (85.7 %) may provide added value to a sensitive test (such as chest computed tomography) in reducing the risk of futile thoracotomies, and in avoiding missing a chance of cure should the test be negative, a hypothesis that deserves further investigation. These data represent the largest set of serum samples of lung cancer cases and carefully matched controls studied by MALDI MS in an attempt to address noninvasive diagnosis of lung cancer. The careful matching of cases and controls with significant comorbidities such as chronic obstructive pulmonary disease, asthma, and other comorbidities is likely to explain the lower diagnostic accuracy reported earlier.13 Although requiring confirmation in a larger dataset, we also found that a serum proteomic signature acquired by MALDI MS may be applicable to the diagnosis of stage I lung cancer (see Supplemental Table 2).
The data presented here demonstrate the necessity for spectral reproducibility when applying a MALDI MS-based analysis of serum. CVs reported are similar to those reported by others.28-30 It is recognized that many factors other than the underlying biology such as sample preparation, choice of instrument, and patient selection31 may influence the results through systematic biases. Although it is difficult to completely eliminate these factors, and despite the inherent heterogeneity in the samples under study, we specifically controlled for and evaluated these factors in detail. On the basis of our results, the variability observed between cases and controls represents true biological variability and is unlikely to be attributable to chance alone or to variability-related day of operation, cycles of freezing and thawing, or institution of origin. Overfitting is a possible limitation of the statistical methods applied to our data; nevertheless, the results from the training dataset are applied only once to the testing dataset, which is a conservative method to avoid overinterpretation of the results.
Our primary goal was not to discover causal or tumor-derived lung cancer–specific biomarkers among the most abundant serum proteins, but to determine the accuracy of a serum proteomic signature in distinguishing lung cancer cases from matched controls. Such a lung cancer–associated signature could potentially have clinical value independently of functional role of the proteins and peptides detected. Specific peptide fragments of SAA were identified as three discriminatory features of the profile. We confirmed the identification of SAA by Western blot and immunodepletion (Figure 5). Our results support, but do not prove, the concept of biological amplification. According to this concept, the systemic consequences of tumors detected by MALDI MS profiling of relatively abundant peptides from the serum produce patterns that distinguish health from disease states,6,32,33 reflecting specific host–response reactions to tumors. SAA is an acute phase reactant secreted into the circulation in a series of inflammatory and malignant processes,32,34 including lung cancer.35-38 SAA measured by enzyme-linked immunosorbent assay in the serum of patients with lung cancer and age- and gender-matched controls as a single biomarker was found to have limited 52% to 62% overall diagnostic accuracy.38 Our data support these findings and demonstrate that when SAA and specific truncated forms are combined with other biomarkers in a proteomic signature, they improve the diagnostic accuracy of a serum proteomic profile.
Limitations of the approach used in this study restricted the analysis to relatively abundant peptides/proteins within a mass range of 3,000 to 20,000, a small fraction of the serum proteome. This is primarily attributable to ion-suppression effects, dilution, lack of fractionation of the serum, and, secondarily, to the reduced resolution and sensitivity of MALDI MS technology at higher mass ranges.39 In addition, high abundant proteins in the serum may obscure our ability to detect lower-abundance proteins.40 Another limitation inherent is our case–control design, which, although efficient, is susceptible to selection bias.41
From this study, we conclude that we found a serum proteomic profile that discriminates lung cancer from matched controls independently of smoking history and markers of inflammation CRP. These results are explained by biological variability between samples as opposed to chance or analytical variability. To achieve clinical utility, and to demonstrate a role in the noninvasive diagnosis of lung cancer, this proteomic approach is likely to require further methodological refinements for simplifying the proteome, either by biochemical fractionation, enrichment of subproteomes, immunodepletion of the most abundant proteins, or further validation in prospectively collected samples, as well as proof of added value to the existing noninvasive diagnostic strategies.
Supplementary Material
Acknowledgments
We thank all individuals who provided their informed consent and participated in the study. We thank Ildiko Csiki, Darienne Adkins, Lynne Fenner, Blake Mann, Harriet Davis, Candace Murphy, and Ben Garcia for their assistance in consenting individuals and collection of serum. We thank Hans Rudolf Aerni, Pierre Chaurand, Lisa Manier, Julia Grigorieva, and David Hachey for their expertise in proteomics.
Dr. Massion is a Damon Runyon-Lilly Clinical Investigator supported by the Damon Runyon Cancer Research Foundation (CI-#19-03). This project was supported in part by the Lung SPORE P50 CA90949 (DPC), an NCI 5R33CA86243 (RMC), and Lung SPORE P50 CA90440 (JMS) from the National Institutes of Health, National Cancer Institute.
References
- 1.Jemal A, Murray T, Ward E, et al. Cancer statistics, 2005. CA Cancer J Clin. 2005;55:10–30. doi: 10.3322/canjclin.55.1.10. [DOI] [PubMed] [Google Scholar]
- 2.Kulpa J, Wojcik E, Reinfuss M, Kolodziejski L. Carcinoembryonic antigen, squamous cell carcinoma antigen, CYFRA 21-1, and neuron-specific enolase in squamous cell lung cancer patients. Clin Chem. 2002;48:1931–1937. [PubMed] [Google Scholar]
- 3.Pastor A, Menendez R, Cremades MJ, Pastor V, Llopis R, Aznar J. Diagnostic value of SCC, CEA and CYFRA 21.1 in lung cancer: a Bayesian analysis. Eur Respir J. 1997;10:603–609. [PubMed] [Google Scholar]
- 4.Seemann MD, Beinert T, Furst H, Fink U. An evaluation of the tumour markers, carcinoembryonic antigen (CEA), cytokeratin marker (CYFRA 21-1) and neuron-specific enolase (NSE) in the differentiation of malignant from benign solitary pulmonary lesions. Lung Cancer. 1999;26:149–155. doi: 10.1016/s0169-5002(99)00084-7. [DOI] [PubMed] [Google Scholar]
- 5.Chaurand P, Stoeckli M, Caprioli RM. Direct profiling of proteins in biological tissue sections by MALDI mass spectrometry. Anal Chem. 1999;71:5263–5270. doi: 10.1021/ac990781q. [DOI] [PubMed] [Google Scholar]
- 6.Marshall J, Kupchak P, Zhu W, et al. Processing of serum proteins underlies the mass spectral fingerprinting of myocardial infarction. J Proteome Res. 2003;2:361–372. doi: 10.1021/pr030003l. [DOI] [PubMed] [Google Scholar]
- 7.Yanagisawa K, Shyr Y, Xu BJ, et al. Proteomic patterns of tumour subsets in non-small-cell lung cancer. Lancet. 2003;362:433–439. doi: 10.1016/S0140-6736(03)14068-8. [DOI] [PubMed] [Google Scholar]
- 8.Chen G, Gharib TG, Wang H, et al. Protein profiles associated with survival in lung adenocarcinoma. Proc Natl Acad Sci U S A. 2003;100:13537–13542. doi: 10.1073/pnas.2233850100. [DOI] [PMC free article] [PubMed] [Google Scholar]
- 9.Li J, Zhang Z, Rosenzweig J, Wang YY, Chan DW. Proteomics and bioinformatics approaches for identification of serum biomarkers to detect breast cancer. Clin Chem. 2002;48:1296–1304. [PubMed] [Google Scholar]
- 10.Adam BL, Qu Y, Davis JW, et al. Serum protein fingerprinting coupled with a pattern-matching algorithm distinguishes prostate cancer from benign prostate hyperplasia and healthy men. Cancer Res. 2002;62:3609–3614. [PubMed] [Google Scholar]
- 11.Banez LL, Prasanna P, Sun L, et al. Diagnostic potential of serum proteomic patterns in prostate cancer. J Urol. 2003;170:442–446. doi: 10.1097/01.ju.0000069431.95404.56. [DOI] [PubMed] [Google Scholar]
- 12.Sidransky D, Irizarry R, Califano JA, et al. Serum protein MALDI profiling to distinguish upper aerodigestive tract cancer patients from control subjects. J Natl Cancer Inst. 2003;95:1711–1717. doi: 10.1093/jnci/djg099. [DOI] [PubMed] [Google Scholar]
- 13.Yang SY, Xiao XY, Zhang WG, et al. Application of serum SELDI proteomic patterns in diagnosis of lung cancer. BMC Cancer. 2005;5:83. doi: 10.1186/1471-2407-5-83. [DOI] [PMC free article] [PubMed] [Google Scholar]
- 14.Taguchi F, Solomon B, Gregorc V, et al. Mass spectrometry to classify non-small-cell lung cancer patients for clinical outcome after treatment with epidermal growth factor receptor tyrosine kinase inhibitors: a multicohort cross-institutional study. J Natl Cancer Inst. 2007;99:838–846. doi: 10.1093/jnci/djk195. [DOI] [PubMed] [Google Scholar]
- 15.Diamandis EP. Point: proteomic patterns in biological fluids: do they represent the future of cancer diagnostics? Clin Chem. 2003;49:1272–1275. doi: 10.1373/49.8.1272. [DOI] [PubMed] [Google Scholar]
- 16.Coombes KR, Fritsche HA, Jr, Clarke C, et al. Quality control and peak finding for proteomics data collected from nipple aspirate fluid by surface-enhanced laser desorption and ionization. Clin Chem. 2003;49:1615–1623. doi: 10.1373/49.10.1615. [DOI] [PubMed] [Google Scholar]
- 17.Baggerly KA, Morris JS, Wang J, Gold D, Xiao LC, Coombes KR. A comprehensive approach to the analysis of matrix-assisted laser desorption/ionization-time of flight proteomics spectra from serum samples. Proteomics. 2003;3:1667–1672. doi: 10.1002/pmic.200300522. [DOI] [PubMed] [Google Scholar]
- 18.Sorace JM, Zhan M. A data review and re-assessment of ovarian cancer serum proteomic profiling. BMC Bioinformatics. 2003;4:24. doi: 10.1186/1471-2105-4-24. [DOI] [PMC free article] [PubMed] [Google Scholar]
- 19.Ransohoff DF. Lessons from controversy: ovarian cancer screening and serum proteomics. J Natl Cancer Inst. 2005;97:315–319. doi: 10.1093/jnci/dji054. [DOI] [PubMed] [Google Scholar]
- 20.Liotta LA, Lowenthal M, Mehta A, et al. Importance of communication between producers and consumers of publicly available experimental data. J Natl Cancer Inst. 2005;97:310–314. doi: 10.1093/jnci/dji053. [DOI] [PubMed] [Google Scholar]
- 21.Ockene IS, Matthews CE, Rifai N, Ridker PM, Reed G, Stanek E. Variability and classification accuracy of serial high-sensitivity C-reactive protein measurements in healthy adults. Clin Chem. 2001;47:444–450. [PubMed] [Google Scholar]
- 22.Zimmerman LJ, Wernke GR, Caprioli RM, Liebler DC. Identification of protein fragments as pattern features in MALDI-MS analyses of serum. J Proteome Res. 2005;4:1672–1680. doi: 10.1021/pr050138m. [DOI] [PubMed] [Google Scholar]
- 23.Yamagata N, Shyr Y, Yanagisawa K, et al. A training-testing approach to the molecular classification of resected non-small cell lung cancer. Clin Cancer Res. 2003;9:4695–4704. [PubMed] [Google Scholar]
- 24.Tukey JW. Tightening the clinical trial. Control Clin Trials. 1993;14:266–285. doi: 10.1016/0197-2456(93)90225-3. [DOI] [PubMed] [Google Scholar]
- 25.Shyr Y, Kim K. Weighted flexible compound covariate method for classifying microarray data. In: Berrar D, editor. A Practical Approach to Microarray Data Analysis. New York, NY: Kluwer Academic; 2003. pp. 186–200. [Google Scholar]
- 26.Hedenfalk I, Duggan D, Chen Y, et al. Gene-expression profiles in hereditary breast cancer. N Engl J Med. 2001;344:539–548. doi: 10.1056/NEJM200102223440801. [DOI] [PubMed] [Google Scholar]
- 27.Vapnik V. Statistical Learning Theory. New York, NY: Wiley; 1998. [Google Scholar]
- 28.Mobley JA, Lam YW, Lau KM, et al. Monitoring the serological proteome: the latest modality in prostate cancer detection. J Urol. 2004;172:331–337. doi: 10.1097/01.ju.0000132355.97888.50. [DOI] [PubMed] [Google Scholar]
- 29.Villanueva J, Philip J, Entenberg D, et al. Serum peptide profiling by magnetic particle-assisted, automated sample processing and MALDI-TOF mass spectrometry. Anal Chem. 2004;76:1560–1570. doi: 10.1021/ac0352171. [DOI] [PubMed] [Google Scholar]
- 30.Wadsworth JT, Somers KD, Cazares LH, et al. Serum protein profiles to identify head and neck cancer. Clin Cancer Res. 2004;10:1625–1632. doi: 10.1158/1078-0432.ccr-0297-3. [DOI] [PubMed] [Google Scholar]
- 31.Shaw MM, Riederer BM. Sample preparation for two-dimensional gel electrophoresis. Proteomics. 2003;3:1408–1417. doi: 10.1002/pmic.200300471. [DOI] [PubMed] [Google Scholar]
- 32.Tolson J, Bogumil R, Brunst E, et al. Serum protein profiling by SELDI mass spectrometry: detection of multiple variants of serum amyloid alpha in renal cancer patients. Lab Invest. 2004;84:845–856. doi: 10.1038/labinvest.3700097. [DOI] [PubMed] [Google Scholar]
- 33.Villanueva J, Shaffer DR, Philip J, et al. Differential exoprotease activities confer tumor-specific serum peptidome patterns. J Clin Invest. 2006;116:271–284. doi: 10.1172/JCI26022. [DOI] [PMC free article] [PubMed] [Google Scholar]
- 34.Cho WC, Yip TT, Yip C, et al. Identification of serum amyloid a protein as a potentially useful biomarker to monitor relapse of nasopharyngeal cancer by serum proteomic profiling. Clin Cancer Res. 2004;10:43–52. doi: 10.1158/1078-0432.ccr-0413-3. [DOI] [PubMed] [Google Scholar]
- 35.Sawa A, Ilzecki M, Gozdziuk K. Values of amyloid protein A in serum of patients after thoracic surgery–preliminary report [in Polish] Wiad Lek. 1997;50(suppl 1):171–177. [PubMed] [Google Scholar]
- 36.Howar BA, Wan MZ, Camp MJ, Corr C, Fitzgeral MC, Pat EF., Jr Identification and validation of a potential lung cancer serum biomarker detected by matrix-assisted laser desorption/ionization-time of flight spectra analysis. Proteomics. 2003;3:1720–1724. doi: 10.1002/pmic.200300514. [DOI] [PubMed] [Google Scholar]
- 37.Benson MD, Eyanson S, Fineberg NS. Serum amyloid A in carcinoma of the lung. Cancer. 1986;57:1783–1787. doi: 10.1002/1097-0142(19860501)57:9<1783::aid-cncr2820570912>3.0.co;2-l. [DOI] [PubMed] [Google Scholar]
- 38.Khan N, Cromer CJ, Campa M, Patz EF., Jr Clinical utility of serum amyloid A and macrophage migration inhibitory factor as serum biomarkers for the detection of nonsmall cell lung carcinoma. Cancer. 2004;101:379–384. doi: 10.1002/cncr.20377. [DOI] [PubMed] [Google Scholar]
- 39.Bahr U, Stahl-Zeng J, Gleitsmann E, Karas M. Delayed extraction time-of-flight MALDI mass spectrometry of proteins above 25,000 Da. J Mass Spectrom. 1997;32:1111–1116. doi: 10.1002/(SICI)1096-9888(199711)32:10<1111::AID-JMS567>3.0.CO;2-Y. [DOI] [PubMed] [Google Scholar]
- 40.Puchades M, Westman A, Blennow K, Davidsson P. Analysis of intact proteins from cerebrospinal fluid by matrix-assisted laser desorption/ionization mass spectrometry after two-dimensional liquid-phase electrophoresis. Rapid Commun Mass Spectrom. 1999;13:2450–2455. doi: 10.1002/(SICI)1097-0231(19991230)13:24<2450::AID-RCM811>3.0.CO;2-N. [DOI] [PubMed] [Google Scholar]
- 41.Ransohoff DF, Feinstein AR. Problems of spectrum and bias in evaluating the efficacy of diagnostic tests. N Engl J Med. 1978;299:926–930. doi: 10.1056/NEJM197810262991705. [DOI] [PubMed] [Google Scholar]
Associated Data
This section collects any data citations, data availability statements, or supplementary materials included in this article.