

Abstract
Migraine is a common disabling disorder with a significant genetic component, characterized by severe headache and often accompanied by nausea, vomiting, and light sensitivity. We identified two families, each with a distinct missense mutation in the gene encoding casein kinase Iδ (CKIδ), in which the mutation cosegregated with both the presence of migraine and advanced sleep phase. The resulting alterations (T44A and H46R) occurred in the conserved catalytic domain of CKIδ, where they caused reduced enzyme activity. Mice engineered to carry the CKIδ-T44A allele were more sensitive to pain after treatment with the migraine trigger nitroglycerin. CKIδ-T44A mice also exhibited a reduced threshold for cortical spreading depression (believed to be the physiological analog of migraine aura) and greater arterial dilation during cortical spreading depression. Astrocytes from CKIδ-T44A mice showed increased spontaneous and evoked calcium signaling. These genetic, cellular, physiological, and behavioral analyses suggest that decreases in CKIδ activity can contribute to the pathogenesis of migraine.
INTRODUCTION
Migraine is a complex neurological disorder that affects 20 to 30% of the population (1, 2). About one-third of patients with migraine experience aura: a visual, sensory, or language disturbance preceding the migraine headache (3). Family and epidemiological studies provide strong evidence for a genetic contribution to migraine, although environmental factors also play a role (4, 5). Mutations in three different genes have been identified to cause familial hemiplegic migraine, an uncommon variant of migraine associated with unilateral weakness (6–8). The genetic basis for common forms of migraine (with and without aura) is less clear. Multiple susceptibility loci for migraine have been identified (9–12), and a potassium channel gene has been linked to migraine with aura in a single family (13). These studies suggest that a variety of genetic alterations affecting various aspects of brain excitability can lead to similar migraine phenotypes.
Here, we describe a family that presented for clinical evaluation of familial migraine with aura. In addition to migraine, the family members exhibited circadian patterns consistent with familial advanced sleep phase syndrome (FASPS), in which individuals go to sleep unusually early in the evening and wake early in the morning. We identified a mutation (threonine to alanine, T44A) in casein kinase Iδ (CKIδ) as a cause of FASPS in this family (14). CKIδ is a ubiquitous serine-threonine kinase that phosphorylates the circadian clock protein Per2 and many other proteins involved in brain signaling (15). In vitro studies showed that the T44A alteration in CKIδ resulted in reduced enzyme function in vitro, and both mice and flies expressing the mutant allele had significant sleep-wake cycle alterations (14). Given that migraine with aura was a prominent component of the presenting phenotype of the family in whom the CKIδ mutation was identified, we investigated a potential role for CKIδ in migraine.
RESULTS
Human phenotypes
Fourteen members of the initial family with CKIδ allele–associated FASPS (K5231) were available for structured interview, physical examination, and CKIδ genotyping, including four spouses of affected individuals with potentially affected offspring (Fig. 1A). The proband (#33376) carried the CKIδ-T44A allele and met diagnostic criteria both for FASPS and for migraine with aura (MA) by ICHD-2 (International Classification of Headache Disorders, Second Edition) criteria (16). Of the 13 other family members that we characterized, 5 individuals carried the CKIδ-T44A allele, and all of these also met diagnostic criteria for either MA or migraine without aura (MO). Three individuals who were offspring of CKIδ-T44A allele carriers, but did not carry the allele themselves, also met diagnostic criteria for MA (Fig. 1A).
Fig. 1. Migraine kindreds with mutations in the gene encoding CKIδ and in vitro enzymatic analysis.

(A) Kindred 5231 segregating the T44A CKIδ allele. (B) Kindred 5579 segregating the H46R CKIδ allele. Phenotypes are as noted, and probands are indicated by arrows. “Migraine” indicates symptoms consistent with ICHD-2 migraine without aura. “Aura” indicates symptoms consistent with ICHD-2 migraine aura. (C) Saturation kinetic analysis of wild-type (●), T44A (□), and H46R (◆) CKIδΔ317 using α-casein, PER2 peptide, and ATP. (D and E) Phosphorylation assays. Transiently transfected connexin43 is phosphorylated when coexpressed with CKIδ wild type. FLAG-connexin43 was expressed alone or with CKIδ wild type, T44A, and H46R in HEK293 cells. FLAG-connexin43 was immunoprecipitated by anti-FLAG conjugated to agarose at 4°C for 4 hours. These extracts were resolved by SDS–polyacrylamide gel electrophoresis (SDS-PAGE), and phosphorylated and dephosphorylated connexin43 was detected by Western blotting with anti-phosphoserine and anti-FLAG antibodies, respectively. Input blot proteins were detected with anti-FLAG, anti-GFP (green fluorescent protein), and β-actin antibody. Relative phosphorylation was normalized to connexin43 protein levels, quantified, and analyzed by LI-COR image software. Data are means ± SEM (n ≥ 4). *P < 0.05, analysis of variance (ANOVA) followed by Tukey test.
The clinical characteristics of migraine for the CKIδ-T44A allele carriers were unremarkable with respect to age of onset, time of day of attack onset, duration and character of aura symptoms, presence of cutaneous allodynia (the experience of innocuous touch as uncomfortable or tender), and duration of headache per attack. The proband (#33376) developed chronic migraine (more than 15 headache days per month) from her early 20s through her early 30s and then again between her early 40s and her early 50s with spontaneous remission each time. Brain magnetic resonance imaging studies for three individuals (#33373, #33374, and #33376) were unremarkable apart from evidence of a previous pituitary tumor excision in #33373. The proband’s mother (#33374) had French-Canadian ancestry.
After identifying CKIδ-T44A in K5231, we sequenced the gene encoding CKIδ in blood samples from more than 70 FASPS probands and identified a second mutation in a single individual (#35315 in kindred 5579) that predicts a histidine-to-arginine change at position 46 (H46R) (Fig. 1B and fig. S1), two amino acids downstream from the T44A substitution. This family is primarily of English and Irish descent. Information regarding the migraine phenotype in the family with the H46R mutation was obtained by an e-mail survey and by follow-up e-mail or phone contact. Phenotypic data were analyzed blind to genotypes and FASPS phenotypes. Four of the five family members who carried the H46R allele had MO, MA, or migraine aura without headache, and the fifth had probable migraine by ICHD-2 criteria. Of five family members who did not carry the H46R allele, one had MA. We examined the 1000 Genomes database, National Heart, Lung, and Blood Institute (NHLBI) ESP6500 variant data set, and 69 public genomes from Complete Genomics for the T44A and H46R alleles that we had identified in the migraine families and found neither allele in these controls. No other coding variants in the first 200 amino acids of CKIδ were found in Caucasian samples available in public databases. We also sequenced DNA from an additional 250 Northern European controls from our laboratories and found these alleles in none of them. Furthermore, the protein sequences of CKIδ are extremely conserved across species from human to fruit fly to single-cell algae, and T44 and H46 are absolutely conserved (fig. S1). Thus, these two CKIδ alleles were not present in more than 2600 control chromosomes. We estimate that the chances of coincidentally having mutations in the same ultraconserved region in two families with the same phenotype are extremely small.
We previously showed that the CKIδ-T44A protein has reduced kinase activity in comparison to the wild-type enzyme (14). We repeated these experiments for the CKIδ-H46R isoform (Fig. 1C). CKIδ-H46R also showed decreased kinase activity with a Vmax of (mean ± SEM) 104.64 ± 6.61 nM min−1 nM−1 compared to 198.27 ± 11. 23 nM min−1 nM−1 for the wild-type enzyme, representing a 53% reduction in activity (P < 0.01, n = 3). The Michaelis constant (Km) was 43.38 ± 6.17 μM for CKIδ-H46R and 36.48 ± 7.79 μM for wild-type CKIδ (Table 1). This decrease in Vmax suggests that the mutation causes a reduction in the catalytic rate of phosphotransfer. There may be a subtle effect on enzyme recognition of the substrate as the Km of the mutant kinase activity is decreased with PER2 peptide but is not significantly different with casein or adenosine triphosphate (ATP). We also tested the ability of wild-type and mutant forms of CKIδ to phosphorylate connexin43, a known substrate hypothesized to be relevant to migraine (17). Both the T44A and H46R mutant forms of CKIδ phosphorylated connexin43 to a lesser degree than did wild-type CKIδ (Fig. 1, D and E).
Table 1. Biochemical characterization of the migraine-associated CKIδ mutant enzymes.
n ≥ 3 independent experiments with three replicates each; all measurements shown are ±SEM.
| Substrate | α-Casein
|
PER2 peptide
|
ATP
|
|||
|---|---|---|---|---|---|---|
| Vmax (nM min−1 nM−1) | Km (μM) | Vmax (nM min−1 nM−1) | Km (μM) | Vmax (nM min−1 nM−1) | Km (μM) | |
| Wild-type CKIδΔ317 | 198.3 ± 11.2 | 36.5 ± 6.2 | 184.0 ± 24.4 | 635.8 ± 131.4 | 71.7 ± 14.7 | 180.6 ± 80.1 |
| CKIδ-T44AΔ317 | 130.3 ± 6.7* | 29.4 ± 4.8 | 80.1 ± 12.6* | 230.6 ± 76.5* | 22.9 ± 0.4* | 30.0 ± 2.2 |
| CKIδ-H46RΔ317 | 104.6 ± 6.6* | 43.4 ± 7.8 | 49.5 ± 8.8* | 371 ± 120.4* | 25.8 ± 3.2* | 104.7 ± 33.3 |
P < 0.05 (Student’s t test).
Increased nitroglycerin-induced hyperalgesia in CKIδ-T44A mice
To further examine whether mutant CKIδ can cause migraine symptoms, we tested CKIδ-T44A transgenic mice for their susceptibility to a migraine-like phenotype. Nitroglycerin (NTG) evokes peripheral mechanical and thermal hyperalgesia in mice and humans (18, 19). We quantified NTG-evoked mechanical and thermal hyperalgesia in CKIδ-T44A mice and wild-type littermate controls. Mechanical and thermal nociception thresholds were determined with von Frey filaments and the Hargreaves radiant heat assay, before and for a 4-hour period after intraperitoneal injection of NTG (1, 3, 5, 7, or 10 mg/kg). During the 4-hour follow-up, the mechanical thresholds were significantly lower in CKIδ-T44A mice than in wild-type controls (n = 14 wild-type and 15 CKIδ-T44A, P < 0.01 for each dose with a linear mixed-effects model; Fig. 2 and table S1). After NTG injection, CKIδ-T44A mice were also more sensitive to thermal stimuli than wild-type siblings, with a significantly slower recovery from thermal hyperalgesia (n = 24 CKIδ-T44A and n = 21 wild-type mice; P < 0.01 for each dose with a linear mixed-effects model; Fig. 2 and table S2). Because migraine is more common in women than men, we compared female and male CKIδ-T44A mice with wild-type animals 90 min after NTG (5 mg/kg) injection. At this dose and time point, female, but not male, CKIδ-T44A mice showed a significant reduction in latency to paw withdrawal compared to wild-type animals (males: wild-type, 0.99 ± 0.69 s; CKIδ-T44A, 2.46 ± 0.7 s; P = 0.38; females: wild-type, 0.69 ± 0.75 s; CKIδ-T44A, 2.87 ± 0.58 s; P = 0.008, ANOVA with post hoc Tukey test), suggesting that both sex and genotype may contribute to the difference in thermal hyperalgesia. Rotarod testing showed no difference in initial or repeat performance for CKIδ-T44A mice and wild-type mice (fig. S2), suggesting that differences in response to thermal and mechanical stimulation were not due to differences in motor function or learning.
Fig. 2. Differential effects of mechanical and thermal stimuli in response to NTG for wild-type and CKIδ-T44A mice.

Data shown (means ± SEM) were compared with a linear mixed-effects model. Gray lines, wild type; black lines, CKIδ-T44A. Differences across time between CKIδ-T44A and wild type are significant at each NTG dosage (P values displayed for each panel). Asterisks indicate time points with significant difference between genotypes. (A and C) Mechanical hyperalgesia measured with von Frey hair (Semmes-Weinstein monofilament). (B and D) Thermal hyperalgesia in CKIδ-T44A and wild-type mice in response to NTG [5 mg/kg (B) or 10 mg/kg (D)] intraperitoneal injection, measured with radiant heat assay (Hargreaves test). *P < 0.05 (see tables S1 and S2 for detailed data).
Neurons in the trigeminal nucleus caudalis (TNC) and laminae I to V of upper cervical dorsal horn (C1 and C2) receive craniofacial pain input and are believed to be activated during migraine (20–23). We administered NTG (5 mg/kg) to CKIδ-T44A (n = 7) and wild-type littermates (n = 6) and measured the number of activated neurons in TNC, C1, and C2 with Fos immunohistochemistry. After NTG treatment, we found a significant increase in the number of Fos-positive nuclei in all three areas in CKIδ-T44A animals compared to wild-type littermates in TNC (mean ± SEM, 34 ± 2 versus 11 ± 1), C1 dorsal horn (33 ± 3 versus 17 ± 2), and C2 dorsal horn (28 ± 2 versus 14 ± 2) (Fig. 3). The number of Fos-positive nuclei was not significantly different in laminae VI to X.
Fig. 3. NTG-induced Fos expression in the spinal cord and TNC.

(A) Quantification of Fos-immunoreactive nuclei in the cervical spinal cord lamina I to V, VI to X, and TNC in age-matched wild-type (n = 6) and CKIδ-T44A transgenic (n = 7) mice 2 hours after treatment with systemic NTG (5 mg/kg). Data are expressed as average numbers of Fos+ cells per section. *P < 1 × 10⁻⁵, two-way Student’s t test. (B and C) Representative sections showing Fos immunoreactivity in wild-type (B) and CKIδ-T44A (C) TNC.
Reduced threshold for induction of cortical spreading depression in CKIδ-T44A mice
To investigate the effects of CKIδ mutations on migraine-related cortical excitability, we used optical imaging and electrophysiological recording to measure cortical spreading depression (CSD) in vivo in CKIδ-T44A mice (Fig. 4, A and B). Potassium chloride (KCl) was applied to the cortex at increasing volumes until CSD was induced to determine the threshold for evoking CSD (24). CSD thresholds were significantly lower in CKIδ-T44A compared to wild-type mice (Fig. 4D). CSD velocities were similar in both groups (Fig. 4C). After we determined these threshold values, repeat inductions were performed at threshold stimulus every 10 min for the next 60 min. Despite the difference in the thresholds, there was no significant difference in the number of successful CSD inductions between the two groups (Fig. 4), showing that the lower CSD thresholds in CKIδ-T44A mice were reproducible over time. The number of CSDs induced in response to a constant stimulus is also used to measure CSD susceptibility (25). During 60 min of continuous application of KCl, CKIδ-T44A mice showed a significantly greater number of CSD events than did wild-type mice (Fig. 4E).
Fig. 4. Increased susceptibility to CSD in CKIδ-T44A mice.

(A) Normalized reflectance images (r/r0 × 100) show CSD-associated optical intrinsic signal (OIS) changes in a CKIδ-T44A mouse brain. KCl-induced CSD causes changes in reflectance that propagate concentrically outward from the source at about 3 mm/min. Reduced reflectance precedes brightening, followed by profound darkening (image 4) before return toward baseline. Reduced arterial reflectance shows the arterial dilation (arrows) that precedes CSD. Numbers indicate the seconds after CSD induction. Scale bar, 500 μm. Gray circle, field potential electrode and optical measurement location. (B) OIS and field potential traces from the same experiment as in (A), showing OIS changes and the direct current field potential shift of CSD. OIS trace shows percentage change from pre-CSD. (C) CSD velocity in CKIδ-T44A mice and wild-type (WT) littermates. Median [interquartile range (IQR)] velocity was 2.7 mm/min (2.0 to 3.0 mm/min) in wild-type littermates and 2.6 mm/min (2.3 to 3.2 mm/min) in CKIδ-T44A mice (n = 6 wild-type mice, 17 CSD; 9 CKIδ-T44A mice, 29 CSD; P = 0.77, Mann-Whitney-Wilcoxon test). (D) Threshold for CSD in wild-type and CKIδ-T44A mice. Median (IQR) threshold was 0.28 μl (0.2 to 0.49 μl) of 1 M KCl in wild-type littermates compared to 0.20 μl (0.14 to 0.35 μl) for CKIδ-T44A mice (n = 11 wild-type mice, 43 CSDs; 14 CKIδ-T44A mice, 55 CSDs; P = 0.001, Mann-Whitney-Wilcoxon test). There was no significant difference in the ratio of successful CSD inductions in wild-type (3.90:6) versus CKIδ-T44A (3.92:6) mice (n = 11 wild-type, 14 CKIδ-T44A mice; P = 0.34, Mann-Whitney-Wilcoxon test). (E) Elicitation of CSD in response to constant stimulation over an hour in CKIδ-T44A mice and their wild-type littermates. Wild-type mice had median (IQR) of 8.0 CSD/hour (6.5 to 9.25 CSD/hour) and CKIδ-T44A mice had 9.5 CSD/hour (8.75 to 12.75 CSD/hour) (n = 6 wild-type mice, 10 CKIδ-T44A mice; P = 0.03, Mann-Whitney-Wilcoxon test).
Enhanced CSD-associated arterial dilation in CKIδ-T44A mice
Meningeal and cortical surface arteries react to CSD (26, 27). Activation of perivascular nociceptive afferents has been proposed as a mechanism through which CSD activates the TNC (21, 23). Pre-CSD baseline arterial diameter was the same in CKIδ-T44A and wild-type mice (Fig. 5). In both CKIδ-T44A and wild-type mice, CSD was associated with multiphasic changes in arterial diameter: an initial dilation coincident with or ahead of the CSD wavefront, a constriction corresponding to the tissue depolarization, and a second dilation before a return toward baseline (27) (Fig. 5). Cortical surface arteries were more dilated in all phases of CSD in CKIδ-T44A mice compared with wild-type mice (Fig. 5C). We found no correlation between the magnitude of CSD-associated changes in vascular caliber and CSD threshold (177 diameter measurements in 15 mice where such measurement was possible: dilation 1: r = −0.009, t = 0.11, tcrit = 1.97, P = 0.9; constriction: r = 0.11, P = 0.13; dilation 2: r = 0.02, P = 0.69; post-CSD baseline: r = −0.006, P = 0.92), suggesting that these vascular differences were not due to the lower CSD thresholds in CKIδ-T44A mice.
Fig. 5. Increased dilation and decreased constriction to CSD in CKIδ-T44A mice.
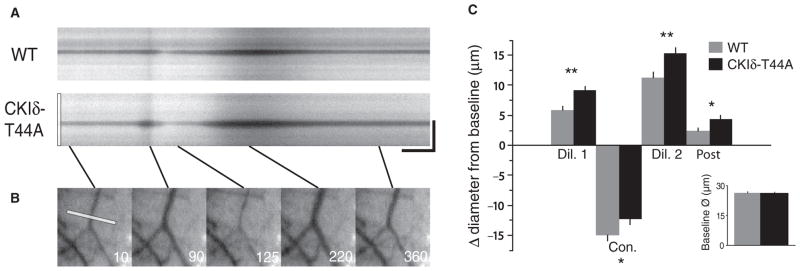
(A) Arterial diameter changes in wild-type and CKIδ-T44A mice during CSD. Kymographs reveal arterial diameter changes during acute CSD. CSD is associated with arterial dilation that precedes the parenchymal CSD wavefront (Fig. 4A), followed by constriction, a second dilation, and a post-CSD dilation. Scale bar, 25 s, 125 μm. (B) The first image shows the line drawn across the artery at baseline that generates CKIδ-T44A kymograph. The following panels show each of the CSD-associated phases of arterial activity. (C) Mean arterial diameter changes. Despite nearly identical baseline diameters (26.4 ± 0.7 versus 26.3 ± 0.5 μm; P = 0.94) in wild-type and CKIδ-T44A mice, dilation is more prominent and constriction is less marked in CKIδ-T44A versus wild-type arteries. Initial dilation (32.2 ± 0.9 μm versus 35.6 ± 0.7 μm; P = 0.00008), second dilation (37.7 ± 1.3 μm versus 41.7 ± 1.0 μm; P = 0.002), and post-CSD (28.8 ± 0.8 μm versus 30.7 ± 0.8 μm; P = 0.01) were all more dilated compared to baseline, and constriction was attenuated (11.4 ± 1.0 μm versus 14.1 ± 0.9 μm; P = 0.02, linear mixed-effects model with post hoc Tukey test) (wild type: n = 6 mice, 23 vessels, 67 measurements; CKIδ-T44A: n = 9 mice, 34 vessels, 110 measurements).
Amplitude, duration, and velocity of CSD
We compared the amplitude and duration of both intrinsic signal and electrophysiological variables associated with CSD in CKIδ-T44A and wild-type mice (table S3). There was no significant difference in intrinsic signal or dc (direct current) shift amplitude. Although the durations of intrinsic signal changes and dc shifts were significantly shorter in CKIδ-T44A mice, there was a significant correlation between duration of dc shift and CSD threshold in all mice (r = 0.6, t = 3.83, tcrit = 2.05, P = 0.0007, n = 25 mice) and in CKIδ-T44A and wild-type mice considered separately (CKIδ-T44A: r = 0.56, t = 2.68, tcrit = 2.13, P = 0.02, n = 17 mice; wild type: r = 0.65, t = 2.56, tcrit = 1.83, P = 0.03) (fig. S4). We ascribed this difference in duration to the significant difference in thresholds between the two groups. The velocity of CSD was similar between CKIδ-T44A and wild-type mice, with no significant difference detected (Fig. 4C).
Sex differences in CSD susceptibility
We previously identified a reduced threshold for CSD in female compared to male C57Bl/6 mice (24), and others have found a reduced CSD threshold in female mice expressing familial hemiplegic migraine mutations (28). We observed a gradient of CSD thresholds by sex and genotype, with the lowest thresholds in female CKIδ-T44A and the highest in male wild-type animals (fig. S3). ANOVA analysis of CSD thresholds by gender and genotype revealed a significant difference over the four combinations (female CKIδ-T44A, male CKIδ-T44A, female wild-type, and male wild-type; one-way ANOVA, F = 3.74, Fc = 2.70, P = 0.01). Post hoc Tukey test showed that the only significantly different paired comparison was between female CKIδ-T44A and male wild-type mice. We concluded that, although there may be a trend toward sex differences in our data set, the main driver of differences was genotype.
Calcium signaling in astrocytes from CKIδ-T44A mice
Astrocyte Ca2+ signaling occurs in conjunction with CSD and may mediate some of the vascular changes associated with CSD (29). The primary connexin expressed by astrocytes, connexin43, is a mediator of astrocyte signaling and can be modulated by CKIδ (30). We found that a greater number of cultured astrocytes from CKIδ-T44A mice showed spontaneous Ca2+ oscillations and intercellular Ca2+ waves than did astrocytes from wild-type mice (Fig. 6). We also investigated the effects of exposure to medium without extracellular Ca2+ (0 Ca2+), a condition that evokes intercellular waves of increased intracellular Ca2+ in astrocytes by causing release of ATP (31, 32). Astrocytes from CKIδ-T44A mice showed an increased Ca2+ response to 0 Ca2+ medium compared to wild-type astrocytes, with a greater number of sites of initiation of intercellular Ca2+ waves and a greater extent of propagation of intercellular Ca2+ waves (Fig. 6, B and C). We did not, however, detect a significant increase in ATP release to this stimulus in astrocytes from CKIδ-T44A mice (fig. S5).
Fig. 6. Increased spontaneous and evoked calcium signaling in CKIδ-T44A astrocyte cultures.

(A) Each image shows a 600 × 600–μm field of cultured cortical astrocytes. Change in fluo4 fluorescence from baseline is represented by grayscale. Darker gray indicates increase in intracellular Ca2+ concentrations. Astrocytes from CKIδ-T44A mice show increased spontaneous and 0 Ca2+–evoked signaling compared with those from wild-type mice. Scale bar, 100 μm. (B) Raster plots show pattern of Ca2+ signaling changes at baseline and upon exposure to 0 Ca2+ medium in wild-type (left) and CKIδ-T44A (right) astrocyte cultures. Traces (above raster plots) show the calcium response of a representative cell (indicated by asterisks) in wild-type and CKIδ-T44A cultures. (C) Average number of cells in a 600 × 600–μm field of cultured cortical astrocytes that show an increase in intracellular Ca2+ concentrations during 2 min under basal conditions (spontaneous) or during exposure to 0 Ca2+ medium (evoked). Error bars represent SEM. Significantly more astrocytes from CKIδ-T44A show spontaneous (P = 0.0008) and 0 Ca2+–evoked increases in intracellular Ca2+ concentrations compared to wild-type mice (P = 0.0006) [n = 16 cultures, 200 cells per culture from eight different CKIδ-T44A mice, and 12 cultures, 200 cells per culture from six different wild-type mice (two-tailed t test for samples of unequal variance for each comparison)].
DISCUSSION
We identified two distinct missense mutations in the gene encoding CKIδ that cosegregated with migraine in two independent families with advanced sleep phase syndrome. The mutations (T44A and H46R) occur in a conserved catalytic domain and reduce CKIδ kinase activity compared to wild-type. Mice expressing the CKIδ-T44A allele are more sensitive to pain and have increased activation of neurons in the TNC after treatment with a common migraine trigger, NTG. CKIδ-T44A mice also show a reduced threshold for CSD, increased frequency of CSD episodes, and greater arterial dilation with CSD. Astrocytes from CKIδ-T44A mice show increased spontaneous and evoked calcium signaling.
Migraine is frequent (~12% prevalence) in the general population, and it is unclear at this point what underlying genetic variants contribute to this frequency. Multiple loci that increase susceptibility to migraine have been identified (9–11, 13), and environmental factors could also play a role. In some cases, migraine is almost certainly caused by common complex genetic risk alleles segregating in the population. It is also possible that some alleles are autosomal dominant or autosomal recessive, but can be difficult to recognize as such because of polygenic genetic risk alleles segregating in the same families harboring the Mendelian alleles. This may be the case for the kindred reported here in which there are individuals with migraine who did not carry the migraine-associated CKIδ allele.
Of 11 mutation carriers, 10 were classified as affected and 1 was classified as probably affected. Comparison of the number of mutant allele carriers with migraine (10 of 11) to the noncarriers with migraine (5 of 13) using a Fisher’s exact test yielded a P value of 0.011. One would not expect association of CKIδ alleles with migraine at that high frequency by chance. Nonetheless, the fact that migraine occurred in some family members who did not express a mutant CKIδ allele suggests that each family may have other predispositions to the condition.
The association between two independent mutant CKIδ alleles and the migraine phenotype suggests that these mutations contribute to the pathogenesis of migraine. Further strengthening this argument are in vitro and in vivo mouse data that support a possible causative role of these variants in migraine.
Migraine is associated with increased sensitivity to all sensory modalities, and there is growing evidence that cutaneous allodynia is a quantifiable marker of the disorder (33, 34). Hyperalgesia evoked by the migraine trigger NTG in mice is a model for this allodynia (19). Increased NTG-evoked mechanical and thermal hyperalgesia exhibited by CKIδ-T44A mice is consistent with a role for CKIδ in sensory hypersensitivity that is relevant to migraine. Increased NTG-induced activation of c-fos–positive nuclei in the trigeminal dorsal horn of CKIδ-T44A mice indicates increased activation of neurons associated with craniofacial pain in comparison to wild type (21, 35). CKIδ-T44A mice thus show both behavioral and functional anatomical evidence of altered craniofacial nociception.
CKIδ-T44A mice showed both a significant reduction in the threshold for evoking CSD and an increased number of CSD events elicited by continuous stimulation, consistent with increased cortical excitability that has been observed in patients with migraine. A similar susceptibility to CSD has been observed in mice expressing mutations in a P/Q-type Ca2+ channel and a Na+/K+ adenosine triphosphatase that are responsible for familial hemiplegic migraine types I and II, respectively (28, 36, 37). In addition to the difference in the susceptibility to CSD, the cortical vascular response to CSD is altered in CKIδ-T44A mice. Cortical and meningeal vessels contain trigeminal afferents and transmit nociceptive signals (21, 23); the altered vascular response to CSD in CKIδ-T44A mice could be relevant to migraine-related pain.
Increased spontaneous and evoked Ca2+ signaling in astrocytes from CKIδ-T44A mice compared to wild-type mice suggests that alteration in astrocyte signaling could be a mechanism by which the CKIδ-T44A mutation influences cortical excitability and associated vascular responses. Astrocyte Ca2+ waves are consistently observed in conjunction with CSD (29, 38, 39), and astrocyte signaling plays an important role in neurovascular coupling (40). Astrocytes release extracellular messengers including ATP and glutamate through undocked connexin channels (hemichannels) (31, 41). Hypophosphorylation of connexin43 increases the proportion of connexin molecules existing as hemichannels in astrocytes compared with gap junctions, potentially leading to increased release of ATP and glutamate (30, 31, 41). We showed that connexin43 was hypophosphorylated by both mutant forms of CKIδ (Fig. 1) and that spontaneous and induced calcium signaling (Fig. 6), but not ATP release (fig. S5), was greater in cultured CKIδ-T44A astrocytes compared to wild type. Together, these findings suggest possible astrocytic mechanisms by which CKIδ mutations could predispose to migraine.
The relationship between the sleep phenotype and the migraine phenotype in individuals with alterations in the function of CKIδ is uncertain. Migraine can be modulated by sleep, and associations between migraine and a number of different sleep disorders have been reported (42). Mice expressing mutant alleles responsible for familial hemiplegic migraine type 1 have a circadian phenotype consisting of enhanced circadian phase resetting (43). Common cellular mechanisms may be involved in circadian function and episodic changes in brain excitability that cause migraine. On the other hand, migraine has not been reported as a part of the phenotype of other families with FASPS, indicating that the mechanisms underlying the migraine phenotype in families with CKIδ mutations may be distinct from those that cause alterations in sleep. Another interpretation is that CKIδ mutant families have a genetic background that enhances susceptibility to sleep phase–associated migraine triggers.
In summary, we have shown that mutations in CKIδ may contribute to the pathogenesis of human migraine and that mice expressing the CKIδ-T44A mutant enzyme show phenotypic features resembling those seen in the human disorder. The proteins encoded by all previously identified migraine genes are ion channels or pumps. CKIδ, in contrast, is an enzyme that modulates the functions of a variety of proteins, a subset of which could contribute to migraine pathogenesis. Identifying protein targets of CKIδ that are relevant to migraine may further elucidate the cellular signaling mechanisms underlying migraine, and identify new therapeutic approaches.
MATERIALS AND METHODS
Genetic association
The family members originally sought medical attention for symptoms of migraine, but during the course of evaluation, multiple individuals were also diagnosed with advanced sleep phase syndrome. Subjects signed consent or assent forms approved by the Institutional Review Boards at the University of California at San Francisco (UCSF) or the University of Utah. They then underwent physical and neurological examinations and structured interviews related to self-reported migraine traits and symptoms, circadian and sleep traits, and general health. Individuals were diagnosed with headache disorders according to the criteria of the ICHD-2. Individuals not meeting either “affected” or “unaffected” criteria were considered to be of “unknown” phenotype. Blood sample collection and DNA preparation were performed as previously described (14).
Polymerase chain reaction and Sanger sequencing of DNA samples
CKIδ was screened for mutations via Sanger sequencing of genomic DNA. Genomic information of CKIδ coding regions was obtained from Web site databases (National Center for Biotechnology Information: http://www.ncbi.nlm.nih.gov/ and UCSC Genome Bioinformatics: http://genome.ucsc.edu/) for primer design used for sequencing. Primers were designed outside of splice sites with the intent that intronic sequencing of at least 50 base pairs would flank each exon border. Twenty-five microliters of polymerase chain reactions (PCRs) was carried out per 100 ng of genomic DNA and 10 pmol of both forward and reverse primers. PCR procedures that lead to successful product amplification were as follows: 98°C, 30 s (98°C, 10 s; 60°C, 30 s; 72°C, 40 s) × 35, 72°C, 10 min, and 4°C hold. PCR product purification was done with the PCR96 Cleanup Plate (Millipore) and then sequenced. The primer set used for sequenced exon 2 of CKIδ, which harbored the T44A mutation, was as follows: forward primer, 5′-tgctaggaaggagaacacatcc-3′; reverse primer, 5′-agctgtgactgctttgtcagg-3′.
Protein purification and kinetic analysis
Subcloning, site-directed mutagenesis purification of enzymes, and kinase assays were performed as described (14). Briefly, reactions were conducted in 50 mM Hepes (pH 7.5), 1 mM dithiothreitol, and 1 mM MgCl2 at 25°C, with catalytic amounts of CKIδΔ317, CKIδΔ317 T44A, or CKIδΔ317 H46R (10 to 20 nM), 3000 Ci/mmol [γ-32P]ATP (1 to 500 μM), and substrate (1 to 500 μM, depending on the substrate, α-casein or PER2 peptide). Five microliters of the reaction mixture was spotted onto P81 Whatman paper and washed with 1% phosphoric acid. Radioisotope incorporation was assayed by exposure to phosphor-image screen and quantified on a Typhoon image scanner. Saturation experimental data were fit to the Michaelis-Menten equation with KaleidaGraph (Synergy Software), and parameters kcat and Km were determined.
Cell culture and transfection
Human embryonic kidney (HEK) 293 cells were cultured as a monolayer in Dulbecco’s modified Eagle’s medium (DMEM) supplemented with 10% fetal bovine serum (FBS). Cotransfection of HEK293 cells was performed with 4 mg of total DNA with Lipofectamine 2000 (Invitrogen) according to the manufacturer’s protocol and as described in the figure legend. Cell treatments were carried out as described in the figure legends. Soluble cell extracts were made in radioimmunoprecipitation assay buffer (Sigma) with PhosSTOP and Complete tabs (Roche). Protein concentration was quantified by Bradford assay (Bio-Rad).
Immunoprecipitation and Western blotting
Immunoprecipitations were performed with anti-FLAG antibody–conjugated agarose resin (Sigma) as described by the manufacturer. Western blotting and PAGE were carried out with standard protocols.
Animal care and handling
All protocols were approved by the Institutional Animal Care and Use Committees at UCSF and UCLA. Experiments were conducted on CKIδ-T44A line 827 (14) mice weighing between 20 and 30 g and their wild-type littermates. Animals were housed in temperature-controlled rooms on a 12-hour light-dark cycle. Experimenters were blind to the animal genotypes in all experiments.
Nociception experiments
NTG administration
A stock of NTG (5 mg/ml) (American Regent Inc.) dissolved in 30% alcohol, 30% propylene glycol, and water was further diluted fresh each day in 0.9% saline in a polypropylene tube to reach desired concentrations. Doses of 1, 3, 5, 7, or 10 mg/kg were administered intraperitoneally, with a polypropylene syringe to minimize the loss of NTG activity. Control mice received an intraperitoneal injection of 0.9% saline solution without NTG.
Behavioral assays
Animals were habituated to each testing apparatus for 60 min on the day before and again immediately before determination of baseline nociceptive thresholds. Each set of animals underwent nociception assay before and after application of a specific dose of NTG. Behavioral assays were conducted blind to the animal genotype.
Mechanical hypersensitivity testing
The von Frey (Semmes-Weinstein) monofilament method was used to test mechanical sensitivity. Animals were placed on a wire mesh stand, whereas calibrated Semmes-Weinstein monofilaments (North Coast Medical) were used for the up-and-down method of determining mechanical sensation of each hind paw before injection (baseline) and 1, 2, and 4 hours after NTG injection (44). Fourteen wild-type and 15 CKIδ-T44A animals were tested. Left and right paws were scored separately for two readings per mouse per time point. Mice were given 1 hour in home cages with food and water immediately after the 2-hour measurement and were tested again 4 hours after NTG as approved by the Institutional Animal Care and Use Committees of responsible institutions.
Thermal hypersensitivity testing
To determine thermal hypersensitivity, the radiant heat (Hargreaves) assay focuses radiant light on the hind paw and measures the time in seconds until the mouse removes each hind paw from the source of heat (PAW Thermal Stimulator, UCSD Department of Anesthesia) (19, 45). Three determinations of response were taken for every time point with at least 2 min between each trial. The Hargreaves assay measured thermal nociceptive behaviors immediately before and 30, 60, 90, 120, and 240 min after injection of NTG. Mice were returned to home cages for 1 hour after the 2-hour measurement and were acclimated to the Hargreaves apparatus for 1 hour again before the 4-hour time point. Twenty-four CKIδ-T44A mice were tested and 22 wild-type siblings were tested for doses of 1, 3, 5, 7, and 10 mg/kg. NTG thermal sensitivity experiments were repeated with one dose (5 mg/kg) at one time point (90 min) with 12 female CKIδ-T44A and 12 wild-type siblings.
Rotarod testing
Nine mice of each genotype (CKIδ-T44A mice and wild-type littermates) were tested for motor function and learning on the rotarod (46). The rotating rod attained a speed of 40 rpm over a period of 5 min. Three trials separated by 1 min each were completed in each set. Each animal underwent three sets of trials for a total of nine trials. Animals were given 15-min rest between each set of the tests.
Immunohistochemistry
CKIδ-T44A and wild-type littermates were treated with intraperitoneal injection of NTG (5 mg/kg). Two hours after NTG, mice were deeply anesthetized with isoflurane and perfused intracardially with phosphate-buffered saline (PBS) and then 4% paraformaldehyde. Whole brain and spinal cord were fixed overnight in 4% paraformaldehyde and transferred to 30% sucrose in PBS at 4°C until sectioning. Transverse 35-μm sections of frozen spinal cord and brain were cut. Free floating sections were incubated in PBS and 0.3% Triton X-100 and 5% normal goat serum (NGS-T) for 1 hour before incubation in primary anti-Fos (Oncogene Science) at a dilution of 1:40,000 in 5% NGS-T for 18 hours at 4°C. Sections were washed in PBS before incubation for 1 hour in biotinylated goat anti-rabbit antibody (Vector Laboratories), washed in PBS, and incubated in ExtrAvidin-Peroxidase (Sigma-Aldrich Biotechnology) for 1 hour, followed by detection of the peroxidase with 3,3′-diaminobenzidine (Sigma). Mounted and cover-slipped sections were counted for Fos-reactive nuclei by a single blinded observer. Fos-positive cells were counted in TNC, C1 dorsal horn, or C2 dorsal horn in 6 to 10 sections per animal (n = 6 wild-type and 7 CKIδ-T44A mice). Sections were excluded if the tissue was torn or damaged. Sections were visualized with an Olympus CX41 upright light microscope. Photographs were taken with a PixeLINK PL-A662 and captured with the PixeLINK Capture software. A two-tailed Student’s t test was used to determine statistical significance.
CSD experiments
Anesthesia was induced (5%) and maintained (0.8 to 1.5%) with isoflurane. Temperature was maintained at 37 ± 0.5°C with a rectal temperature probe and homeothermic blanket. A pulse oximetry probe was placed on the right hindpaw (8600 V, Nonin), and hemoglobin saturation was maintained at >95%. Anesthetic levels were adjusted to maintain the animal in burst suppression on field potential recordings, with an interburst interval of 4 to 9 s (47). At this anesthetic depth, the animal had no response to noxious stimulation. There were no significant differences in anesthetic level, temperature, hemoglobin saturation, or field potential burst duration or interburst interval between wild-type and CKIδ-T44A mice (P > 0.3 for all comparisons, Student’s t test).
Each animal was placed in a stereotaxic frame (Kopf Instruments), and the parietal skull was exposed. The skull was thinned to transparency, to boundaries 1 mm from temporal ridge, sagittal suture, bregma, and lambda. A glass recording electrode (~20-μm diameter, 1 M KCl fill solution, ~0.5-megohm resistance) was advanced 550 μm into the cortex through a burr hole placed 0.5 mm anteromedial to lambda to collect field potentials. A silver-silver chloride ground wire was placed in the neck musculature. A second burr hole was placed 0.5 mm from the temporal ridge midway between bregma and lambda for CSD induction. A 34-gauge fused silica micropipette filled with 1 M KCl and attached to a pneumatic picopump (MicroFil and PV-820, WPI) was carefully apposed to the cortex in the second burr hole.
The animal was placed on the imaging stage of a custom microscope and rested under anesthesia for 1 hour before imaging. The cortex was illuminated with white light (5500 K, 400- to 700-nm spectral range, Philips Lumileds). Reflected light was collected for OIS with a lens system consisting of two f/0.95 lenses connected front to front, focused on a high-sensitivity (0.00015 lux) 8-bit charge-coupled device camera (Watec 902K). Field of view was 4.2 × 3.2 mm, and pixel size was 6.6 μm. Images were acquired at 2 Hz for 1 hour. Field potentials were acquired (bandpass, 0 to 1 kHz), amplified (A-M Systems 3000), digitized (at 1 kHz; PCI-6251, National Instruments), and recorded and synchronized with imaging data by a custom LabView Virtual Instrument (National Instruments).
CSD thresholding consisted of a series of pulses with progressively increasing pressure ejecting increasing volumes of KCl from the pipette (4 to 40 psi in 2-psi increments at 300-s intervals, corresponding to KCl volumes of 0.2 to 1.4 μl) until threshold for CSD was achieved (24). After determination of threshold, repeat inductions were performed at threshold levels every 10 min for a total of six KCl ejections. Volume ejected from the KCl pipette was verified before and after each experiment to ensure replicable thresholds. The KCl method of thresholding was used because it allowed focal administration of the KCl stimulus (electrical stimulation causes more diffuse activation and thus arterial dilation, which impedes measurement of CSD-associated vascular parameters). After thresholding, the animal was euthanized with 5% isoflurane followed by nitrogen asphyxia.
To test the rate of CSD in response to a constant stimulus, we positioned the KCl pipette just over the burr hole without touching the brain, and a 4-psi tonic output from the pneumatic picopump produced a constant flow of 1 M KCl into the burr hole during the course of an hour-long experiment.
Image analysis was performed with ImageJ [National Institutes of Health (NIH), Bethesda, MD] and IGOR Pro (WaveMetrics). Normalized reflectance images (r/r0 × 100) were generated by dividing each frame by an average of the first 10 frames of the experiment. To generate an optical trace of CSD, we traced a 100-pixel curved line region of interest (ROI) along the CSD wavefront at the point where it contacted the field potential electrode. Each pixel of the ROI generated a trace of the CSD waveform, synchronous with electrophysiological changes, which could be compared with the other traces in each experiment as well as with separate experiments. Surface arteries were identified by morphology and by reactivity to CSD, as previously described (27). To sample vessels in an unbiased manner, we divided each imaging field into quadrants. The arterial segment closest to the center of each quadrant was chosen for analysis, yielding four arterial ROIs per experiment. A 50-pixel (330-μm) line ROI was placed perpendicular to the long axis of the vessel. When plotted over the course of the experiment, this line ROI revealed the diameter of the vessel, which could be computed via pixel count (Threshold and Measure Functions, ImageJ). ROIs (6 × 6 pixels) were placed immediately adjacent to the line ROIs that were used to measure arterial diameter. These allowed comparison of parenchymal and arterial changes in the same location.
OIS and field potential amplitudes and durations were measured after detecting the critical points in the respective intrinsic signal and field potential traces. This was done by computing the second derivative of each data set, allowing points of maximum change in slope to be identified. Five critical points were typically seen for intrinsic signal data: at the onset of changes, at the minimum of the first phase, at the maximum of the second phase, at the minimum of the third phase, and during a return to baseline levels (Fig. 3B). Three critical points were found for field potential data: at the onset, maximum, and recovery of dc shift, respectively (Fig. 3B). OIS duration was calculated between the first and fourth critical points, and area under the curve was computed separately for each phase using its boundary critical points. dc shift duration was calculated between the first and third field potential critical points, and amplitude was calculated between the first and second critical points.
Calcium imaging of astrocytic cultures
Astrocyte cultures were prepared from 1-day postnatal mouse pups (31). Cortices were removed, mechanically dissociated, and filtered as above, but the cells were resuspended and plated on glass coverslips in DMEM/F12 medium supplemented with 5% FBS. At days 4 to 7 in culture, cells were mechanically shaken for 30 min per day, and non-adherent cells were removed. Cells were cultured for 14 days before experimentation.
Changes in intracellular calcium concentration were recorded with a custom confocal microscope as previously described (48). Briefly, cells were loaded with the calcium indicator fluo4 by bath exposure to 5 μM fluo4 acetomethoxy ester (Molecular Probes) for 30 min. Cells were washed repeatedly to remove excess indicator and then placed on the stage of a modified Nikon Diaphot microscope (Nikon Instruments). Excitation from a 475-nm diode laser was scanned via resonance mirrors to the coverslip through a 20 × 0.90 numerical aperture (Olympus) objective. Fluorescence emission was collected through a 535-nm bandpass filter to a photomultiplier tube (Hamamatsu), and images were acquired at 5 Hz at a pixel resolution of 940 × 720 by an image acquisition board (Raven, BitFlow) controlled by Video Savant (IO Industries) software. Solutions containing glutamate, N-methyl-D-aspartate (NMDA), or 0 Ca2+ were applied by bath exchange.
ROIs were placed on all cells in each microscopic field, and values for fluo4 fluorescence versus time were determined for each cell in the field for each experiment. Line traces and raster plots were generated from normalized images (ΔF/F0).
ATP release
Assays of released ATP were performed with methods similar to those previously described (31). Astrocyte cultures were prepared as above and grown in plastic dishes. To measure basal ATP release, we replaced the medium above the cultures with 0.7 ml of Hanks’ balanced salt solution (HBSS) for 1 min. This medium was then removed, immediately frozen, and replaced with HBSS with no added Ca2+ and Mg2+ for 1 min, after which this medium was also collected and frozen. ATP assays were performed with the Enlighten assay kit (Promega) with luminescence measurements performed with a Wallac Victor plate reader. The concentration of ATP released into normal medium in 1 min was subtracted from that released in low Ca2+/Mg2+ medium in 1 min to determine the amount of stimulated ATP release.
Statistical testing
Unless otherwise noted, one-way ANOVA or Student’s t test was used, after determination that data sets were parametric. Post hoc testing was performed with Tukey test. Pearson’s test was used to assess correlation between different CSD-associated measures. Statistical tests were implemented in IGOR Pro 6.0 (WaveMetrics). Unless otherwise noted, error bars denote SEM.
For nociception experiments, differences in response to mechanical and thermal stimulation were examined with a linear mixed-effects model that accounted for both the correlation between repeated measurements taken across time on each mouse and the correlation between repeated measurements taken at each time point. The means, SEs, and differences of means reported in figures and in the text are based on the mixed model. Tests of the genotype-by-time interaction (P values in Fig. 2) assess the difference between CKIδ-T44A and wild type across the time spectrum. Analyses were conducted with SAS (version 9.3, SAS Institute Inc.).
Supplementary Material
Acknowledgments
We thank A. Ring for helpful discussion, E. Quinn and W. Waheed for assistance with clinical data acquisition, N. Blades for statistical expertise, and the families who participated in these studies.
Funding: This work was supported by NIH K08-NS059072 and R21-NS070084 and the American Headache Society (to K.C.B.), the A.P. Giannini Foundation (to E.A.B.), Department of Defense PR10085 and The Migraine Research Foundation (to A.C.C.), NIH R01-GM079180 (to Y.-H.F.), and NIH R01-HL59596 and the Sandler Neurogenetic Fund (to Y.-H.F. and L.J.P.). L.J.P. is an Investigator of the Howard Hughes Medical Institute (HHMI).
Footnotes
Author contributions: R.E.S., A.C.C., and L.J.P. conceived the study; K.C.B., E.A.B., W.C.H., and A.C.C. designed the experiments; K.C.B., E.A.B., R.E.S., J.Z., W.C.H., Y.H., H.-Y.L., C.R.J., Y.-H.F., and A.C.C. performed the experiments or collected the data; K.C.B., E.A.B., R.E.S., W.C.H., and A.C.C. analyzed the data; K.C.B., E.A.B., R.E.S., A.C.C., and L.J.P. wrote the paper.
Competing interests: The authors declare that they have no competing interests.
Data and materials availability: All published reagents will be shared according to NIH and HHMI guidelines.
www.sciencetranslationalmedicine.org/cgi/content/full/5/183/183ra56/DC1
Fig. S1. Alignments for Drosophila Dbt and mouse (m) and human (h) CKIδ and CKIε proteins.
Fig. S2. Motor function in wild-type and CKIδ-T44A mice.
Fig. S3. Gradient of CSD thresholds by sex and genotype.
Fig. S4. Scatterplot of CSD dc shift duration and threshold in all animals.
Fig. S5. Astrocyte ATP release evoked by low divalent cation solution.
Table S1. Mechanical sensitivity thresholds.
Table S2. Thermal responses.
Table S3. CSD-associated measures in CKIδ-T44A mice and wild-type littermates.
REFERENCES AND NOTES
- 1.Stewart WF, Wood C, Reed ML, Roy J, Lipton RB. AMPP Advisory Group, Cumulative lifetime migraine incidence in women and men. Cephalalgia. 2008;28:1170–1178. doi: 10.1111/j.1468-2982.2008.01666.x. [DOI] [PubMed] [Google Scholar]
- 2.Stovner LJ, Hagen K, Jensen R, Katsarava Z, Lipton R, Scher A, Steiner T, Zwart JA. The global burden of headache: A documentation of headache prevalence and disability worldwide. Cephalalgia. 2007;27:193–210. doi: 10.1111/j.1468-2982.2007.01288.x. [DOI] [PubMed] [Google Scholar]
- 3.Bigal ME, Liberman JN, Lipton RB. Age-dependent prevalence and clinical features of migraine. Neurology. 2006;67:246–251. doi: 10.1212/01.wnl.0000225186.76323.69. [DOI] [PubMed] [Google Scholar]
- 4.Russell MB, Olesen J. The genetics of migraine without aura and migraine with aura. Cephalalgia. 1993;13:245–248. doi: 10.1046/j.1468-2982.1993.1304245.x. [DOI] [PubMed] [Google Scholar]
- 5.Stewart WF, Staffa J, Lipton RB, Ottman R. Familial risk of migraine: A population-based study. Ann Neurol. 1997;41:166–172. doi: 10.1002/ana.410410207. [DOI] [PubMed] [Google Scholar]
- 6.De Fusco M, Marconi R, Silvestri L, Atorino L, Rampoldi L, Morgante L, Ballabio A, Aridon P, Casari G. Haploinsufficiency of ATP1A2 encoding the Na+/K+ pump α2 subunit associated with familial hemiplegic migraine type 2. Nat Genet. 2003;33:192–196. doi: 10.1038/ng1081. [DOI] [PubMed] [Google Scholar]
- 7.Dichgans M, Freilinger T, Eckstein G, Babini E, Lorenz-Depiereux B, Biskup S, Ferrari MD, Herzog J, van den Maagdenberg AM, Pusch M, Strom TM. Mutation in the neuronal voltage-gated sodium channel SCN1A in familial hemiplegic migraine. Lancet. 2005;366:371–377. doi: 10.1016/S0140-6736(05)66786-4. [DOI] [PubMed] [Google Scholar]
- 8.Ophoff RA, Terwindt GM, Vergouwe MN, van Eijk R, Oefner PJ, Hoffman SM, Lamerdin JE, Mohrenweiser HW, Bulman DE, Ferrari M, Haan J, Lindhout D, van Ommen GJ, Hofker MH, Ferrari MD, Frants RR. Familial hemiplegic migraine and episodic ataxia type-2 are caused by mutations in the Ca2+ channel gene CACNL1A4. Cell. 1996;87:543–552. doi: 10.1016/s0092-8674(00)81373-2. [DOI] [PubMed] [Google Scholar]
- 9.Chasman DI, Schürks M, Anttila V, de Vries B, Schminke U, Launer LJ, Terwindt GM, van den Maagdenberg AM, Fendrich K, Völzke H, Ernst F, Griffiths LR, Buring JE, Kallela M, Freilinger T, Kubisch C, Ridker PM, Palotie A, Ferrari MD, Hoffmann W, Zee RY, Kurth T. Genome-wide association study reveals three susceptibility loci for common migraine in the general population. Nat Genet. 2011;43:695–698. doi: 10.1038/ng.856. [DOI] [PMC free article] [PubMed] [Google Scholar]
- 10.Wieser T, Pascual J, Oterino A, Soso M, Barmada M, Gardner KL. A novel locus for familial migraine on Xp22. Headache. 2010;50:955–962. doi: 10.1111/j.1526-4610.2010.01673.x. [DOI] [PubMed] [Google Scholar]
- 11.Anttila V, Stefansson H, Kallela M, Todt U, Terwindt GM, Calafato MS, Nyholt DR, Dimas AS, Freilinger T, Muller-Myhsok B, Artto V, Inouye M, Alakurtti K, Kaunisto MA, Hämäläinen E, de Vries B, Stam AH, Weller CM, Heinze A, Heinze-Kuhn K, Goebel I, Borck G, Göbel H, Steinberg S, Wolf C, Björnsson A, Gudmundsson G, Kirchmann M, Hauge A, Werge T, Schoenen J, Eriksson JG, Hagen K, Stovner L, Wichmann HE, Meitinger T, Alexander M, Moebus S, Schreiber S, Aulchenko YS, Breteler MM, Uitterlinden AG, Hofman A, van Duijn CM, Tikka-Kleemola P, Vepsäläinen S, Lucae S, Tozzi F, Muglia P, Barrett J, Kaprio J, Farkkila M, Peltonen L, Stefansson K, Zwart JA, Ferrari MD, Olesen J, Daly M, Wessman M, van den Maagdenberg AM, Dichgans M, Kubisch C, Dermitzakis ET, Frants RR, Palotie; A International Headache Genetics Consortium, Genome-wide association study of migraine implicates a common susceptibility variant on 8q22.1. Nat Genet. 2010;42:869–873. doi: 10.1038/ng.652. [DOI] [PMC free article] [PubMed] [Google Scholar]
- 12.Freilinger T, Anttila V, de Vries B, Malik R, Kallela M, Terwindt GM, Pozo-Rosich P, Winsvold B, Nyholt DR, van Oosterhout WP, Artto V, Todt U, Hämäläinen E, Fernández-Morales J, Louter MA, Kaunisto MA, Schoenen J, Raitakari O, Lehtimäki T, Vila-Pueyo M, Göbel H, Wichmann E, Sintas C, Uitterlinden AG, Hofman A, Rivadeneira F, Heinze A, Tronvik E, van Duijn CM, Kaprio J, Cormand B, Wessman M, Frants RR, Meitinger T, Müller-Myhsok B, Zwart JA, Färkkilä M, Macaya A, Ferrari MD, Kubisch C, Palotie A, Dichgans M, van den Maagdenberg AM International Headache Genetics Consortium, Genome-wide association analysis identifies susceptibility loci for migraine without aura. Nat Genet. 2012;44:777–782. doi: 10.1038/ng.2307. [DOI] [PMC free article] [PubMed] [Google Scholar]
- 13.Lafrenière RG, Cader MZ, Poulin JF, Andres-Enguix I, Simoneau M, Gupta N, Boisvert K, Lafrenière F, McLaughlan S, Dubé MP, Marcinkiewicz MM, Ramagopalan S, Ansorge O, Brais B, Sequeiros J, Pereira-Monteiro JM, Griffiths LR, Tucker SJ, Ebers G, Rouleau GA. A dominant-negative mutation in the TRESK potassium channel is linked to familial migraine with aura. Nat Med. 2010;16:1157–1160. doi: 10.1038/nm.2216. [DOI] [PubMed] [Google Scholar]
- 14.Xu Y, Padiath QS, Shapiro RE, Jones CR, Wu SC, Saigoh N, Saigoh K, Ptácek LJ, Fu YH. Functional consequences of a CKIδ mutation causing familial advanced sleep phase syndrome. Nature. 2005;434:640–644. doi: 10.1038/nature03453. [DOI] [PubMed] [Google Scholar]
- 15.Knippschild U, Gocht A, Wolff S, Huber N, Löhler J, Stöter M. The casein kinase 1 family: Participation in multiple cellular processes in eukaryotes. Cell Signal. 2005;17:675–689. doi: 10.1016/j.cellsig.2004.12.011. [DOI] [PubMed] [Google Scholar]
- 16.Headache Classification Subcommittee of the International Headache Society, The International Classification of Headache Disorders: 2nd edition. Cephalalgia. 2004;24(Suppl 1):9–160. doi: 10.1111/j.1468-2982.2003.00824.x. [DOI] [PubMed] [Google Scholar]
- 17.Theis M, Jauch R, Zhuo L, Speidel D, Wallraff A, Döring B, Frisch C, Söhl G, Teubner B, Euwens C, Huston J, Steinhäuser C, Messing A, Heinemann U, Willecke K. Accelerated hippocampal spreading depression and enhanced locomotory activity in mice with astrocyte-directed inactivation of connexin43. J Neurosci. 2003;23:766–776. doi: 10.1523/JNEUROSCI.23-03-00766.2003. [DOI] [PMC free article] [PubMed] [Google Scholar]
- 18.Christiansen I, Thomsen LL, Daugaard D, Ulrich V, Olesen J. Glyceryl trinitrate induces attacks of migraine without aura in sufferers of migraine with aura. Cephalalgia. 1999;19:660–667. doi: 10.1046/j.1468-2982.1999.019007660.x. [DOI] [PubMed] [Google Scholar]
- 19.Bates EA, Nikai T, Brennan KC, Fu YH, Charles AC, Basbaum AI, Ptácek LJ, Ahn AH. Sumatriptan alleviates nitroglycerin-induced mechanical and thermal allodynia in mice. Cephalalgia. 2010;30:170–178. doi: 10.1111/j.1468-2982.2009.01864.x. [DOI] [PMC free article] [PubMed] [Google Scholar]
- 20.Storer RJ, Goadsby PJ. Trigeminovascular nociceptive transmission involves N-methyl-D-aspartate and non-N-methyl-D-aspartate glutamate receptors. Neuroscience. 1999;90:1371–1376. doi: 10.1016/s0306-4522(98)00536-3. [DOI] [PubMed] [Google Scholar]
- 21.Bolay H, Reuter U, Dunn AK, Huang Z, Boas DA, Moskowitz MA. Intrinsic brain activity triggers trigeminal meningeal afferents in a migraine model. Nat Med. 2002;8:136–142. doi: 10.1038/nm0202-136. [DOI] [PubMed] [Google Scholar]
- 22.Edvinsson L. Tracing neural connections to pain pathways with relevance to primary headaches. Cephalalgia. 2011;31:737–747. doi: 10.1177/0333102411398152. [DOI] [PubMed] [Google Scholar]
- 23.Zhang X, Levy D, Noseda R, Kainz V, Jakubowski M, Burstein R. Activation of meningeal nociceptors by cortical spreading depression: Implications for migraine with aura. J Neurosci. 2010;30:8807–8814. doi: 10.1523/JNEUROSCI.0511-10.2010. [DOI] [PMC free article] [PubMed] [Google Scholar]
- 24.Brennan KC, Romero-Reyes M, López Valdés HE, Arnold AP, Charles AC. Reduced threshold for cortical spreading depression in female mice. Ann Neurol. 2007;61:603–606. doi: 10.1002/ana.21138. [DOI] [PubMed] [Google Scholar]
- 25.Ayata C, Jin H, Kudo C, Dalkara T, Moskowitz MA. Suppression of cortical spreading depression in migraine prophylaxis. Ann Neurol. 2006;59:652–661. doi: 10.1002/ana.20778. [DOI] [PubMed] [Google Scholar]
- 26.Leao AAP. Pial circulation and spreading depression of activity in the cerebral cortex. J Neurophysiol. 1944;7:391–396. [Google Scholar]
- 27.Brennan KC, Beltrán-Parrazal L, López-Valdés HE, Theriot J, Toga AW, Charles AC. Distinct vascular conduction with cortical spreading depression. J Neurophysiol. 2007;97:4143–4151. doi: 10.1152/jn.00028.2007. [DOI] [PubMed] [Google Scholar]
- 28.Eikermann-Haerter K, Dileköz E, Kudo C, Savitz SI, Waeber C, Baum MJ, Ferrari MD, van den Maagdenberg AMJM, Moskowitz MA, Ayata C. Genetic and hormonal factors modulate spreading depression and transient hemiparesis in mouse models of familial hemiplegic migraine type 1. J Clin Invest. 2009;119:99–109. doi: 10.1172/JCI36059. [DOI] [PMC free article] [PubMed] [Google Scholar]
- 29.Chuquet J, Hollender L, Nimchinsky EA. High-resolution in vivo imaging of the neurovascular unit during spreading depression. J Neurosci. 2007;27:4036–4044. doi: 10.1523/JNEUROSCI.0721-07.2007. [DOI] [PMC free article] [PubMed] [Google Scholar]
- 30.Cooper CD, Lampe PD. Casein kinase 1 regulates connexin-43 gap junction assembly. J Biol Chem. 2002;277:44962–44968. doi: 10.1074/jbc.M209427200. [DOI] [PubMed] [Google Scholar]
- 31.Stout CE, Costantin JL, Naus CC, Charles AC. Intercellular calcium signaling in astrocytes via ATP release through connexin hemichannels. J Biol Chem. 2002;277:10482–10488. doi: 10.1074/jbc.M109902200. [DOI] [PubMed] [Google Scholar]
- 32.Arcuino G, Lin JH, Takano T, Liu C, Jiang L, Gao Q, Kang J, Nedergaard M. Intercellular calcium signaling mediated by point-source burst release of ATP. Proc Natl Acad Sci USA. 2002;99:9840–9845. doi: 10.1073/pnas.152588599. [DOI] [PMC free article] [PubMed] [Google Scholar]
- 33.Burstein R, Collins B, Jakubowski M. Defeating migraine pain with triptans: A race against the development of cutaneous allodynia. Ann Neurol. 2004;55:19–26. doi: 10.1002/ana.10786. [DOI] [PubMed] [Google Scholar]
- 34.Lipton RB, Bigal ME, Ashina S, Burstein R, Silberstein S, Reed ML, Serrano D, Stewart WF American Migraine Prevalence Prevention Advisory Group, Cutaneous allodynia in the migraine population. Ann Neurol. 2008;63:148–158. doi: 10.1002/ana.21211. [DOI] [PMC free article] [PubMed] [Google Scholar]
- 35.Classey JD, Knight YE, Goadsby PJ. The NMDA receptor antagonist MK-801 reduces Fos-like immunoreactivity within the trigeminocervical complex following superior sagittal sinus stimulation in the cat. Brain Res. 2001;907:117–124. doi: 10.1016/s0006-8993(01)02550-1. [DOI] [PubMed] [Google Scholar]
- 36.van den Maagdenberg AM, Pietrobon D, Pizzorusso T, Kaja S, Broos LA, Cesetti T, van de Ven RC, Tottene A, van der Kaa J, Plomp JJ, Frants RR, Ferrari MD. A Cacna1a knockin migraine mouse model with increased susceptibility to cortical spreading depression. Neuron. 2004;41:701–710. doi: 10.1016/s0896-6273(04)00085-6. [DOI] [PubMed] [Google Scholar]
- 37.Leo L, Gherardini L, Barone V, De Fusco M, Pietrobon D, Pizzorusso T, Casari G. Increased susceptibility to cortical spreading depression in the mouse model of familial hemiplegic migraine type 2. PLoS Genet. 2011;7:e1002129. doi: 10.1371/journal.pgen.1002129. [DOI] [PMC free article] [PubMed] [Google Scholar]
- 38.Basarsky TA, Duffy SN, Andrew RD, MacVicar BA. Imaging spreading depression and associated intracellular calcium waves in brain slices. J Neurosci. 1998;18:7189–7199. doi: 10.1523/JNEUROSCI.18-18-07189.1998. [DOI] [PMC free article] [PubMed] [Google Scholar]
- 39.Peters O, Schipke CG, Hashimoto Y, Kettenmann H. Different mechanisms promote astrocyte Ca2+ waves and spreading depression in the mouse neocortex. J Neurosci. 2003;23:9888–9896. doi: 10.1523/JNEUROSCI.23-30-09888.2003. [DOI] [PMC free article] [PubMed] [Google Scholar]
- 40.Attwell D, Buchan AM, Charpak S, Lauritzen M, Macvicar BA, Newman EA. Glial and neuronal control of brain blood flow. Nature. 2010;468:232–243. doi: 10.1038/nature09613. [DOI] [PMC free article] [PubMed] [Google Scholar]
- 41.Ye ZC, Wyeth MS, Baltan-Tekkok S, Ransom BR. Functional hemichannels in astrocytes: A novel mechanism of glutamate release. J Neurosci. 2003;23:3588–3596. doi: 10.1523/JNEUROSCI.23-09-03588.2003. [DOI] [PMC free article] [PubMed] [Google Scholar]
- 42.Brennan KC, Charles A. Sleep and headache. Semin Neurol. 2009;29:406–418. doi: 10.1055/s-0029-1237113. [DOI] [PMC free article] [PubMed] [Google Scholar]
- 43.van Oosterhout F, Michel S, Deboer T, Houben T, van de Ven RC, Albus H, Westerhout J, Vansteensel MJ, Ferrari MD, van den Maagdenberg AM, Meijer JH. Enhanced circadian phase resetting in R192Q Cav2.1 calcium channel migraine mice. Ann Neurol. 2008;64:315–324. doi: 10.1002/ana.21418. [DOI] [PubMed] [Google Scholar]
- 44.Chaplan SR, Bach FW, Pogrel JW, Chung JM, Yaksh TL. Quantitative assessment of tactile allodynia in the rat paw. J Neurosci Methods. 1994;53:55–63. doi: 10.1016/0165-0270(94)90144-9. [DOI] [PubMed] [Google Scholar]
- 45.Hargreaves K, Dubner R, Brown F, Flores C, Joris J. A new and sensitive method for measuring thermal nociception in cutaneous hyperalgesia. Pain. 1988;32:77–88. doi: 10.1016/0304-3959(88)90026-7. [DOI] [PubMed] [Google Scholar]
- 46.Dunham NW, Miya TS. A note on a simple apparatus for detecting neurological deficit in rats and mice. J Am Pharm Assoc Am Pharm Assoc. 1957;46:208–209. doi: 10.1002/jps.3030460322. [DOI] [PubMed] [Google Scholar]
- 47.Chang JC, Shook LL, Biag J, Nguyen EN, Toga AW, Charles AC, Brennan KC. Biphasic direct current shift, haemoglobin desaturation and neurovascular uncoupling in cortical spreading depression. Brain. 2010;133:996–1012. doi: 10.1093/brain/awp338. [DOI] [PMC free article] [PubMed] [Google Scholar]
- 48.Beltran-Parrazal L, López-Valdés HE, Brennan KC, Díaz-Muñoz M, de Vellis J, Charles AC. Mitochondrial transport in processes of cortical neurons is independent of intracellular calcium. Am J Physiol Cell Physiol. 2006;291:C1193–C1197. doi: 10.1152/ajpcell.00230.2006. [DOI] [PubMed] [Google Scholar]
Associated Data
This section collects any data citations, data availability statements, or supplementary materials included in this article.