

Abstract
This research evaluated the efficacy of a live and interactive group-specific normative feedback intervention designed to correct misperceptions of alcohol-related group norms and subsequently reduce drinking behavior. Campus organizations (N = 20) containing 1,162 college students were randomly assigned to intervention or assessment-only control conditions. Participants in the intervention condition attended an intervention during their organization’s regular standing meeting. Data were gathered in vivo using computerized handheld keypads into which participants entered personal responses to a series of alcohol-related questions assessing perceptions of normative group behavior as well as actual individual behavior. These data were then immediately presented in graphical form to illustrate discrepancies between perceived and actual behavioral group norms. Results indicated that compared with the control group, the intervention group reduced drinking behavior and misperceptions of group norms at 1-month and 2-month follow-ups. Changes in perceived norms mediated the reductions in drinking. Results demonstrate the effectiveness of a novel, technologically advanced, group-based, brief alcohol intervention that can be implemented with entire groups at relatively low cost.
Keywords: normative feedback, misperceptions, intervention, alcohol behavior, handheld keypads
In response to the multitude of negative consequences resulting from heavy drinking (Hingson, Heeren, Winter, & Wechsler, 2005; Wechsler, Lee, Kuo, & Lee, 2000), many college campuses in the United States have initiated individual and group-based interventions with student drinkers (Larimer, Cronce, Lee, & Kilmer, 2004). Recently, interventions that seek to correct students’ misperceptions about the alcohol use of their peers have emerged. These interventions, using the social norms approach to college drinking (Perkins, 2003), appear promising and have resulted in significant reductions in heavy episodic alcohol consumption and alcohol consequences at a number of institutions across the country (e.g., DeJong et al., 2006; Neighbors, Larimer, & Lewis, 2004; Perkins & Craig, 2006).
Social influences are among the strongest and most consistent predictors of heavy drinking in the college environment (Borsari & Carey, 2003; Perkins, 2002). The social norms approach to college drinking asserts that misperceptions of how members of one’s social group think and act (incorrectly perceived norms) influence behavior (Perkins & Berkowitz, 1986). During college, peers influence alcohol use both directly (i.e., explicit suggestions to drink) and indirectly (i.e., perceived norms). Overestimations of heavy drinking may increase drinking, whereas underestimations of abstinence or moderate drinking may discourage individuals from engaging in those healthier behaviors. A recent study of college students (N = 76,145) revealed that they consistently held exaggerated misperceptions of school drinking norms, regardless of the actual school norm (Perkins, Haines, & Rice, 2005). Thus, providing normative feedback that allows students to compare their drinking and the actual drinking levels of others may influence behavior.
Selective and targeted social norms programs focus on certain at-risk groups of students. Misperceptions of proximal reference groups are more likely to influence drinking behavior than are misperceptions of distal reference groups (Borsari & Carey, 2003; Lewis & Neighbors, 2006). Thus, providing students with feedback from their specific campus or salient reference group may be the most beneficial way of providing feedback (Far & Miller, 2003). Members of fraternities and sororities are of particular concern, because Greek-affiliated students drink more heavily and more frequently than do other students (Sher, Bartholow, & Nanda, 2001). Greek students also overestimate the drinking behavior of their peers in their specific organizations (Baer, 1994) and these misperceptions influence heavy drinking (Larimer, Turner, Mallett, & Geisner, 2004). In addition to the general relationships between Greeks, misperceptions, and alcohol use, groups of students socializing and living together tend to have similar misperceptions (Bourgeois & Bowen, 2001). Because of the closeness of many fraternity and sorority members, as well as the cohabitation nature of these groups, selective prevention programs with this at-risk drinking population are necessary.
Social norms interventions, however, may be compromised and diminish in effectiveness if participants question the validity or source of the normative feedback that they are receiving (Granfield, 2002) or if the information is confusing or not interpreted as intended (Thombs, Dotterer, Olds, Sharp, & Raub, 2004). Conversely, if students believe the data are reliable, they are less likely to undermine the source of the information (Berkowitz, 2004). For many students, misperceptions may be based on long-standing attitudes and beliefs, creating reluctance to accept discrepant feedback. Using immediate feedback based on reliable data sources from salient reference group members may help ameliorate this problem.
In the current study, we implemented a cluster randomized trial design to test whether a real-time immediate normative feedback intervention with members of campus organizations would correct group-specific misperceptions of group drinking norms and subsequently produce individual reductions in drinking. The norms provided to the individuals were the norms of their immediate reference group (i.e., fraternity, sorority, or service organization) in which they received the intervention. Using an electronic wireless keypad while in their salient reference groups, students reported on their drinking and normative beliefs and immediately viewed the results of their reports. Perceived behavioral norms of the group were experimentally manipulated by providing feedback that highlighted the discrepancies between the group’s perceptions of behavior and the group’s actual drinking. We hypothesized that intervention condition participants would reduce drinking more than would control condition participants. Additionally, we hypothesized that changes in normative perceptions would mediate reductions in drinking for intervention participants and that those with greater discrepancies between their perception of the group’s behavior and the group’s actual behavior would benefit most from the intervention.
Method
Participants
A local institutional review board reviewed and approved the current study. Participants for the study were recruited from fraternities, sororities, and service organizations at a midsize western university. Service organizations, similar to Greek organizations, were composed of members who volunteered together to perform service to the university and outside communities and who participated in many activities together. In total, 1,650 students were recruited from all 20 campus organizations (6 fraternities, 7 sororities, and 7 service organizations). Of these, 1,162 students participated in the study, yielding a good rate of recruitment (70%). The 20 groups were then randomly assigned to either the intervention or the assessment-only control condition. All groups received nominal stipends (ranging from $250 to $500 depending on group size) for participation in the initial data collection phase and two follow-up data collections. In the overall sample, 148 (13%) were 18 years old, 311 (27%) were 19 years old, 374 (32%) were 20 years old, 278 (24%) were 21 or older, and 51 (4%) declined to state their age. The ethnicity of the sample was 58% Caucasian, 12% Hispanic, 6% Asian or Pacific Islander, 3% African American, 6% mixed ethnicity, 3% other, and 12% who declined to state their ethnicity. In total, 335 men and 827 women participated in the study.
Four fraternities (n = 127), four sororities (n = 329), and four service organizations (n = 147) were randomly assigned to the intervention condition of the study. These experimental groups contained 603 participants (161 [27%] men and 442 [73%] women). Two fraternities (n = 137), three sororities (n = 316), and three service organizations (n = 106) totaling 559 students (174 [31%] men and 385 [69%] women) were randomly assigned to the control condition of the study.
Design and Procedure
The study took place during spring semester 2006. The leaders of the 20 campus organizations were invited to participate in a study about alcohol use that could fulfill alcohol programming requirements for their organization. All organizations agreed to participate, and e-mail addresses of members were obtained from the leaders. Leaders were asked to inform their groups’ members that survey responses were confidential and that nothing about their individual or specific group responses would be communicated to any administrative university personnel. All participants and organizations were assigned a custom ID that was used throughout the duration of the study to track participation.
All participants in both the intervention and the control groups received the initial survey approximately 1 month into the spring semester. All interventions occurred within 2 weeks of the initial survey. Initial survey data constituted baseline for the control group, whereas the initial survey and attending the intervention session constituted baseline for the intervention group. Follow-up surveys were administered at 1 and 2 months postintervention or postbaseline and assessed changes in misperceptions and drinking. Follow-up rates from baseline were 69% at 1 month and 65% at 2 months for the intervention group and 83% at 1 month and 83% at 2 months for the control group. There were no differences on alcohol use and demographic variables between those who completed all aspects of the study and those who did not. Further, within any particular group, there were no differences on the same variables between attriters and nonattriters.
A link to the initial survey was e-mailed to every group member in the study, who then electronically consented to the study before being directed to the survey itself. The consent form contained the same assurances about confidentiality of individual and group responses that were contained in the information given to organization leaders. The survey began with an assessment of demographic variables including age, sex, class year, group membership, ethnicity, grade point average, and income.
Before answering questions about drinking behavior, participants were presented with the definition of a standard drink (defined as a drink containing one-half ounce of ethyl alcohol). Participants then responded to five series of two questions each asking about how they thought a typical member of their group drank (perceived norm) and about their own drinking behavior (actual norm). Every question assessing perceived group norms directly referenced the group to which the individual belonged (e.g., “a typical member of X sorority”). Questions assessed the frequency of drinking behavior, average quantity consumed, drinks per week, peak drinking occasion in the past 30 days, and frequency of heavy episodic drinking in the past 2 weeks (four or more drinks for women or five or more drinks for men in a 2-hr period). Table 1 contains a list of response options for each question. These five questions revealed adequate reliability for a “typical member of your group” (α =.88) and actual individual behavior (α = .93).
Table 1.
Means and Standard Deviations for Responses to Descriptive Normative Questions From the Alcohol Use Composite Variable at Baseline, 1-Month Follow-Up, and 2-Month Follow-Up
| Question | Baselinea
|
1-month follow-upb
|
2-month follow-upc
|
|||
|---|---|---|---|---|---|---|
| M | SD | M | SD | M | SD | |
| Experimental | ||||||
| 1. Frequency | 4.08 | 1.85 | 3.85d | 1.68 | 3.84e | 1.72 |
| 2. Drinks/occasion | 4.42 | 1.96 | 3.76f | 1.65 | 3.71f | 1.71 |
| 3. Drinks/week | 4.12 | 2.46 | 3.29f | 1.92 | 3.33f | 1.91 |
| 4. Peak drinks in past 30 days | 4.05 | 1.93 | 3.47f | 1.74 | 3.39f | 1.74 |
| 5. Heavy episodic events in past 2 weeks | 3.22 | 2.23 | 2.54f | 1.72 | 2.70f | 1.82 |
|
| ||||||
| Control | ||||||
| 1. Frequency | 3.92 | 1.57 | 4.15 | 1.64 | 4.01 | 1.62 |
| 2. Drinks/occasion | 3.72 | 1.64 | 3.74 | 1.67 | 3.69 | 1.57 |
| 3. Drinks/week | 3.40 | 1.96 | 3.50 | 2.00 | 3.35 | 1.89 |
| 4. Peak drinks in past 30 days | 3.41 | 1.63 | 3.49 | 1.68 | 3.32 | 1.59 |
| 5. Heavy episodic events in past 2 weeks | 2.49 | 1.69 | 2.63 | 1.68 | 2.60 | 1.68 |
Note. Question 1 responses: 1 = never–six times a year; 2 = once a month; 3 = twice a month; 4 = once a week; 5 = twice a week; 6 = three times a week; 7 = four times a week; 8 = five to six times a week; 9 = every day. Question 2 responses: 1 = none; 2 = one to two; 3 = three; 4 = four; 5 = five to six; 6 = seven to eight; 7 = nine to ten; 8 = eleven to twelve; 9 = thirteen or more. Question 3 responses: 1 = none; 2 = one to two; 3 = three to five; 4 = six to eight; 5 = nine to ten; 6 = eleven to fourteen; 7 = fifteen to eighteen; 8 = nineteen to twenty-one; 9 = twenty-two or more. Question 4 responses: 1 = none; 2 = one to three; 3 = four to six; 4 = seven to nine; 5 = ten to twelve; 6 = thirteen to fifteen; 7 = sixteen to eighteen; 8 = nineteen to twenty-one; 9 = twenty-two or more. Question 5 responses: 1 = none; 2 = one time; 3 = two times; 4 = three times; 5 = four times; 6 = five times; 7 = six times; 8 = seven to nine times; 9 = ten or more times.
Experimental group n = 603; control group n = 559.
Experimental group n = 413; control group n = 464.
Experimental group n = 394; control group n = 463.
Value is significantly different from baseline at p < .01.
Value is significantly different from baseline at p < .05.
Value is significantly different from baseline at p < .001.
For analytic parsimony and to reduce the number of tests conducted, we averaged individual responses from the five perceived norms questions (i.e., “a typical member of your group”) to form a perceived norm composite variable. Similarly, the five questions asked of individual drinking were averaged to form an alcohol use composite variable. These composite scores were calculated at baseline, 1-month follow-up, and 2-month follow-up. Table 1 contains means of the five individual responses over time.
Additionally, for these five questions, we computed five individual misperception variables by subtracting the individual’s perception of behavior for a typical member of their group from the mean of the group’s responses to the actual behavior question. Positive misperception values represent overestimation of group behavior. The five misperception variables (frequency of use, average drinks per occasion, drinks per week, maximum drinks, and heavy episodic episodes) were averaged together to form a composite misperception variable for each individual, and this was calculated at all three time points (see Table 2).
Table 2.
Means and Standard Deviations for Baseline, 1-Month Follow-Up, and 2-Month Follow-Up by Group
| Composite variables | Baselinea
|
1-month follow-upb
|
2-month follow-upc
|
|||
|---|---|---|---|---|---|---|
| M | SD | M | SD | M | SD | |
| Experimental | ||||||
| Alcohol use | 4.06 | 1.89 | 3.39 | 1.53 | 3.42 | 1.56 |
| Perceived norm | 4.59 | 1.36 | 3.83 | 1.26 | 3.77 | 1.25 |
| Misperception of group behavior | 0.54 | 0.96 | 0.44 | 0.94 | 0.36 | 1.02 |
|
| ||||||
| Control | ||||||
| Alcohol use | 3.38 | 1.49 | 3.52 | 1.54 | 3.39 | 1.46 |
| Perceived norm | 3.84 | 1.15 | 3.93 | 1.20 | 3.89 | 1.18 |
| Misperception of group behavior | 0.44 | 0.94 | 0.42 | 1.02 | 0.50 | 1.04 |
Experimental group n = 603; control group n = 559.
Experimental group n = 413; control group n = 464.
Experimental group n = 394; control group n = 463.
After the completion of the online survey, each control participant received a graphical display of general and gender-specific campus drinking norms. Thus, control participants were able to see how their own alcohol use compared with the general campus drinking norms but not with the norms of their specific organization. This information was not provided to intervention condition participants.
Normative Group Intervention
Equipment
The OptionFinder interactive polling system (Option Technologies Interactive, LLC, Orlando, FL) was used in the group intervention. It is a combination of PowerPoint-based software and wireless keypads given to individuals in group meetings. Facilitators posed questions or statements to participants and provided them with a set of response choices, all of which were projected onto a large screen. Participants entered responses that then could be immediately tallied and presented graphically. The OptionFinder system produces data on demographic and drinking questions that are equivalent to the data generated by the same questions when posed in traditional confidential surveys (LaBrie, Earleywine, Lamb, & Shelesky, 2006).
Intervention
For organizations within the intervention condition, facilitators attended a regularly scheduled group meeting of the organization. On arrival, each participant received an Option-Finder keypad. The intervention began with an introduction and a statement of purpose. The informed consent agreement previously given online was reviewed in detail and confidentiality was assured. Participants were then asked a series of questions regarding age, sex, and class year. Frequency charts were displayed immediately after each question, showing participants that the system instantly and accurately reports group’s responses. Facilitators explained how to interpret the graph. This immediate visual presentation of responses was expected to increase participants’ interest in and the believability of subsequent responses.
The immediate visual feedback option was then turned off. Participants proceeded to answer the same five descriptive questions that they answered in the initial questionnaire, for both “a typical member of your group” and for the individual’s actual behavior. The OptionFinder system saved these responses for feedback, to be delivered once all questions had been answered. After participants completed all of the questions, the graphical response pattern technology was reenabled. Prior to the feedback presentation, the facilitator led the group through a brief explanation of social norms theory and how it applies to alcohol use in the college context. The facilitator then led the group through a presentation of their data. The slides were presented with the group’s frequencies for each response item in the nonconfrontational and nonjudgmental style of motivational interviewing (Miller & Rollnick, 2002). The facilitator drew attention to discrepancies between the actual normative data (the participants’ responses) and the group’s perceived norms (e.g., “Here is what the group said you thought a typical member of your group does, and here is what your group actually does, according to your own responses”). Thus, participants were able to see how their own alcohol use compared with the alcohol use of their group-specific peers, as well as if their perceptions about others in their group were discrepant. During this comparative analysis, participants were encouraged to examine their personal perceptions and behaviors compared with the actual norms.
Follow-up surveys
Follow-up data were collected via online survey at 1 and 2 months postintervention for the intervention condition groups and post–initial survey for the control condition groups. The follow-up survey assessed the same alcohol use and perceived norms variables as were assessed in the initial survey.
Analytic strategy
We analyzed data with two strategies. We first used repeated measures analyses of variance with specific group outcomes as the unit of analysis. In these analyses, there were 12 intervention and 8 control groups for which group means were specified as the dependent variables. Next, after verifying significant change at the group level, we focused on individual-level responses. With respect to missing data, cluster-level analysis used scores based on group means at each time point and, thus, there were no missing data. For individual-level analyses, we did not impute missing values but rather used all available data for each specific analysis. Thus, discrepancies in degrees of freedom for individual-level analyses reflect missing data. For those in the intervention condition, only those who were actually exposed to the intervention were included in analyses of follow-up data. For individual-level analyses, data were hierarchically structured at three levels. Individuals were nested within groups that were in turn nested within organization types (Greek or service organizations). Primary analyses were conducted using multilevel random coefficients modeling using the PROC MIXED routine in SAS (Littell, Milliken, Stroup, & Wolfinger, 1996; Singer, 1998). Parameter estimates were based on maximum likelihood estimation. The PROC MIXED routine in SAS is equivalent to other hierarchical linear modeling techniques (e.g., Raudenbush & Bryk, 2002) with the exception that PROC MIXED simultaneously estimates parameters in a single equation that combines equations for multiple levels. Moreover, primary analyses were conducted using three-level models (Raudenbush & Bryk, 2002). Individual responses at follow-up were modeled as a function of individual responses at baseline at Level 1, group effects at Level 2, and organization effects at Level 3. It should be noted that although this approach accounts for clustering by groups and organization type, it does not directly account for the fact that randomization was by group rather than by individual, and results must be interpreted in this context. Primary analyses involved evaluating intervention efficacy on drinking; evaluating intervention effects on perceived norms; testing perceived norms as a mediator of intervention efficacy; and, finally, testing baseline discrepancies in perceived norms as moderators of intervention effect. Sex and intervention were dummy coded (men = 1; group intervention = 1).
Results
Baseline Differences in Alcohol Use and Perceived Norms Composites
Although there were no differences between means at the cluster level (intervention n = 12, control n = 8), at the individual level there were differences in baseline alcohol use and perceived norms composite variables between intervention and control participants, t(1156) = 6.66, p < .001, and t(1154) = 6.54, p < .001, respectively. Intervention participants drank more and had higher perceived norms for their group than did control participants. There were no differences in the amount of misperception between conditions. Means and standard deviations are contained in Table 2.
Cluster-Level Repeated-Measures Analyses of Variance
Changes in drinking
We used repeated-measures analyses of variance to evaluate changes in specific group drinking means (12 intervention groups vs. 8 control groups) across baseline, 1-month follow-up, and 2-month follow-up. Results revealed overall reductions in drinking over time, F(2, 17) = 9.21, p < .01, d = 1.47. More important, results indicated a Time × Intervention interaction, suggesting larger reductions in drinking in the intervention groups relative to the control groups, F(2, 17) = 16.18, p < .001, d = 1.95. Intervention groups reduced their drinking composite means relative to baseline by 17.5% and 14.7% at 1- and 2-month follow-ups, respectively. In contrast, control group means increased slightly at both follow-up points.
Changes in norms
We used similar analyses to examine changes in norms across the time points. Results again revealed overall reductions in perceived group norm means over time, F(2, 17) = 34.85, p < .001, d = 2.86. Further, results indicated a Time × Intervention interaction, suggesting larger reductions in the intervention groups relative to the control groups, F(2, 17) = 32.39, p < .001, d = 2.76. Intervention groups reduced their perceived norms composite means relative to baseline by 18.7% and 19.1% at 1- and 2-month follow-ups, respectively. In contrast, control group means did not change more than 1% at either follow-up.
Individual-Level Analyses Accounting for Hierarchical Structure
Changes in drinking
Results of tests of coefficients for random effects revealed relatively little and nonsignificant within-group variance. Examination of intracluster correlation coefficents revealed that 16% of the variance in individual drinking at 1 month follow-up was accounted for by organization type, and an additional 5% was accounted for by the specific group of which they were a member. Similarly, 11% and 8% of the variance in drinking at 2-month follow-up were explained by organization type and specific group, respectively. The results of tests of fixed effects are presented in Table 3. Results revealed that baseline drinking was strongly associated with follow-up drinking 1 month and 2 months postintervention. Members of Greek organizations drank more than did service organization members at both follow-up time points. Men and women did not differ with respect to postintervention drinking after controlling for baseline differences. After controlling for baseline drinking, we found that participants in the intervention condition drank significantly less at both follow-up assessments in comparison to those in the control condition. Thus, the intervention was effective in reducing drinking, with effect sizes in the small to medium range.
Table 3.
MRCM Results for 1-Month Follow-Up Drinking, 2-Month Follow-Up Drinking, 1-Month Follow-Up Norms, and 2-Month Follow-Up Norms
| Predictor | Est. | SE | t | p | d |
|---|---|---|---|---|---|
| 1-month follow-up drinking (n = 877; df = 845) | |||||
| Baseline drinking | 0.72 | .02 | 36.33 | <.001 | 2.50 |
| Organization | 0.24 | .11 | 2.16 | <.05 | 0.15 |
| Sex | 0.09 | .10 | 0.85 | .39 | |
| Intervention | −0.50 | .10 | −4.98 | <.001 | 0.34 |
|
| |||||
| 2-month follow-up drinking (n = 857; df = 827) | |||||
| Baseline drinking | 0.69 | .02 | 31.67 | <.001 | 2.20 |
| Organization | 0.25 | .10 | 2.47 | <.05 | 0.17 |
| Sex | 0.02 | .09 | .17 | .86 | |
| Intervention | −0.34 | .09 | −3.76 | <.001 | 0.26 |
|
| |||||
| 1-month perceived norms (n = 877; df = 846) | |||||
| Baseline perceived norms | 0.49 | .29 | 16.68 | <.001 | 1.15 |
| Organization | 0.43 | .07 | 5.92 | <.001 | 0.41 |
| Sex | 0.24 | .07 | 3.66 | <.001 | 0.25 |
| Intervention | −0.34 | .06 | −5.77 | <.001 | 0.40 |
|
| |||||
| 2-month perceived norms (n = 857; df = 845) | |||||
| Baseline perceived norms | 0.48 | .03 | 16.86 | <.001 | 1.16 |
| Organization | 0.76 | .16 | 4.76 | <.001 | 0.33 |
| Sex | 0.30 | .13 | 2.29 | <.05 | 0.16 |
| Intervention | −0.42 | .15 | −2.83 | <.01 | 0.19 |
Note. MCRM = multilevel random coefficients modeling; Est. = parameter estimate.
Changes in norms
Results for analyses examining changes in perceived norms paralleled those for changes in drinking (see Table 3). According to the intracluster correlation coefficients, 11% and 2% of the variance in norms at 1-month follow-up were accounted for by organization type and specific group, respectively. These values were 6% and 2% at 2-month follow-up. Test of random effects indicated significant variability in within-group variance at 1-month follow-up, z = 2.14, p < .05. All other tests of random effects were nonsignificant. Baseline norms were strongly associated with norms at both follow-up points. Further, both organization type and sex significantly predicted norms at the two follow-up assessments, with Greek members and men reporting higher norms. After controlling for baseline norms, we found that participants in the intervention condition significantly reduced their perceptions of group drinking norms in comparison to those in the control condition. Intervention effects were again in the small to medium range.
Perceived norms as a mediator of intervention efficacy
The study design included three assessment points: baseline (Time 1), 1-month follow-up (Time 2), and 2-month follow-up (Time 3). We evaluated changes in perceived norms between Time 1 and Time 2 as a mediator of changes in drinking between Time 1 and Time 3. Documentation of mediation requires demonstration of an intervention effect on drinking, an intervention effect on norms, a significant relationship between changes in norms and changes in drinking, and removal or significant reduction in the intervention effect on changes in drinking at Time 2 while controlling for perceived norms (Baron & Kenny, 1986; MacKinnon & Dwyer, 1993). Results described above and contained in Table 3 provide support for the first two of these criteria. To evaluate the latter two criteria, we created change scores for perceived norms by subtracting Time 1 perceived norms from Time 2 perceived norms. Positive change scores indicated increases in perceived norms, whereas negative change scores indicated decreases in perceived norms. Following the analytic strategy described above, we specified a three-level multilevel random coefficients model evaluating Time 3 drinking as a function of Time 1 drinking, organization, sex, intervention, and changes in perceived norms. Results showed a strong effect for changes in norms on drinking, t(742) = 7.83, p < .001, d = 0.57, whereas the intervention effect was no longer significant. Thus, changes in perceived norms at Time 2 mediated the intervention effect on drinking at Time 3.
Moderation analyses
We examined baseline discrepancies in perceived norms as a moderator. The interaction between discrepancy in perceived norms and intervention was significant at both 1-month follow-up, t(843) = −3.64, p < .001, d = 0.25, and 2-month follow-up, t(824) = −3.58, p < .001, d = 0.25. Figure 1 presents predicted values derived from parameter estimates where high and low values for discrepancies were specified as being one standard deviation above and below the mean, respectively (Aiken & West, 1991; Cohen, Cohen, West, & Aiken, 2001). The intervention effect was stronger for those with higher discrepancies in perceived norms at baseline.
Figure 1.
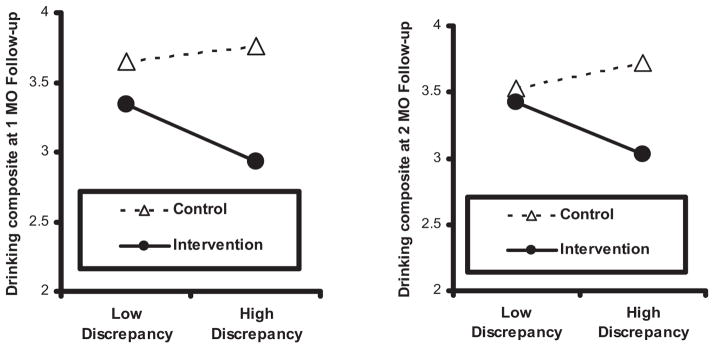
Moderation of intervention efficacy by discrepancy between perceived behavior and real behavior of group.
Discussion
The present research extends previous work in applying social norms theory in intervention strategies designed to reduce alcohol consumption among college students. This study is the first of which we are aware to provide immediate group-specific norms derived interactively from in-person participants. Intervention participants were present and active in the documentation of norms specific to their group, which likely reduced skepticism regarding the accuracy of the norms presented to them in the intervention. Results of this study demonstrate the efficacy of group-specific norms feedback in reducing group-specific normative misperceptions and subsequent drinking. Moreover, results were consistent at both individual and group levels of analysis. Consistent with the theory underlying social norms interventions, results also demonstrate that this approach appears to be most effective among students who start out with large group-specific normative misperceptions and that reductions in misperceptions mediate actual changes in drinking.
It is important to note that the control group in this study was an active control that received information regarding general campus norms, which has been shown in some research to be effective (DeJong et al., 2006; Neighbors et al., 2004; Neighbors, Lewis, Bergstrom, & Larimer, 2006; Perkins & Craig, 2006). Thus, results from this study provide a demonstration of the value of group-specific relative to nonspecific norms information. It is also worth noting that in comparison to the active control group used in this study, effect sizes for group-specific norms feedback were comparable to other, often more comprehensive, individually delivered interventions that have demonstrated efficacy in the college student population (Larimer, Cronce, et al., 2004; Walters & Neighbors, 2005). In contrast, effect sizes at the group level of analyses were considerably larger and underscore the importance of considering change at multiple levels of analyses in clustered randomized trials (Campbell, 2004).
The results of this research must be viewed in light of a number of limitations, some of which suggesting future avenues worthy of exploration. First, baseline assessments in the control group were administered online, whereas baseline assessments in the intervention group were administered in a live setting. It is not clear whether or how the presence of others may have differentially influenced perceived norms or self-reported drinking behavior. Further, although we did evaluate changes in perceived norms and drinking at the group level of analysis, clustered randomization of only 20 groups is a limitation. The differences between intervention and control conditions on baseline measures suggest that random assignment of only 20 groups did not effectively eliminate baseline differences in drinking at the group level. That is, groups randomized to the intervention condition consisted of somewhat heavier drinkers. Although baseline drinking was statistically controlled for, an alternative and stronger design would have been to randomly select members of each group and randomly assign half of them to intervention and half to control. However, this would perhaps not place individuals in groups with their most salient peers and participants may argue that the data are not accurate. For example, if only half of an organization attended the in group intervention, perhaps group members would argue that the feed-back is skewed because all of the heavier drinkers were allocated to the control condition. A related limitation is that although the multilevel analyses account for clustering by group and organization, they do not account for randomization being at the group rather than the individual level, and results must be interpreted in this context. Because random assignment occurred for groups and every member of intervention groups received the same intervention together at the same time, this may have resulted in less variability among individuals due to the intervention effect. Finally, although analyses revealed that attriters and nonattriters of the study did not differ on multiple variables, the study contains a relatively low completion rate (an average of 75% completed both follow-ups).
Two types of groups (fraternities/sororities and service organizations), consisting primarily of women, participated in the study. These may or may not be representative of the range of groups to which college students belong. Moreover, most individuals are members of multiple groups and their levels of investment and identification may vary across groups and over time. Future research is needed to directly evaluate whether group-specific normative feedback might vary as a function of how important the group is to the individual when the intervention is being implemented. Finally, although this study introduced a novel and innovative intervention, the 2-month follow-up period was relatively brief and the long-term impact of the intervention cannot be determined.
In summary, this research describes a promising and novel group-based brief alcohol intervention and presents preliminary efficacy data. It demonstrates the utilization of novel technology in developing an effective intervention that can be implemented with entire groups at relatively low costs. More generally, the results of this and other recent studies (DeJong et al., 2006; Neighbors et al., 2004; Neighbors, Lewis, et al., 2006) support the overall effectiveness of the social norms approach and highlight the importance of determining which types of social norms interventions are most effective for whom and under what conditions.
Acknowledgments
This research was funded by a grant from the Alcoholic Beverage Medical Research Foundation and Grant U18 AA015451-01 from the National Institute of Alcohol Abuse and Alcoholism.
Contributor Information
Joseph W. LaBrie, Loyola Marymount University
Justin F. Hummer, Loyola Marymount University
Clayton Neighbors, University of Washington.
Eric R. Pedersen, Loyola Marymount University
References
- Aiken LS, West SG. Multiple regression: Testing and interpreting interactions. Thousand Oaks, CA: Sage; 1991. [Google Scholar]
- Baer JS. Effects of college residence on perceived norms for alcohol consumption: An examination of the first year in college. Psychology of Addictive Behaviors. 1994;8:43–50. [Google Scholar]
- Baron RM, Kenny DA. The moderator–mediator variable distinction in social psychological research: Conceptual, strategic, and statistical considerations. Journal of Personality and Social Psychology. 1986;51:1173–1182. doi: 10.1037//0022-3514.51.6.1173. [DOI] [PubMed] [Google Scholar]
- Berkowitz AD. The social norms approach: Theory, research, and annotated bibliography. 2004 Retrieved September 2005 from http://www.edc.org/hec/socialnorms/theory.html.
- Borsari B, Carey KB. Descriptive and injunctive norms in college drinking: A meta-analytic integration. Journal of Studies on Alcohol. 2003;64:331–341. doi: 10.15288/jsa.2003.64.331. [DOI] [PMC free article] [PubMed] [Google Scholar]
- Bourgeois MJ, Bowen A. Self-organization of alcohol-related attitudes and beliefs in a campus housing complex: An initial investigation. Health Psychology. 2001;20:434– 437. [PubMed] [Google Scholar]
- Campbell M. Extending CONSORT to include cluster trials. British Journal of Medicine. 2004;328:654– 655. doi: 10.1136/bmj.328.7441.654. [DOI] [PMC free article] [PubMed] [Google Scholar]
- Cohen J, Cohen P, West SG, Aiken LS. Applied multiple regression/correlation analysis for the behavioral sciences. Hillsdale, NJ: Erlbaum; 2001. [Google Scholar]
- DeJong W, Schneider SK, Towvim LG, Murphy MJ, Doerr EE, Simonsen NR, et al. A multisite randomized trial of social norms marketing campaigns to reduce college student drinking. Journal of Studies on Alcohol. 2006;67:868– 879. doi: 10.15288/jsa.2006.67.868. [DOI] [PubMed] [Google Scholar]
- Far J, Miller J. The small group norms-challenging model: Social norms interventions with targeted high-risk groups. In: Perkins HW, editor. The social norms approach to preventing school and college age substance abuse: A handbook for educators, counselors, and clinicians. San Francisco: Jossey-Bass; 2003. pp. 111–132. [Google Scholar]
- Granfield R. Believe it or not: Examining to the emergence of new drinking norms in college. Journal of Alcohol and Drug Education. 2002;47:18–31. [Google Scholar]
- Hingson R, Heeren T, Winter M, Wechsler H. Magnitude of alcohol-related mortality and morbidity among U.S. college students ages 18 –24: Changes from 1998 to 2001. Annual Review of Public Health. 2005;26:259–279. doi: 10.1146/annurev.publhealth.26.021304.144652. [DOI] [PubMed] [Google Scholar]
- LaBrie JW, Earleywine ME, Lamb T, Shelesky K. Comparing electronic-keypad responses to paper-and-pencil questionnaires in group assessments of alcohol consumption and related attitudes. Addictive Behaviors. 2006;31:2334–2338. doi: 10.1016/j.addbeh.2006.03.004. [DOI] [PMC free article] [PubMed] [Google Scholar]
- Larimer ME, Cronce JM, Lee CM, Kilmer JR. Brief intervention in college settings. Alcohol Research and Health. 2004;28:94–104. [PMC free article] [PubMed] [Google Scholar]
- Larimer ME, Turner AP, Mallett KA, Geisner IM. Predicting drinking behavior and alcohol-related problems among fraternity and sorority members: Examining the role of descriptive and injunctive norms. Psychology of Addictive Behaviors. 2004;18:203–212. doi: 10.1037/0893-164X.18.3.203. [DOI] [PMC free article] [PubMed] [Google Scholar]
- Lewis MA, Neighbors C. Social norms approaches using descriptive drinking norms education: A review of the research on personalized normative feedback. Journal of American College Health. 2006;54:213–218. doi: 10.3200/JACH.54.4.213-218. [DOI] [PMC free article] [PubMed] [Google Scholar]
- Littell RC, Milliken GA, Stroup WW, Wolfinger RD. SAS system for mixed models. Cary, NC: SAS Institute; 1996. [Google Scholar]
- MacKinnon DP, Dwyer JH. Estimating mediated effects in prevention studies. Evaluation Review. 1993;17:144–158. [Google Scholar]
- Miller WR, Rollnick S. Motivational interviewing: Preparing people for change. 2. New York: Guilford Press; 2002. [Google Scholar]
- Neighbors C, Larimer ME, Lewis MA. Targeting misperceptions of descriptive drinking norms: Efficacy of a computer delivered personalized normative feedback intervention. Journal of Consulting and Clinical Psychology. 2004;72:434– 447. doi: 10.1037/0022-006X.72.3.434. [DOI] [PubMed] [Google Scholar]
- Neighbors C, Lewis MA, Bergstrom RL, Larimer ME. Being controlled by normative influences: Self-determination as a moderator of a normative feedback alcohol intervention. Health Psychology. 2006;25:571–579. doi: 10.1037/0278-6133.25.5.571. [DOI] [PMC free article] [PubMed] [Google Scholar]
- Perkins HW. Social norms and the prevention of alcohol misuse in collegiate contexts. Journal of Studies on Alcohol, Suppl. 2002;14:164–172. doi: 10.15288/jsas.2002.s14.164. [DOI] [PubMed] [Google Scholar]
- Perkins HW, editor. The social norms approach to preventing school and college age substance abuse: A handbook for educators, counselors, and clinicians. San Francisco: Jossey-Bass; 2003. [Google Scholar]
- Perkins HW, Berkowitz AD. Perceiving the community norms of alcohol use among students: Some research implications for campus alcohol education programming. International Journal of the Addictions. 1986;21:961–976. doi: 10.3109/10826088609077249. [DOI] [PubMed] [Google Scholar]
- Perkins HW, Craig DA. A successful social norms campaign to reduce alcohol misuse among college student-athletes. Journal of Studies on Alcohol. 2006;67:880– 889. doi: 10.15288/jsa.2006.67.880. [DOI] [PubMed] [Google Scholar]
- Perkins HW, Haines MP, Rice R. Misperceiving the college drinking norm and related problems: A nationwide study of exposure to prevention information, perceived norms and student alcohol misuse. Journal of Studies on Alcohol. 2005;66:470– 478. doi: 10.15288/jsa.2005.66.470. [DOI] [PubMed] [Google Scholar]
- Raudenbush SW, Bryk AS. Hierarchical linear models. 2. Thousand Oaks: Sage; 2002. [Google Scholar]
- Sher KJ, Bartholow BD, Nanda S. Short and long-term effects of fraternity and sorority membership on heavy drinking: A social norms perspective. Psychology of Addictive Behaviors. 2001;15:42–51. doi: 10.1037/0893-164x.15.1.42. [DOI] [PubMed] [Google Scholar]
- Singer JD. Using SAS PROC MIXED to fit multilevel models, hierarchical models, and individual growth models. Journal of Educational and Behavioral Statistics. 1998;23:323–355. [Google Scholar]
- Thombs DL, Dotterer S, Olds R, Sharp KE, Raub CG. A close look at why one social norms campaign did not reduce student drinking. Journal of American College Health. 2004;53:61– 68. doi: 10.3200/JACH.53.2.61-70. [DOI] [PubMed] [Google Scholar]
- Walters ST, Neighbors C. Feedback interventions for college alcohol misuse: What, why, and for whom? Addictive Behaviors. 2005;30:1168–1182. doi: 10.1016/j.addbeh.2004.12.005. [DOI] [PMC free article] [PubMed] [Google Scholar]
- Wechsler H, Lee J, Kuo M, Lee H. College binge drinking in the 1990s: A continuing problem. Journal of American College Health. 2000;48:199–210. doi: 10.1080/07448480009599305. [DOI] [PubMed] [Google Scholar]