

Abstract
Background
As with other interventions for major depressive disorder (MDD), cognitive therapy (CT) results in treatment failure for about half of all participants. In 2007, Coffman and colleagues in Seattle studied this topic by identifying a group of patients who demonstrated an extremely poor response to CT (i.e. post-treatment BDI score ≥ 31). They called these patients “extreme non-responders” (ENR) and described the pre-treatment characteristics that predicted response status.
Methods
In the current study, we attempt a replication of the Seattle study with a larger sample of adults with recurrent MDD (N=473) who received a 16–20 session (12–14 week) course of CT.
Results
The rate of ENR in this large sample was only 6.3% (30/473), compared to 22.2% (10/45) in the Seattle sample. Four pre-treatment measures of symptom severity and functioning differed significantly among ENR and non-ENR participants. In each case, higher symptoms or poorer functioning were associated with ENR status. However, the combination of these factors in a regression model did not predict actual ENR status with the high degree of sensitivity or specificity observed in the Seattle study.
Conclusions
These findings suggest that extreme non-response to cognitive therapy is not as common as previously described and, although poor outcomes are associated with pre-treatment clinical status, it is difficult to predict post-treatment symptom severity with a high degree of accuracy across different research samples.
Keywords: cognitive therapy (CT), major depressive disorder (MDD), non-response, predictors of response
Introduction
Cognitive therapy (CT) is the most extensively studied psychological treatment for major depressive disorder (Butler, Chapman, Forman, & Beck, 2006) and evidence from randomized controlled trials suggests that its efficacy is comparable to that of antidepressant medications across 12–16 weeks of acute-phase treatment (DeRubeis, Gelfand, Tang, & Simons, 1999; DeRubeis et al., 2005; Roth & Fonagy, 1996). Like all acute-phase interventions for major depression, however, cognitive therapy is far from universally effective. Approximately 40% to 50% of patients will not respond to a standard 12–16 week course of CT for depression, eventually requiring the initiation of a second treatment step such as a switch to, or addition of, an antidepressant medication (Schulberg, Pilkonis, & Houck, 1998). Given the time, expense, and morbidity associated with failed treatment trials, the identification of “prognostic factors” that predict successful treatment (preferably before treatment is started) is an important and clinically-relevant area of research. This is particularly true within the field of cognitive therapy, given the mismatch between high demand for the intervention and the relative scarcity of available providers (Shafran et al., 2009). As such, the early identification of individuals who are likely to benefit from this model of psychotherapy is advantageous not only for patients in treatment, but also for future clients who are waiting to utilize the services of cognitive therapists. This issue is particularly relevant from a public health perspective, since depression is one of the world’s greatest public health concerns and is a leading cause of disability (Whiteford et al., 2013).
In a 2007 manuscript, Coffman and colleagues at the University of Washington in Seattle (Coffman, Martell, Dimidjian, Gallop, & Hollon, 2007) identified a pre-treatment clinical profile associated with “extreme non-response” to acute-phase cognitive therapy for depression. In their research sample (N=45), Coffman and colleagues found that depressed patients who ended cognitive therapy with Beck Depression Inventory (BDI) scores of 31 or higher—roughly analogous to the “severe” depression category originally defined by Beck et al. (A. T. Beck, Ward, Mendelson, Mock, & Erbaugh, 1961)—had higher pre-treatment depressive symptoms and poorer levels of interpersonal and global functioning prior to the onset of treatment. Furthermore, the Seattle group found that a multivariate combination of four specific pre-treatment variables—greater symptom scores on the BDI, the Hamilton Rating Scale for Depression, the Global Assessment of Functioning, and a measure of interpersonal problem severity—accurately identified 90% of individuals in the “extreme non-response” (ENR) category.
If replicable, the ENR construct would have important clinical implications. Perhaps most importantly, Coffman and colleagues (2007) did not find a subgroup of extreme non-responders in the other psychosocial treatment group (i.e. Behavioral Activation) evaluated in their study, which might suggest that the characteristics that identified ENR patients have uniquely ominous implications for cognitive therapy response. Furthermore, as there are few replicable pre-treatment predictors of differential response to psychosocial interventions for depression, this would be a useful development that could enable clinicians to identify patients who are unlikely to benefit from Beck’s model of therapy and might have a better chance of responding to an alternate intervention (e.g. Behavioral Activation or antidepressant pharmacotherapy).
In an effort to gain a better understanding of the phenomenon of extreme non-response to cognitive therapy, we attempted to replicate the findings of the Seattle group in a much larger cohort of depressed outpatients (N=473) treated with a standard 12–14 week acute course of cognitive therapy. Although our study did not include an active comparison group, such a replication would afford the opportunity to ascertain if a pattern of extreme non-response did exist within this larger group of depressed outpatients and, if so, if these individuals had similar pre-treatment characteristics to extreme non-responders in the Seattle study. In addition, we explored other ways to classify extreme non-response to cognitive therapy, as well as the pre-treatment measures that may help to predict it.
Material and methods
Summary of the C-CT-RP Trial (parent study)
This report is a secondary analysis of data from the Continuation Phase Cognitive Therapy Relapse Prevention [C-CT-RP] Trial, which is registered at ClinicalTrials.gov (NCT00118404, NCT00183664, and NCT00218764) (Jarrett & Thase, 2010). The purpose of the C-CT-RP trial was to evaluate the efficacy and durability of continuation phase CT for prophylaxis against MDD relapse, and consisted of two phases: an initial 12–14 week “acute-phase” of CT for adult outpatients with recurrent Major Depressive Disorder (MDD), followed by an 8-month “continuation-phase” of CT for participants considered to be at high risk for MDD relapse. For the current report, results from only the “acute-phase” of the study were examined, and the results of the continuation-phase (main outcomes) of the study are reported elsewhere (Jarrett, Minhajuddin, Gershenfeld, Friedman, & Thase, 2013).
Participant Recruitment and Inclusion/Exclusion Criteria
The C-CT-RP protocol was approved by the institutional review boards of the University of Texas Southwestern Medical Center and the University of Pittsburgh Medical Center, and all participants provided informed consent for evaluation and treatment. Outpatient male and female subjects, aged 18 to 70, were recruited from clinical referrals and advertisements between January 3, 2000 and July 30, 2008. Recruitment methods included project promotion through IRB-approved advertisements on the internet and in newspapers, churches, hospitals, clinics, and other community settings. Patients were eligible to participate if they (1) presented with a principal diagnosis of recurrent MDD, as diagnosed by the Structured Clinical Interview for DSM-IV, (2) remitted between depressive episodes or had antecedent dysthymic disorder, and (3) scored 141 or higher on the 17-item Hamilton Rating Scale for Depression (HRSD-17) (Hamilton, 1960) at both an initial diagnostic evaluation and a second, confirmatory interview. Participants taking psychotropic medication were withdrawn from their medication under the supervision of a physician, and had to be un-medicated for at least one week prior to starting CT. Patients were not paid for participation in therapy.
Excluded patients: (a) had severe or poorly controlled concurrent medical disorders that could cause depression or required medication that may cause depressive symptoms; (b) suffered from the following concurrent DSM-IV psychiatric disorders: any psychotic or organic mental disorder, bipolar disorder, active alcohol or drug dependence, primary (i.e., predominant) obsessive compulsive disorder or eating disorders; (c) could not complete questionnaires written in English; (d) were an active suicide risk; (e) had previously not responded to a trial of at least 8 weeks of CT conducted by a certified therapist; (f) had previously not responded to at least 6 weeks of 40 mg of fluoxetine; (g) were pregnant or planned to become pregnant during the first 11 months after intake; or (h) did not provide informed consent. Physical examination and appropriate laboratory tests were obtained, when necessary, to ensure that participants were diagnostically eligible. Excluded patients, including those with active suicide risk, were referred for non-protocol treatment (e.g., hospitalization and/or pharmacotherapy). Subjects who had previously not responded to fluoxetine were excluded from the C-CT-RP protocol due to the design of the placebo-controlled continuation-phase of the study, which randomized participants to C-CT, fluoxetine, or pill placebo for maintenance treatment of recurrent MDD.
A total of 1359 outpatients began a two session diagnostic evaluation by trained research staff (with diagnoses confirmed by a doctoral level evaluator). At the initial diagnostic evaluation, participant demographics, Structured Clinical Interview for DSM-IV, and symptom severity measures (Hamilton Rating Scale for Depression – HRSD, Global Assessment of Functioning – GAF, Beck Depression Inventory – BDI) were collected (Jarrett & Thase, 2010). At a follow-up diagnostic evaluation, prior to starting treatment with CT, the Inventory of Interpersonal Problems was collected, and the HRSD-17 was repeated to ensure that participants continued to meet eligibility criteria. Of the 1359 individuals who participated in the two-step diagnostic evaluation, 523 provided informed consent, were eligible for study participation, and began acute-phase CT. In order to minimize bias related to participant dropout, the analyses reported in this manuscript utilize a modified intent to treat (mITT) strategy, wherein all participants who attended at least one acute-phase CT session and one subsequent follow-up (assessment) session were included in the analyses2. Four-hundred eighty-seven participants met mITT criteria, of whom 473 were included in the current analyses3.
Treatment protocol: cognitive therapy and psychoeducational visits
Each participant’s medical history was reviewed and, if clinically indicated, a physical examination and appropriate laboratory tests were obtained to ensure that a participant was eligible for the study. All psychotropic medications were discontinued, so that participants would be un-medicated for at least 1 week prior to beginning CT. Participants then began treatment with acute-phase CT, which included a 12–14 week, 16–20 session course of cognitive therapy.
Therapists delivered acute-phase cognitive therapy using classic techniques described by Aaron Beck (Aaron T. Beck, 1979). The protocol consisted of 16 to 20 individual, videotaped sessions, each lasting 50 to 60 minutes; therapy was provided over 12 weeks, with up to 2 additional weeks permitted to accommodate scheduling needs. Sessions were initially held twice per week for 4 weeks. Thereafter, participants who obtained a 40% or greater reduction on the HRSD-17 began weekly sessions, whereas the remainder continued twice-weekly sessions for four more weeks before beginning weekly sessions. The purpose of this design—which allocated more CT sessions to individuals with slower improvement—was to maximize the likelihood of response and subsequent participation in the placebo-controlled continuation phase of the study. In addition to receiving CT, participants attended psychoeducational sessions before CT began and again within 7 days of completing CT Session #11 (Jarrett & Thase, 2010). The purpose of these visits was to: (a) provide factual information about the risk of relapse/recurrence in MDD, (b) review the “road map” of treatment provided in the study, (c) verify continued consent for participation, and (d) collect self-report questionnaires.
Therapist characteristics, training, and monitoring
Sixteen cognitive therapists participated in the C-CT-RP Trial—at the Dallas site, all therapists had PhDs; at the Pittsburgh site, three had PhDs, one had an MD, and four had Master’s degrees. Participants were assigned to therapists based on geographic convenience and therapist availability. Before treating protocol patients, each therapist completed at least 1 year of supervised CT training and was required to demonstrate proficiency in cognitive therapy as defined by the site supervisors’ judgment and by maintaining Cognitive Therapy Scale (CTS) scores above 39 over time (Vallis, Shaw, & Dobson, 1986).
Experienced faculty led weekly group supervision sessions at each site and provided individual case consultation as needed. Session videotapes were selected at random for review, in a rotating fashion, such that each therapist was provided with an equal opportunity to receive feedback in group supervision. The CTS was completed by therapy supervisors and their teams to provide feedback to therapists and to assess their competence. The CTS was completed randomly based on active patients and for inter-site ratings, and only 7.2% (24/334) of ratings fell below 40. Analysis of variance showed that mean (SD) CTS ratings did not differ by site. Dr. Jarrett attended supervision at the Dallas site and was available to therapists at both sites as needed. Sander Kornblith, Ph.D. served as the on-site CT supervisor for Pittsburgh. The Principal Investigators and the DSMB monitored the quality of CTS scores across sites and time.
Independent evaluator training and calibration
To maintain a high level of diagnostic reliability within and across sites, evaluators (i.e., diagnostic evaluators, blinded evaluators, and cognitive therapists) participated in formal training on use of the SCID-I(First, Spitzer, Gibbon, & Williams, 1996). This training consisted of observing and being observed by highly reliable and experienced evaluators until the trainee achieved agreement with ratings, history of illness descriptors, and DSM-IV diagnoses. After evaluators were trained, the sites completed inter- and intra-site reliability studies on DSM-IV Current Major Depressive Disorder (MDD) diagnoses and the Hamilton Rating Scale for Depression (HRSD-17). The reliability sessions occurred regularly for the duration of the study. Videotapes were randomly selected from blinded evaluations or treatment sessions, and evaluators on the videotapes were rotated. During each reliability session, evaluators rated two videotapes (one from each site) in groups, and discrepant ratings were discussed. If an evaluator’s score on the HRSD-17 differed by 4 or more points from the group mean, additional training was provided to allow his or her ratings to converge with those of the group, including those of the senior diagnosticians. Intra-class correlation coefficients for the HRSD-17 and DSM-IV Current MDD diagnosis were calculated within and across the two sites. Inter-rater reliability for diagnoses of major depressive episodes was moderate. Based on a sample of 41 patients rated by 3 to 21 clinicians each, the median kappa of all pair-wise comparisons was 0.48. However, uncorrected percentage agreement among raters was 91%.
Measures
Demographics
Participant demographics (e.g., gender, age, sex, marital status, employment, education) were collected during the diagnostic evaluation using a self-report form.
Diagnosis
The Current Major Depressive Disorder (MDE) section of the Structured Clinical Interview (SCID) for DSM-IV was administered at the diagnostic evaluation, and once during Weeks 4, 8, and 12 of CT. Details of past depressive episodes and MDE sub-typing for the current episode (e.g. recurrent and atypical) were recorded on the “MDE Specifiers and Past MDE” section. The SCID (First et al., 1996) is a structured interview designed to assess DSM-IV criteria in a systematic fashion. Reliability between raters using the SCID-I was assessed with Fleiss’ kappa to account for chance agreement and variation in rater pairs. The overall kappa was 0.74 (p < 0.01), and kappa for MDD was 0.72 (p < 0.05) (Jarrett & Thase, 2010).
Symptom Severity
The principal symptom severity measures include the Hamilton Rating Scale for Depression (HRSD-17) (Hamilton, 1960), Global Assessment of Functioning (GAF), and the Beck Depression Inventory (BDI). The HRSD-17 (Hamilton, 1960) is a 17-item, clinician-rated scale designed to assess the severity of depressive symptoms in patients diagnosed with MDD, with higher scores reflecting greater symptom severity. Each of the 17 items is rated by the clinician on either a 3- or 5-point scale, and the total score is determined by summing the item scores. Scores > 24 indicate severe depression, scores < 17 suggest mild symptoms, and scores < 6 suggest absence of depressive illness. With highly trained raters, the HRSD and similar depression symptom measures have been found to have good inter-rater reliability (r = 0.85). Few data exist on the internal consistency of this measure, but Schwab and colleagues found that individual items correlated with total score 0.45 to 0.78 (Schwab, Bialow, Clemmons, & Holzer, 1967). For the current sample, alpha internal consistency for the HRSD-17 was found to be acceptable (Jarrett, Minhajuddin, Kangas, et al., 2013). Regarding validity, Knesevich and colleagues (Knesevich, Biggs, Clayton, & Ziegler, 1977) found HRSD change scores to be correlated 0.68 with global change scores, and numerous studies have shown significant differences in HRSD scores of normal controls and patients with depression, supporting its criterion validity. The measure has also shown good convergent validity with other clinical self-reported depression measures (Clark & Watson, 1991). The GAF (APA, 1994) is a standardized measure of overall functioning, coded as Axis V on DSM-IV. Scores range from 1 to 100, with descriptive anchors at each 10-point interval. Depressed outpatients typically score between 40 and 65 before treatment, and 65 to 80 after responding to treatment. A high score on the GAF indicates good functioning, whereas a low score indicates poorer functioning. The GAF is highly correlated with its predecessor, the Global Assessment Scale (Endicott, Spitzer, Fleiss, & Cohen, 1976). Vatnaland and colleagues (Vatnaland, Vatnaland, Friis, & Opjordsmoen, 2007) found high inter-rate reliability between researchers who rated patients. Recent research has confirmed that frequent training and rater calibration is important to increase the reliability of GAF scores (Ramirez, Ekselius, & Ramklint, 2008). The BDI (A. T. Beck et al., 1961) is a 21-item self-reported measure designed to assess the intensity of depressive symptoms in psychiatric patients and detect depressive symptoms in normal populations. Items are rated on a 0- to 3-point scale, with higher numbers indicating greater severity. Score cut-offs are as follows: less than 10, none or minimal depression; 10–18, mild-to-moderate depression; 19–29, moderate-to-severe depression; and 30–63, severe depression. Beck and colleagues (A. Beck, Steer, & Garbin, 1988) found an average internal consistency of 0.87 (range = 0.76 to 0.95) and an average short-term (< 1 month) test-retest reliability of 0.60 (range 0.48–0.86). They also found considerable evidence supporting the validity of the BDI. Correlations between BDI scores and clinical ratings of depression in psychiatric patients ranged from 0.55 to 0.96. The BDI also has good convergent validity with the HRSD and with other self-reported depression measures (A. Beck et al., 1988). In 1996, the BDI-IA was updated to the BDI-II (Steer, Clark, Beck, & Ranieri, 1999). The original 21-item BDI (BDI-IA) was used in this protocol, though adjustments were made (as indicated) to convert BDI-IA score totals to equivalent BDI-II scores (A. T. Beck, Steer, Ball, & Ranieri, 1996). In C-CT-RP, clinicians administered the HRSD-17 and GAF, and participants completed the BDI at the initial diagnostic evaluation, the confirmatory follow-up interview, and weekly during acute phase treatment.
Interpersonal Functioning
The Social Adjustment Scale-Self-Report (SAS-SR) and the Inventory of Interpersonal Problems (IIP) were completed at one of two pre-treatment diagnostic evaluation sessions, and at Week 1 of acute phase CT. The SAS-SR (Weissman & Bothwell, 1976) is a self-reported measure of instrumental and expressive role performance. The items are rated on a 5-point scale, with higher scores indicating impairment. Mean internal consistency coefficient α of 0.74 and mean test-retest reliability of 0.80 across two different time periods have been reported (Weissman, Prusoff, Thompson, Harding, & Myers, 1978), and in the current sample mean α internal consistency for total IIP score was high (Jarrett, Minhajuddin, Kangas, et al., 2013; Renner et al., 2012). The concurrent validity of the SAS-SR has been demonstrated by Weissman and colleagues (1978), who reported significantly different scores from psychiatric patients versus community controls, as well as acute versus recovered depressed patients (Weissman & Bothwell, 1976). In addition, the SAS-SR has been found to be significantly correlated with clinical ratings such as the HRSD. The 56-item SAS-SR was used in this study. The IIP (Horowitz, Rosenberg, Baer, Ureno, & Villasenor, 1988) is a 127-item self-reported measure of distress associated with interpersonal difficulties. Respondents are presented with a list of common problems and are asked to consider if each has been present in their relationships with significant others. The level of distress associated with each problem is rated on a Likert scale from 0 (not at all distressing) to 4 (extremely distressing); higher scores signify greater levels of distress. Interpersonal problems are divided into subscales indicating difficulty with being assertive, sociable, submissive, intimate, or too responsible/controlling. Mean scores for each subscale correspond to the level of distress associated with that area and can be compared to the norms derived from non-psychiatric or psychiatric populations (Woodward, Murrell, & Bettler, 2005). Ten-week test-retest reliability for the overall mean score was 0.98 (Horowitz et al., 1988). Internal consistency for the subscales ranged from .82 to .94, and their 10-week test-retest reliability ranged from 0.80 to 0.90 (Horowitz et al., 1988). In the current sample, α internal consistency for SAS-SR total was acceptable (Jarrett, Minhajuddin, Kangas, et al., 2013). Concurrent validity of the IIP is supported by predicted associations of IIP personality categories with other assessments, such as the Symptom Checklist-90R (Barkham, Hardy, & Startup, 1994) and therapist evaluations of patient personalities (Gurtman, 1996). The IIP is also sensitive to change due to psychotherapy (Horowitz et al., 1988). Higher mean scores on the IIP reflect greater interpersonal problems.
Extreme Non-Response (ENR)
In keeping with the methods of Coffman et al. (Coffman et al., 2007), the C-CT-RP sample was stratified into ENR (final BDI score of 31 or greater) and non-ENR (final BDI score of 30 or less) groups based on scores at the end of acute-phase CT.
Calculation
Replication
We first attempted a step-by-step replication of the original Seattle study (Coffman et al., 2007) using our large sample of depressed outpatients treated with cognitive therapy. To begin, we compared the Seattle and C-CT-RP cohorts on demographic (gender, age, sex, marital status, employment, education) and clinical characteristics (pre-treatment scores on the HRSD, BDI, GAF). Categorical characteristics of the groups were summarized using means and percentages, and differences across groups were tested using two-tailed t-tests or Fisher’s exact test when appropriate. All of the measures used in the original Seattle study were also used in the C-CT-RP study, with the exception of the Seattle “Axis4-01” measure of primary support group problems (derived from Axis IV of the DSM-IV, and recorded as a binary variable with 0 = no and 1 = yes). To accommodate this difference, we examined the measures of interpersonal functioning used in the C-CT-RP study, including the IIP and SAS-SR, and created a similar binary variable from the SAS-SR to identify subjects with greater or fewer primary support group problems.
Next, a series of two-tailed t-tests was used to determine if BDI, HRSD, GAF, SAS-SR, and IIP scores of C-CT-RP participants changed significantly in response to treatment with CT. A similar method was used to determine if pre-treatment BDI, HRSD, GAF, SAS-SR, and IIP scores discriminated between ENR and non-ENR subjects within the C-CT-RP-sample. We also tested for differences across sites (Dallas vs. Pittsburgh) on these measures and on rates of ENR.
As a final step in our replication, logistic regression was used to determine if pre-treatment BDI, HRSD, GAF, and SAS-SR scores, when analyzed together, were able to predict ENR status within the C-CT-RP sample with a high degree of sensitivity and specificity. A receiver operating characteristic (ROC) curve was created to measure the fit of the logistic regression model and graphically depict the classification accuracy of the combination of the four predictors identified by Coffman et al. (2007) and constructed within the C-CT-RP sample. With a new predictive algorithm applied to the C-CT-RP sample, an effort was undertaken to compare it to the algorithm calculated by Coffman and colleagues. To accomplish this, we utilized a series of two-tailed z tests to compare the Seattle and C-CT-RP equation variables. Next, the sensitivity, specificity, positive predictive value (PPV), and negative predictive value (NPV) of the original Seattle equation for ENR status within the C-CT-RP sample was determined by including the four pre-treatment measures (BDI, GAF, HRSD severity, interpersonal functioning severity) in the Seattle equation and comparing the equation’s prediction for final ENR status with the results that were actually observed in the C-CT-RP study.
Extension
After performing a replication of the Seattle methods, we further explored the phenomenon of extreme non-response to CT by examining other ways to classify ENR and attempting to develop a new predictive algorithm for ENR based on our large sample of participants treated with acute-phase CT. We began by examining different BDI cut-off values for classifying ENR, and compared the resulting ENR rates with those of the Seattle sample using two-tailed z test. We examined how lowering the BDI cut-off for ENR and using a “percentage-improvement” definition might affect the rate of ENR within the C-CT-RP sample. We also restricted the C-CT-RP sample to examine the ENR rate for only those participants who completed the full acute phase of therapy (Jarrett & Thase, 2010). Finally, we attempted to create a new predictive algorithm for acute-phase CT response using data from C-CT-RP participants. We examined “percentage-improvement” on the BDI over the course of acute-phase CT, to provide a more conceptually and clinically-meaningful definition of response and non-response, and defined “response” to CT as a positive percentage-improvement on the BDI (pre-treatment score – post-treatment score / pre-treatment score) and non-response as zero or negative percentage-improvement on the BDI. Before attempting to create a new predictive algorithm, we used a series of two-tailed t- and z-tests to determine if pre-treatment HRSD, GAF, SAS-SR, and IIP scores discriminated between “responders” and “non-responders” using the percentage-improvement definition. Of note, the pre-treatment BDI score variable was excluded, as this variable was used to calculate the outcome of interest (BDI percentage-improvement). Box plots were also generated to examine differences in pre-treatment symptom scores among responders and non-responders.
Results
Of the 523 participants who met eligibility criteria and enrolled in the C-CT-RP protocol, 22 participants did not complete at least one CT session, and 14 participants completed one CT session but did not complete a post-therapy evaluation session—as a result, 487 participants met our modified-intent to treat (mITT) inclusion criteria. An additional 14 participants were missing scores on one or more of the pre-treatment measures of interest4 and were excluded, leaving 473 participants (“the C-CT-RP sample”) included in the following analyses. The C-CT-RP sample attended a mean of 16.7 (SD 4.2) sessions (with a protocol maximum of 20 sessions), compared with a mean of 20.0 (SD 4.9) sessions for the Seattle participants (with a protocol maximum of 24 sessions). The minimum number of A-CT sessions attended by C-CT-RP participants was 3, compared to a minimum of 13 for the Seattle sample.
The C-CT-RP sample (N=473) did not differ significantly from the Seattle sample (N=45) in gender composition, marital status, or employment status, but the C-CT-RP sample was older (C-CT-RP mean: 43.2 years, Seattle mean: 38.5 years; t = 2.51, df = 516, p < .05) (Table 1). Pre-treatment HRSD and GAF scores did not differ significantly between the C-CT-RP and Seattle samples, whereas pre-treatment Seattle BDI scores were significantly higher than pre-treatment C-CT-RP scores5 (C-CT-RP mean: 26.3 (SD 8.7), Seattle mean: 31.1 (SD 7.05), t = −3.56, df = 516, p<.001) (Table 1). Using the Seattle-defined cutoff of 31 or greater on the BDI at post-treatment, thirty participants (30/473, 6.3%) in the C-CT-RP sample met criteria for ENR, which differed significantly from the Seattle rate of 22.2% (z=−3.81, p<.001) (Figure I).
Table 1.
Clinical Characteristics of Patients in C-CT-RP and Seattle Samples
| C-CT-RP Sample (N=473) |
Seattle Sample (N=45) |
||||||||
|---|---|---|---|---|---|---|---|---|---|
| Item | N | % | Mean | SD | N | % | Mean | SD | Test of Differences |
| Age (years) | |||||||||
| Current | 473 | 43.2 | 11.9 | 45 | 38.5 | 11.6 | t = 2.51 (df=516)a | ||
| Gender | |||||||||
| Male | 154 | 32.6 | 12 | 26.7 | Fisher’s exact, p=.5D48 | ||||
| Female | 319 | 674 | 33 | 73.3 | |||||
| Marital Status | |||||||||
| Married | 159 | 33.6 | 20 | 44.4 | Fisher’s exact, p=,1886 | ||||
| Otherb | 314 | 66.4 | 25 | 55.6 | |||||
| Employment Status | |||||||||
| Employedc | 333 | 70.4 | 34 | 75.6 | Fisher’s exact, p=.6D67 | ||||
| Otherd | 140 | 29.6 | 11 | 24.4 | |||||
| Pretreatment scores | |||||||||
| HRSD | 473 | 20.2 | 4.7 | 45 | 20.0 | 3.80 | t = 0.28 (df = 516) | ||
| GAF | 473 | 54.1 | 5.9 | 45 | 52.5 | 5.21 | t = 1.78 (df = 516) | ||
| BDI | 473 | 26.3 | 8.7 | 45 | 31.1 | 7.05 | t = −3.56 (df = 516)e | ||
p < .05
Single, separated, divorced, widowed, living together
Full time, part time, homemaker, student, retired
Laid off, disabled, leave of absence, unemployed, volunteer
p < .001
Figure I.
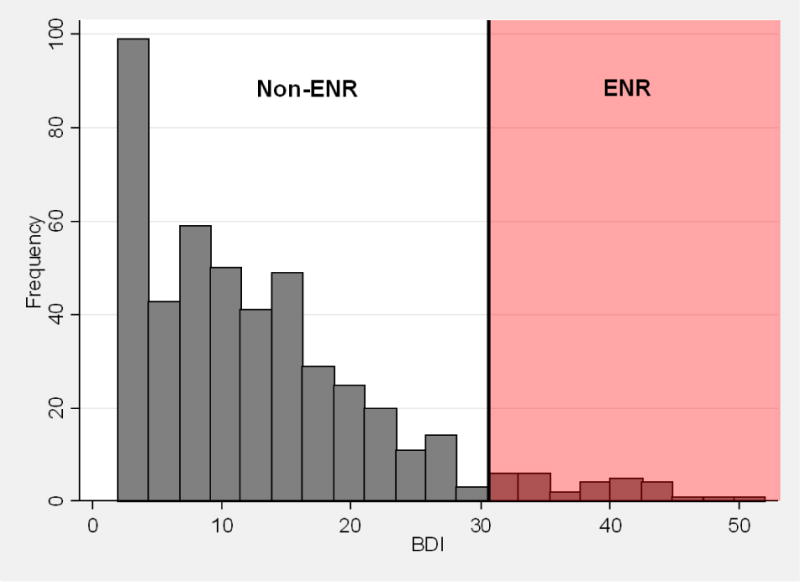
Histogram of C-CT-RP final BDI scores, highlighted to identify extreme non-response (ENR) and non-ENR participants. Of the 473 participants included in the analyses, 6.3% (30/473) met the original Seattle criteria for extreme non-response (final BDI ≥ 31).
Next, pre- and post-treatment GAF, BDI, HRSD, SAS-SR, and IIP scores for the C-CT-RP sample were compared using two-tailed t-tests. Within the C-CT-RP sample, BDI scores (t = −27.5, df = 944, p<.0001), HRSD-17 scores (t = −28.3, df = 944, p<.0001), IIP scores (t = −11.2, df = 879, p<.0001), and SAS-SR scores (t = −16.0, df = 878, p<.0001) decreased significantly over acute-phase CT treatment, and GAF scores increased significantly (t = 27.5, df = 944, p<.0001)6. For all measures, score changes indicated an improvement in symptoms over the course of treatment. To determine if pre-treatment GAF, BDI, HRSD, and interpersonal functioning scores had the ability to discriminate between ENR and non-ENR status within the C-CT-RP sample, two-tailed t and z tests were used to compare scores between the ENR and non-ENR subgroups (Figure II). Pre-treatment GAF, BDI, and HRSD scores were found to differ significantly between the ENR and non-ENR groups, in keeping with the findings of the Seattle study. In the C-CT-RP sample, GAF scores were significantly lower among ENR participants (z = 3.68, p<.001), and both BDI scores (z = −6.11, p < .0001) and HRSD scores (t = −5.06, df = 471, p < .0001) were significantly higher among ENR participants. The proportion of individuals meeting criteria for “high HRSD severity” (as reflected by scores greater than/equal to 20, pre-treatment) differed significantly, with a greater proportion identified within the ENR subgroup (Fisher’s exact test, p <.001). Two-tailed z tests also revealed significant differences between the ENR and non-ENR subgroups on both measures of interpersonal functioning: the SAS-SR (z = −6.23, p < .0001) and the IIP (z = −4.15, p < .0001). Interpersonal dysfunction was recorded to be at a higher level for the ENR participants in both cases, as reflected by lower mean scores for the non-ENR participants on the SAS-SR and IIP. Differences between the two C-CT-RP sites (Pittsburgh and Dallas) were found on certain pre-treatment symptom measures. Participants receiving care at the Dallas site had higher mean pre-treatment BDI scores (Dallas mean: 27.6 (SD 8.33), Pittsburgh mean: 24.7 (SD 8.93); z = 3.68, p<.001) and slightly lower pre-treatment HRSD-17 scores (Dallas mean: 19.6 (SD 4.02), Pittsburgh mean: 20.9 (SD 5.39); z = 3.19, p<.01) than participants at the Pittsburgh site, as well as slightly higher interpersonal dysfunction as measured by the SAS-SR (Dallas mean: 2.57 (SD 0.445), Pittsburgh mean: 2.48 (SD 0.431); z=2.44, p<.05) but not the IIP (Dallas mean: 210.6 (SD 67.1), Pittsburgh mean: 202.0 (SD 73.6); t = 1.33, df = 471, p>.05). Global functioning (GAF) did not differ significantly across sites (Dallas mean: 54.5 (SD 5.53), Pittsburgh mean: 53.7 (SD 6.38); z=1.74, p>.05). Despite these differences, ENR rates did not differ significantly across sites. Only 5.8% (15/258) of participants at the Dallas site had a post-treatment BDI score greater than/equal to 31, compared to 7.0% (15/215) at the Pittsburgh site (z=−0.52, p>.05).
Figure II.
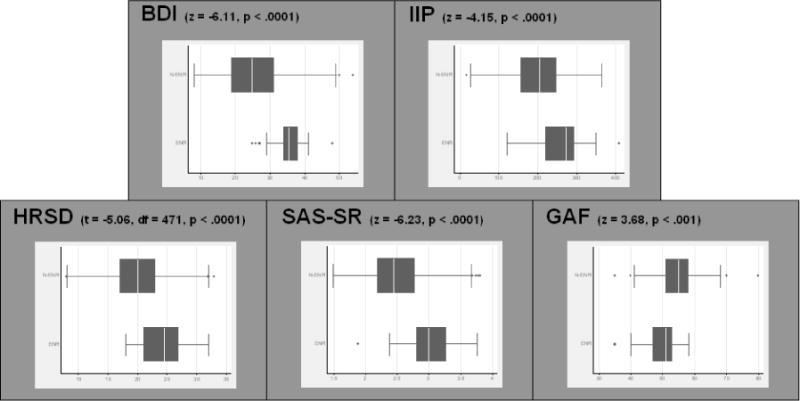
Box plots of pre-treatment symptom measures, separated by end-of-treatment ENR status. Pre-treatment GAF, BDI, HRSD, IIP, and SAS-SR scores differed significantly between the ENR and non-ENR groups, in keeping with the findings of the Seattle study. Note: continuous HRSD scores depicted. For binary HRSD: Fisher’s exact, p<.001.
In an attempt to replicate the results of the Seattle study, logistic regression was used to determine the relationship between four pre-treatment measures of symptom severity (Beck inventory score, GAF score, HRSD severity, and interpersonal dysfunction severity) and the outcome of interest (ENR status) within the C-CT-RP sample. As a substitute for the Seattle study’s Axis4-01 measure, a binary measure of interpersonal functioning was created from each C-CT-RP SAS-SR score. The SAS-SR was chosen over the IIP for its superior ability to discriminate between ENR and non-ENR subgroups, as reflected by relative z-scores. A cut-off score on the SAS-SR scale was calculated, such that the prevalence of participants who qualified for “yes” interpersonal problems within the C-CT-RP sample was identical to that of the Seattle sample. Based on this rationale, participants with a pre-treatment SAS-SR score greater than 2.42 were categorized as “yes” on the new binary interpersonal variable, such that 55.4% (262/473) of C-CT-RP participants met criteria for interpersonal dysfunction, similar to the 55.5% (25/45) who met criteria in the Seattle sample.
The resulting logistic regression produced an algorithm that utilized four variables to predict ENR status within the C-CT-RP sample. The ROC analysis conducted using these variables as predictors produced a composite distribution that accounted for 84.6% (95% confidence interval = 78.8% to 90.5%) of the area under the curve. Each participant was classified with respect to risk for ENR by entering his or her scores on four relevant pre-treatment variables according to the following algorithm: F = −.9733 − .0723 × GAF + .0840 × BDI + 1.397 × SAS-SR Severity + 0.5616 × HRSD Severity (i.e. “C-CT-RP Replication Algorithm”). This composite distribution contrasts with the one identified by Coffman and colleagues for the Seattle sample, which accounted for 97% of the area under the curve and produced the following algorithm: F = 15.19 − 0.687 × GAF + 0.358 × BDI + 3.494 × Axis4-01 + 2.086 × HRSD Severity (i.e. “Seattle Algorithm”). In keeping with the parameters outlined in the Seattle study, pre-treatment GAF and BDI scores were continuous, ranging from 0 to 100 on the GAF, with lower scores indicating greater functional impairment, and 0 to 63 on the BDI, with higher scores indicating greater distress. The Axis4-01 and SAS-SR Severity measures (both measuring primary support group problems) were binary (0 = no, 1 = yes), as was pre-treatment HRSD Severity (1 = scores below 20 and 2 = scores 20 and above). Individuals with positive scores on the above equations were classified as ENR, whereas individuals with zero or negative scores were classified as non-ENR. When the replication algorithm was applied to the C-CT-RP dataset, 150 participants (31.7%) were predicted to demonstrate ENR and 323 (68.3%) were predicted to demonstrate non-ENR. This represents a sensitivity of 90% (27 out of 30 participants were correctly classified as ENR) and a specificity of 72.2% (320 out of 443 participants were correctly classified as non-ENR). The positive predictive value (PPV) of the replication equation for predicting ENR status within the C-CT-RP sample was 18.0% (27/150) and the negative predictive value (NPV) was 99.1% (320/323). As such, the replication equation predicted non-ENR status much more accurately than ENR status within the dataset.
As a means of comparing the Seattle and C-CT-RP algorithms, we utilized a series of two-tailed z tests to compare the Seattle and C-CT-RP equation variables. All variable coefficients differed significantly between the two algorithms (Table 2). To further explore these discrepancies, the values for pre-treatment BDI, GAF, HRSD severity, and interpersonal severity obtained in the C-CT-RP study were tested within the Seattle equation, in order to determine the ability of the Seattle equation to predict ENR status within the C-CT-RP sample. When the Seattle algorithm was applied to the C-CT-RP dataset, 88 participants (18.6%) were predicted to demonstrate ENR and 385 (81.4%) were predicted to demonstrate non-ENR. This represents a sensitivity of 60% (18 out of 30 participants were correctly classified as ENR) and a specificity of 84.2% (373 out of 443 participants were correctly classified as non-ENR). The positive predictive value (PPV) of the Seattle equation for predicting ENR status within the C-CT-RP sample was 20.4% (18/88), and the negative predictive value (NPV) was 96.9% (373/385). As such, the Seattle equation predicted non-ENR status much more accurately than ENR status within the C-CT-RP dataset.
Table 2.
Predictive Algorithms Derived from Seattle and C-CT-RP Samples
| CONSTANT | COEFFICIENT | |||||
|---|---|---|---|---|---|---|
| GAF | BDI | Interpersonal | HRSD Severity | |||
| Seattle | F = | 15,19 | − .687 | + .358 | + 3.494 | + 2.086 |
| C-CT-RP | F = | −0.9733 | −0.0723 | + .0840 | + 1.397 | + 0.5616 |
| Test of Difference | z=6.05, p<.0001 | z=15.23; p<.0001 | z=9.75; p<.0001 | z=2.69, p<.01 | z=2.55, p<.05 | |
Next, we considered other ways to classify extreme non-response within the C-CT-RP sample. Participants of the C-CT-RP trial self-reported lower overall pre-treatment depression severity than their Seattle counterparts, such that a final score on the BDI of greater than 30 represented essentially “no change” from the Seattle group’s pre-treatment mean of 31.1, whereas a similar cut-off represented a nearly 5 point increase from the pre-treatment C-CT-RP mean of 26.3. To examine if this difference might account for varying rates of ENR between the Seattle and C-CT-RP samples, we calculated a new C-CT-RP ENR rate using a BDI cut-off of 26.3 (i.e. the pre-treatment mean), resulting in an increase in the ENR rate to 9.1% (43/473). Despite this adjustment, the ENR rate remained significantly lower than the 22.2% rate observed for the Seattle sample (z=2.78, p<.01). We also considered a “percentage-improvement” model, classifying a participant as ENR if he or she demonstrated no improvement in BDI score over the course of acute-phase treatment, and found that 10.3% (49/473) of C-CT-RP participants met this criterion. This rate was also significantly lower than the 22.2% rate observed for the Seattle sample (z=2.39, p<.05). Finally, we examined the rate of ENR among only those C-CT-RP participants who completed the entire acute phase of therapy (16 sessions for early responders, 20 sessions for late responders). Of the 390 participants who completed all C-CT-RP acute-phase sessions, 18 ended treatment with a BDI of greater than 30, resulting in an ENR rate of 4.6% (18/390). This rate was significantly lower than the ENR rate for Seattle participants (10/45), all of whom completed the majority (at least 13 of 16) acute-phase cognitive therapy sessions (z=−4.56, p<.0001). In addition, of the 390 acute-phase completers, 25 (6.41%) ended treatment with zero or negative percentage-improvement on the BDI, a rate that was also significantly lower than the Seattle ENR rate (z=−3.69, p<.001).
Finally, using methods similar to those described by Coffman et al., we attempted to create a new predictive algorithm for non-response using data from C-CT-RP participants. In this model, we defined “non-response” broadly as any participant whose post-treatment BDI score was unchanged or worse than their pre-treatment BDI score (zero or negative percentage-improvement). The rationale for doing so was to provide a more conceptually and clinically-meaningful definition of non-response. To begin, we used a series of two-tailed t- and z-tests to determine if pre-treatment HRSD, GAF, SAS-SR, and IIP scores were able to discriminate between “response” and “non-response” subjects using the percentage-improvement criteria. Pre-treatment HRSD, GAF, SAS-SR, and IIP scores did not differ significantly between the response and non-response groups (Figure III). As such, at attempt to create a replication algorithm was halted due to the low likelihood of creating a valid predictive algorithm for response and non-response to cognitive therapy. Further complicating the creation of a replication algorithm was the finding that many of the pre-treatment measures were highly correlated with one another, as was the case with pre-treatment HRSD-17 and GAF scores (r=−0.531), pre-treatment SAS-SR and HRSD-17 scores (r=0.503), pre-treatment GAF and SAS-SR scores (r=−0.444), and pre-treatment SAS-SR and IIP scores (r=0.456).
Figure III.
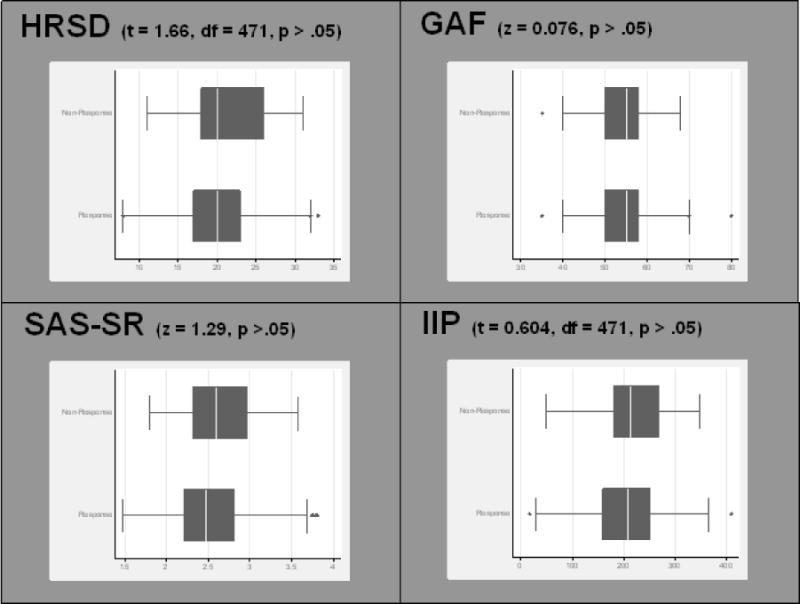
Box plots of pre-treatment symptom measures, separated by C-CT-RP end-of-treatment response status (defined by BDI percent-improvement criteria). Pre-treatment HRSD, GAF, SAS-SR, and IIP scores did not differ significantly between cognitive therapy responders and non-responders within the C-CT-RP protocol.
Discussion
There were two primary reasons for undertaking this set of analyses. First, since we considered the possibility of identifying a subset of depressed patients with an extremely poor response to CT to be clinically important, we sought to replicate the results of the Seattle study in a larger sample of depressed outpatients who were treated with acute-phase cognitive therapy. Second, we hoped to expand on the understanding of the relationship between pre-treatment clinical measures and post-treatment response to acute-phase CT. Our results produced a mixed picture, with some replicating the findings of the Seattle study and others challenging the utility of the concept of extreme non-response as defined by post-treatment BDI score. To begin, we found further evidence of a relationship between certain pre-treatment clinical measures and registering a high post-treatment BDI score. Like the Seattle group, we found that four clinically-relevant pre-treatment variables—scores on the BDI, HRSD, GAF, and a measure of interpersonal problem severity—were associated with reporting a higher post-treatment BDI total. However, “extreme non-response” was much less common in our sample—regardless of how it was defined—and the Seattle group’s proposed algorithm failed to accurately predict ENR status, suggesting that the algorithm may describe a sample-specific phenomenon that does not readily generalize to another group of depressed outpatients treated with cognitive therapy.
Although the divergence of the C-CT-RP and Seattle algorithms was noteworthy, the large difference in ENR rates among the two studies was even more remarkable. Specifically, whereas 22.2% of the participants who received CT in Seattle met criteria for ENR, only 6.3% of C-CT-RP participants ended treatment with BDI scores above 30. Furthermore, when we examined other ways to classify ENR within the C-CT-RP sample—including adjusting the post-treatment BDI cut-off to reflect the pre-treatment group mean, examining a “percentage-improvement” model, and restricting our sample to only those participants who completed the entire acute phase of treatment—in each case, the ENR rate was significantly lower than the 22.2% rate observed in the Seattle study.
It is possible that the observed difference in ENR rates may be a consequence of the design differences or demand characteristics of the Seattle and C-CT-RP studies. With respect to design, the Seattle study utilized data from a single-site randomized trial of behavioral activation, cognitive therapy, and antidepressant medication for the acute treatment of MDD. The C-CT-RP study, on the other hand, utilized data from the acute therapy phase of a two site study that was designed to test the prophylactic effects of continuation phase treatments. The cognitive therapy protocol also differed slightly between the two studies. In the Seattle study, up to 24 50-minute CT sessions were provided over 16 weeks, with twice-weekly sessions for the first 8 weeks followed by weekly session for the following 8 weeks. In C-CT-RP, 50-minute CT sessions were provided twice-weekly for the first 4 weeks, after which participants who obtained a 40% or greater reduction on the HRSD-17 began weekly sessions, while the remainder continued twice-weekly sessions for four more weeks before beginning weekly sessions. The purpose of the C-CT-RP design—which allocated more CT sessions to individuals with slower improvement—was to maximize the likelihood of response and subsequent participation in the placebo-controlled continuation phase of the study. Thus, whereas the primary goal of the Seattle study was to compare different acute-phase MDD treatment strategies (i.e. Behavioral Activation, CT, antidepressant medication, and pill placebo), the primary goal of the acute phase of C-CT-RP was to help as many patients as possible respond to CT so that they could participate in the subsequent phase of the study that evaluated the efficacy and durability of continuation-phase CT for prophylaxis against MDD relapse. As such, the Seattle study required that participants be at sufficient equipoise to accept randomization, whereas all of the participants in C-CT-RP received cognitive therapy. As a result, there may have been greater implicit expectation by all individuals involved in the C-CT-RP protocol—including patients, therapists, and evaluators—for a positive response to therapy. Although this difference in expectation might have lowered the rate of ENR in the C-CT-RP sample, it is also true that Seattle participants received a significantly greater total number of therapy sessions. Moreover, the cognitive therapy protocols were quite similar: both used the same methods and techniques, and in both studies treatment was delivered by highly skilled and adherent therapists who received supervision by experts with high allegiance to this model of therapy.
It is also possible that the difference in C-CT-RP and Seattle ENR rates was a result of the distinct compositions of the two samples. On the one hand, we found that the two samples did not differ significantly in gender distribution, marital status, or employment status. On the other, we found that the participants in the C-CT-RP sample were, on average, almost 5 years older than their Seattle counterparts. The reasons for this age difference likely derive both from the fact that the upper age limit for the C-CT-RP study was 70 years (compared to 60 years for the Seattle study) as well as the requirement that participants recruited for the C-CT-RP study have a history of at least one prior depressive episode. To date, there is no reason to believe that older age or a history of recurrent major depression would be associated with a better response to CT (and, thus, fewer cases of ENR), and we do not believe that such differences in sample composition were meaningful with respect to the lower rate of ENR that we observed. The comparability of the C-CT-RP and Seattle samples was also supported by the finding that pre-treatment HRSD and GAF scores did not differ significantly between the samples. As both are clinician-administered scales, these similarities suggest that clinicians involved in the studies viewed their participants as similarly depressed and having similar levels of functioning prior to receiving the intervention. With respect to the observed difference in pre-treatment BDI scores, Enns and colleagues (Enns, Larsen, & Cox, 2000) found that differences in BDI and HRSD scores are negatively correlated with age, with younger participants tending to rate themselves as more severely depressed on the BDI relative to the HRSD. As the Seattle sample was younger, it is possible that these younger participants rated their depressive symptoms as more severe than their older C-CT-RP counterparts, both before and after treatment. It is also important to note that the two studies differed with respect to BDI inclusion criteria—whereas both studies required a HRSD-17 score of 14 or greater at pre-treatment, the Seattle study had the added requirement of a BDI score of 20 or greater prior to entering the protocol. There were a number of participants in the C-CT-RP study (N=112, 23.7%) with pre-treatment BDI scores less than 20, who would have been excluded from participating in the Seattle protocol.
Although the characteristics of the samples and treatment protocols were not identical, there were no major differences between the two, and it is clear that the predictive model for ENR status derived from the Seattle data was not robust when applied to a larger but similar sample of depressed outpatients treated with CT. It is unclear if the revised C-CT-RP algorithm would have performed similarly poorly in the Seattle sample, as raw data for the Seattle sample was not available to the authors. One should also be cautious in generalizing the results of the current study to the real-world clinical population (i.e. expected rate of ENR), given limitations imposed by the specific selection criteria used for the C-CT-RP protocol.
Several points from this line of research should be carried forward. First, among those who do not respond to acute-phase cognitive therapy for depression, some end treatment with high symptom scores and a small number even get worse during the course of therapy. Like the Seattle group, we found that these non-responders (as defined by high post-treatment BDI scores) were characterized by relatively high levels of symptom severity and poorer interpersonal functioning prior to the onset of treatment. We suspect that this profile has relatively broad negative prognostic value, but may not be specific for non-response to CT. Instead, it may identify patients for whom individual modalities of antidepressant therapy will likely fail, and may mark patients who require combined approaches or sequenced treatments. In addition, there are likely more precise ways to characterize response, non-response, and extreme non-response to CT, some of which we aim to explore in future studies. In the current analyses, for example, the participants who met criteria for ENR demonstrated several different temporal patterns of non-response. In future reports, we aim to examine whether or not it may be more useful to construct a typology of non-response based on different temporal patterns of change using a method such as cluster analysis (Dew et al., 1997). In addition, it would be helpful if non-response to CT was examined in other research settings, such as in effectiveness trials where treatment is not as closely monitored. Such trials may come closer to capturing “real-world” rates of non-response and extreme non-response to cognitive therapy. Collectively, such investigations have the potential to significantly impact clinical practice by permitting a more targeted allocation of relatively scarce CT resources to patients with a higher likelihood of responding to treatment, as well as reducing morbidity for those who are unlikely to benefit from cognitive therapy.
Highlights.
-
■
Previous study identified group of “extreme non-responders” to cognitive therapy for MDD.
-
■
We attempted to replicate this smaller study (N=45) with our much larger sample (N=473).
-
■
The rate of ENR in our sample was 6.3%, compared to 22.2% in the previous study.
-
■
Greater pre-treatment symptom severity and poorer functioning were associated with ENR status.
-
■
Pre-treatment symptoms didn’t accurately predict ENR status, as they did in previous study.
Footnotes
Publisher's Disclaimer: This is a PDF file of an unedited manuscript that has been accepted for publication. As a service to our customers we are providing this early version of the manuscript. The manuscript will undergo copyediting, typesetting, and review of the resulting proof before it is published in its final citable form. Please note that during the production process errors may be discovered which could affect the content, and all legal disclaimers that apply to the journal pertain.
A scoring error resulted in two patients beginning CT with HRSD-17 scores of 13. One of these patients responded to acute-phase CT and the other dropped out.
Fourteen participants attended CT session #1 but did not complete a post-therapy evaluation session and were excluded from the current analyses.
Fourteen participants were missing pre-treatment scores on one or more of the following measures and were excluded from the analyses: GAF, BDI, HRSD, SAS-SR.
Fourteen participants were missing pre-treatment scores on one or more of the following measures and were excluded from the analyses: GAF, BDI, HRSD, SAS-SR.
Whereas the Seattle study used the 21-item BDI-II to classify patients as extreme non-responders, our study used scores from the 21-item BDI-IA. The BDI-IA and BDI-II are numerically equivalent, each containing 21 items rated on a scale ranging from 0 to 3. The totals for these instruments, which range from 0 to 63, also correspond to identical categories of depressive severity. Beck and colleagues have shown that the correlation between BDI-IA and BDI-II score totals approximates the internal consistency of both scales, although a correction (adding a sum of 2 to each BDI-IA score total) is required to adjust BDI-IA scores to reflect their BDI-II equivalents (A. T. Beck et al., 1996). This correction was performed here, and was carried through for the remainder of the analyses.
Post-treatment BDI, HRSD-17, and GAF scores were available for all participants; however, post-treatment IIP scores were unavailable for 65 participants, and post-treatment SAS-SR scores were unavailable for 66 participants.
References
- APA. Diagnostic and statistical manual of mental disorders : DSM-IV. 4. Washington, DC: American Psychiatric Association; 1994. [Google Scholar]
- Barkham M, Hardy GE, Startup M. The structure, validity and clinical relevance of the Inventory of Interpersonal Problems. Br J Med Psychol. 1994;67(Pt 2):171–185. doi: 10.1111/j.2044-8341.1994.tb01784.x. [DOI] [PubMed] [Google Scholar]
- Beck A, Steer R, Garbin M. Psychometric properties of the Beck Depression Inventory: Twenty five years of evaluation. Clin Psychol Rev. 1988;8:77–100. [Google Scholar]
- Beck AT. Cognitive therapy of depression. New York: Guilford Press; 1979. [Google Scholar]
- Beck AT, Steer RA, Ball R, Ranieri W. Comparison of Beck Depression Inventories -IA and -II in psychiatric outpatients. J Pers Assess. 1996;67(3):588–597. doi: 10.1207/s15327752jpa6703_13. [DOI] [PubMed] [Google Scholar]
- Beck AT, Ward CH, Mendelson M, Mock J, Erbaugh J. An inventory for measuring depression. Arch Gen Psychiatry. 1961;4:561–571. doi: 10.1001/archpsyc.1961.01710120031004. [DOI] [PubMed] [Google Scholar]
- Butler AC, Chapman JE, Forman EM, Beck AT. The empirical status of cognitive-behavioral therapy: a review of meta-analyses. Clin Psychol Rev. 2006;26(1):17–31. doi: 10.1016/j.cpr.2005.07.003. [DOI] [PubMed] [Google Scholar]
- Clark LA, Watson D. Tripartite model of anxiety and depression: psychometric evidence and taxonomic implications. J Abnorm Psychol. 1991;100(3):316–336. doi: 10.1037//0021-843x.100.3.316. [DOI] [PubMed] [Google Scholar]
- Coffman SJ, Martell CR, Dimidjian S, Gallop R, Hollon SD. Extreme nonresponse in cognitive therapy: can behavioral activation succeed where cognitive therapy fails? J Consult Clin Psychol. 2007;75(4):531–541. doi: 10.1037/0022-006X.75.4.531. [DOI] [PubMed] [Google Scholar]
- DeRubeis RJ, Gelfand LA, Tang TZ, Simons AD. Medications versus cognitive behavior therapy for severely depressed outpatients: mega-analysis of four randomized comparisons. Am J Psychiatry. 1999;156(7):1007–1013. doi: 10.1176/ajp.156.7.1007. [DOI] [PubMed] [Google Scholar]
- DeRubeis RJ, Hollon SD, Amsterdam JD, Shelton RC, Young PR, Salomon RM, Gallop R. Cognitive therapy vs medications in the treatment of moderate to severe depression. Arch Gen Psychiatry. 2005;62(4):409–416. doi: 10.1001/archpsyc.62.4.409. [DOI] [PubMed] [Google Scholar]
- Dew MA, Reynolds CF, 3rd, Houck PR, Hall M, Buysse DJ, Frank E, Kupfer DJ. Temporal profiles of the course of depression during treatment. Predictors of pathways toward recovery in the elderly. Arch Gen Psychiatry. 1997;54(11):1016–1024. doi: 10.1001/archpsyc.1997.01830230050007. [DOI] [PubMed] [Google Scholar]
- Endicott J, Spitzer RL, Fleiss JL, Cohen J. The global assessment scale. A procedure for measuring overall severity of psychiatric disturbance. Arch Gen Psychiatry. 1976;33(6):766–771. doi: 10.1001/archpsyc.1976.01770060086012. [DOI] [PubMed] [Google Scholar]
- Enns MW, Larsen DK, Cox BJ. Discrepancies between self and observer ratings of depression. The relationship to demographic, clinical and personality variables. J Affect Disord. 2000;60(1):33–41. doi: 10.1016/s0165-0327(99)00156-1. doi: S0165-0327(99)00156-1 [pii] [DOI] [PubMed] [Google Scholar]
- First M, Spitzer RL, Gibbon M, Williams JB. Structured Clinical Interview for DSM-IV Axis I Disorders-Patient Edition (SCID-I/P, Version 2.0) B. R. D. New York State Psychiatric Institute (Ed.); New York: 1996. [Google Scholar]
- Gurtman M. Interpersonal problems and the psychotherapy context: The construct validity of the Inventory of Interpersonal Problems. Psychol Assess. 1996;8:241–255. [Google Scholar]
- Hamilton M. A rating scale for depression. J Neurol Neurosurg Psychiatry. 1960;(12):52–62. doi: 10.1136/jnnp.23.1.56. [DOI] [PMC free article] [PubMed] [Google Scholar]
- Horowitz LM, Rosenberg SE, Baer BA, Ureno G, Villasenor VS. Inventory of interpersonal problems: psychometric properties and clinical applications. J Consult Clin Psychol. 1988;56(6):885–892. doi: 10.1037//0022-006x.56.6.885. [DOI] [PubMed] [Google Scholar]
- Jarrett RB, Minhajuddin A, Gershenfeld H, Friedman ES, Thase ME. Preventing Depressive Relapse and Recurrence in Higher-Risk Cognitive Therapy Responders: A Randomized Trial of Continuation Phase Cognitive Therapy, Fluoxetine, or Matched Pill Placebo. JAMA Psychiatry. 2013 doi: 10.1001/jamapsychiatry.2013.1969. [DOI] [PMC free article] [PubMed] [Google Scholar]
- Jarrett RB, Minhajuddin A, Kangas JL, Friedman ES, Callan JA, Thase ME. Acute phase cognitive therapy for recurrent major depressive disorder: who drops out and how much do patient skills influence response? Behav Res Ther. 2013;51(4–5):221–230. doi: 10.1016/j.brat.2013.01.006. [DOI] [PMC free article] [PubMed] [Google Scholar]
- Jarrett RB, Thase ME. Comparative efficacy and durability of continuation phase cognitive therapy for preventing recurrent depression: design of a double-blinded, fluoxetine- and pill placebo-controlled, randomized trial with 2-year follow-up. Contemp Clin Trials. 2010;31(4):355–377. doi: 10.1016/j.cct.2010.04.004. [DOI] [PMC free article] [PubMed] [Google Scholar]
- Knesevich JW, Biggs JT, Clayton PJ, Ziegler VE. Validity of the Hamilton Rating Scale for depression. Br J Psychiatry. 1977;131:49–52. doi: 10.1192/bjp.131.1.49. [DOI] [PubMed] [Google Scholar]
- Ramirez A, Ekselius L, Ramklint M. Axis V – Global Assessment of Functioning scale (GAF), further evaluation of the self-report version. Eur Psychiatry. 2008;23(8):575–579. doi: 10.1016/j.eurpsy.2008.05.001. [DOI] [PubMed] [Google Scholar]
- Renner F, Jarrett RB, Vittengl JR, Barrett MS, Clark LA, Thase ME. Interpersonal problems as predictors of therapeutic alliance and symptom improvement in cognitive therapy for depression. J Affect Disord. 2012;138(3):458–467. doi: 10.1016/j.jad.2011.12.044. [DOI] [PMC free article] [PubMed] [Google Scholar]
- Roth A, Fonagy P. What works for whom?: a critical review of psychotherapy research. New York: Guilford Press; 1996. [Google Scholar]
- Schulberg HC, Pilkonis PA, Houck P. The severity of major depression and choice of treatment in primary care practice. J Consult Clin Psychol. 1998;66(6):932–938. doi: 10.1037//0022-006x.66.6.932. [DOI] [PubMed] [Google Scholar]
- Schwab JJ, Bialow MR, Clemmons RS, Holzer CE. Hamilton rating scale for depression with medical in-patients. Br J Psychiatry. 1967;113(494):83–88. doi: 10.1192/bjp.113.494.83. [DOI] [PubMed] [Google Scholar]
- Shafran R, Clark DM, Fairburn CG, Arntz A, Barlow DH, Ehlers A, Wilson GT. Mind the gap: Improving the dissemination of CBT. Behav Res Ther. 2009;47(11):902–909. doi: 10.1016/j.brat.2009.07.003. [DOI] [PubMed] [Google Scholar]
- Steer RA, Clark DA, Beck AT, Ranieri WF. Common and specific dimensions of self-reported anxiety and depression: the BDI-II versus the BDI-IA. Behav Res Ther. 1999;37(2):183–190. doi: 10.1016/s0005-7967(98)00087-4. [DOI] [PubMed] [Google Scholar]
- Vallis TM, Shaw BF, Dobson KS. The Cognitive Therapy Scale: psychometric properties. J Consult Clin Psychol. 1986;54(3):381–385. doi: 10.1037//0022-006x.54.3.381. [DOI] [PubMed] [Google Scholar]
- Vatnaland T, Vatnaland J, Friis S, Opjordsmoen S. Are GAF scores reliable in routine clinical use? Acta Psychiatr Scand. 2007;115(4):326–330. doi: 10.1111/j.1600-0447.2006.00925.x. [DOI] [PubMed] [Google Scholar]
- Weissman MM, Bothwell S. Assessment of social adjustment by patient self-report. Arch Gen Psychiatry. 1976;33(9):1111–1115. doi: 10.1001/archpsyc.1976.01770090101010. [DOI] [PubMed] [Google Scholar]
- Weissman MM, Prusoff BA, Thompson WD, Harding PS, Myers JK. Social adjustment by self-report in a community sample and in psychiatric outpatients. J Nerv Ment Dis. 1978;166(5):317–326. doi: 10.1097/00005053-197805000-00002. [DOI] [PubMed] [Google Scholar]
- Whiteford HA, Degenhardt L, Rehm J, Baxter AJ, Ferrari AJ, Erskine HE, Vos T. Global burden of disease attributable to mental and substance use disorders: findings from the Global Burden of Disease Study 2010. Lancet. 2013 doi: 10.1016/S0140-6736(13)61611-6. [DOI] [PubMed] [Google Scholar]
- Woodward LE, Murrell SA, Bettler RF. Stability, reliability, and norms for the inventory of interpersonal problems. Psychother Res. 2005;15(3):272–286. doi: 10.1080/10503300512331334977. [DOI] [PubMed] [Google Scholar]