

Abstract
Approximately 1 in 400 neonates in Turkey is affected by inherited metabolic diseases. This high prevalence is at least in part due to consanguineous marriages. Standard screening in Turkey now covers only three metabolic diseases (phenylketonuria, congenital hypothyroidism, and biotinidase deficiency). Once symptoms have developed, tandem-MS can be used, although this currently covers only up to 40 metabolites. NMR potentially offers a rapid and versatile alternative.
We conducted a multi-center clinical study in 14 clinical centers in Turkey. Urine samples from 989 neonates were collected and investigated by using NMR spectroscopy in two different laboratories. The primary objective of the present study was to explore the range of variation of concentration and chemical shifts of specific metabolites without clinically relevant findings that can be detected in the urine of Turkish neonates. The secondary objective was the integration of the results from a healthy reference population of neonates into an NMR database, for routine and completely automatic screening of congenital metabolic diseases.
Both targeted and untargeted analyses were performed on the data. Targeted analysis was aimed at 65 metabolites. Limits of detection and quantitation were determined by generating urine spectra, in which known concentrations of the analytes were added electronically as well as by real spiking. Untargeted analysis involved analysis of the whole spectrum for abnormal features, using statistical procedures, including principal component analysis. Outliers were eliminated by model building. Untargeted analysis was used to detect known and unknown compounds and jaundice, proteinuria, and acidemia. The results will be used to establish a database to detect pathological concentration ranges and for routine screening.
Electronic supplementary material
The online version of this chapter (doi:10.1007/8904_2014_326) contains supplementary material, which is available to authorized users.
Introduction
Approximately 1:13,00 neonates is affected by congenital metabolic diseases in central Europe and 1:400 in Turkey (Aygen et al. 2011; Saudubray et al. 2006; Leonard and Morris 2006; Hasanoglu et al. 2000). This high prevalence is at least in part due to consanguineous marriages. Undetected and untreated, these diseases can lead to irreversible organ failure, invalidity, or death. With early diagnosis, therapy, and special medication, these developmental disorders may be treated successfully. Therefore, all neonates should be tested for congenital metabolic diseases. The standard screening in Turkey now covers only a few diseases, including phenylketonuria, congenital hypothyroidism, and biotinidase deficiency. Numerous additional diseases are just tested by tandem-MS once symptoms have developed; however, this technique currently uses a maximum of 40 metabolites, as only 40 reference substances are available for quantification (Lehotay et al. 2011; Chace and Kalas 2005).
1H-NMR spectroscopy of body fluids constitutes a complementary technique in the diagnosis of numerous congenital metabolic diseases (Engelke et al. 2008; Moolenaar et al. 2003; Wevers et al. 1994, 1999; Holmes et al. 1997). It shows the majority of proton-containing compounds and therefore provides an overall view of metabolism, giving a characteristic 'fingerprint' of almost all hydrogen nuclei in a metabolite. In the NMR spectrum of urine, more than 1,000 metabolites can be detected simultaneously. As the intensity of the observed resonance is proportional to the number of hydrogen nuclei in the sample, the concentration of each metabolite can be determined as well. Moreover, all metabolites in urine can be analyzed in a single measurement that only takes minutes, allowing fast and cost-effective diagnostic screening. Besides buffering, no pre-processing of the urine samples is necessary. Because of its noninvasive nature, the lack of derivatization, the speed of measurement and its high reproducibility 1H-NMR spectroscopic analysis is a very promising approach.
Some neonates with congenital metabolic diseases have already been investigated qualitatively by NMR spectroscopy (Engelke et al. 2008; Moolenaar et al. 2003). Nevertheless, there is no systematic, automated, and standardized NMR-based analytical technique. Therefore, fully automated NMR spectroscopy of body fluids may be considered as an alternative analytical approach for the early and clear diagnosis of known, and even unknown, inborn errors of metabolism.
In this context, a multi-center clinical trial with 989 neonates in 14 clinical centers was performed. The main objective of this project is the qualitative and quantitative determination of pathological metabolites by high resolution NMR spectroscopy in an automated and standardized procedure. To achieve this, it is necessary to define a statistical model of normality based on healthy neonates, against which each new urine spectrum can be tested.
An additional problem is that healthy neonates can have high concentrations of different pathological metabolites after birth. On subsequent monitoring, it may be found that metabolite levels have returned to normal and that the child is clinically normal. The case can then be eliminated as a false positive result. The transition state in the first days of life can actually be used to build models for the first days after birth and such can give information on the development state of the newborn.
This approach is intended to facilitate the early detection of inherent metabolic diseases, leading to appropriate treatment – which can greatly increase the quality of life of both the neonate and its parents.
Materials and Methods
Study Objectives
The primary objective of the study was to explore the range of variation (concentration and chemical shifts) of specific metabolites without clinically relevant findings. This is necessary for the identification of pathological thresholds of specific metabolites in comparison with healthy neonates (for development of a normal model).
The secondary objective was the integration of the results from a healthy population of neonates into an NMR database, in order to perform routine and completely automatic screening for congenital metabolic diseases as well as the direct quantification of diagnostic metabolites indicating inborn errors of metabolism.
Study Design
In an open, one-arm, non-interventional study, data were collected from healthy Turkish neonates, aged 24 to 168 h after birth. Data included the date of birth, the day of life, gestational age, gender, weight, length, head circumference, and type of birth. Premature infants with gestation period of below 37 weeks (+6 days) as well as neonates, who have clinical symptoms of disease, were excluded. Data were collected in 14 centers in Turkey over a period of 18 months.
Selected Cohort
The study covered 14 birth centers from all over Turkey. In all, 989 neonates were included in the study. 953 of these samples were measured in INFAI laboratory and 890 in the BRUKER laboratory. Demographic data was collected for the neonate and for the parents. The study was approved by local ethic committees and all parents gave written informed consent.
Sample Collection and Preparation
Urine samples were collected between day 1 and day 7 of life, using a standard pediatric urine bag. The urine samples were deep frozen and then transferred to the NMR laboratories, where they were thawed and homogenized. Five-hundred and forty micro liter of urine was then mixed with 60 μL of 1.5 M phosphate buffer, to give a stable pH of 7.0 ± 0.5. The buffer was prepared in D2O containing 0.1% sodium 3-trimethylsilyl-(2,2,3,3-2H4)-1-propionate (TSP) for reference, together with 2 mM sodium azide. Chemicals were obtained from Sigma Aldrich. A pH around 7 was chosen, since at this pH most metabolites show very small variation in chemical shift due to pH changes as can be found from the Bruker Reference Compound Spectral Base. In most cases, chemical shifts between 6 and 8 ppm do not change significantly in more than 650 compounds investigated.
Study Devices
The urine samples were investigated by using fully automated NMR spectrometers in two different laboratories (INFAI and BRUKER). At INFAI: 500 MHz AVANCE III, UltraShield Magnet with BOSS III shimming system, BACS-60, TopSpin 2.1, 5 mm SEI 1H/D-13C with z-gradient, automated tuning and matching (ATM). The BTO 2000 of the probe combined with a BCU-05 for cooling ensured temperature stability to within 0.01 K. At BRUKER: 600 MHz AVANCE III, UltraShield Plus Magnet with BOSS II shimming system, BACS-60, TopSpin 2.1, 5 mm BBI 1H/D-BB with z-gradient, automated tuning and matching (ATM). The BTO 2000 of the probe combined with a BCU-05 for cooling ensured temperature stability of 0.01 K.
NMR Experiments
Before measurement, samples were kept for 5 min inside the NMR probe head, to achieve temperature equilibration (300 K). Experiment 1 – noesygppr1d: For each sample, a one-dimensional 1H NMR spectrum was acquired using a standard pulse sequence with 25 Hz CW-based water peak suppression during a relaxation delay of 4 s and a mixing time of 10 ms. Thirty-two free induction decays (FIDs) were accumulated into 64 k data points at a spectral width of 20.5425 ppm. The FIDs were multiplied by an exponential weighting function corresponding to a line broadening of 0.3 Hz before Fourier transformation and fully automated phasing and baseline correction. Experiment 2 – jresgpprqf: In addition to the one-dimensional experiment, a two-dimensional fast J-resolved measurement was performed on each sample using a standard pulse sequence with 25 Hz CW-based water peak suppression during a relaxation delay of 1 s. After 16 dummy scans, 2 free induction decays (FIDs) were accumulated into 8 k data points at a spectral width of 16 ppm. 40 such increments were collected covering the second spectral dimension (F1) at a width of 78.125 Hz.
Data Analysis
Data was visualized with AMIX 3.9 (Bruker BioSpin). Metabolite signal identification used the reference spectral database BBIOREFCODE-2.0. (Bruker BioSpin). Automated quantification and multivariate statistics were based on in-house developed algorithms using MATLAB (MathWorks Inc).
Absolute Quantification (mmol/L)
TSP is added to all NMR samples at given concentration. From the TSP signal in the urine spectra, a signal-intensity-per-proton-ratio can be calculated which after correction for T1-relaxation effects can be used to translate any signal of the spectrum into a concentration value.
Relative Quantification (mmol/mol Creatinine)
The ratio between a signal intensity of a metabolite and the signal intensity of, e.g., the CH3-signal of creatinine, corrected for signal specific proton numbers and relaxation time effects, multiplied by 1,000 directly gives the concentration of the metabolite in mmol/mol creatinine.
Targeted analysis
Targeted analysis aims at the quantitation of a predefined list of metabolites. Concentration is calculated both, absolute or relative. Quantification is done via signal fitting using a simplex algorithm under consideration of signal and metabolite specific constraints and quantification parameters. This includes molecular mass, number of protons, relaxation time, chemical shift, signal multiplicity and coupling constants, line width, Gauss–Lorentz ratio and search ranges for signal detection and quantification. The quantification targets include 20 normal metabolites that are always present in normal urine (see Table 1).
Table 1.
Concentrations of 19 urinary metabolites given in mmol/mol creatinine
| Metabolite | Mean | Q2.5 | Q25 | Median | Q75 | Q97.5 | Max |
|---|---|---|---|---|---|---|---|
| Acetic acid | 120 | −/− | −/− | −/− | 40 | 1,200 | 7,300 |
| Alanine | 120 | −/− | 60 | 90 | 160 | 330 | 1,900 |
| Betaine | 430 | −/− | 220 | 390 | 600 | 1,100 | 4,300 |
| Citric acid | 440 | −/− | 160 | 360 | 600 | 1,300 | 5,100 |
| Creatine | 140 | −/− | −/− | 40 | 190 | 700 | 1,800 |
| Dimethylamine | 100 | 30 | 70 | 110 | 130 | 160 | 210 |
| Formic acid | 160 | −/− | 30 | 80 | 200 | 740 | 1,600 |
| Fumaric acid | 12 | −/− | −/− | 10 | 20 | 50 | 100 |
| Glycine | 650 | −/− | 230 | 490 | 960 | 1,900 | 6,900 |
| Lactic acid | 90 | −/− | −/− | 40 | 80 | 540 | 5,000 |
| d-Lactose | 230 | −/− | −/− | 190 | 270 | 670 | 19,000 |
| α-d-Galactose | 110 | −/− | −/− | 50 | 150 | 500 | 1,200 |
| β-d-Glucose | 250 | −/− | 60 | 100 | 130 | 380 | 83,000 |
| 1-Methylnicotinamide | 60 | −/− | −/− | 50 | 70 | 150 | 370 |
| Myo-inositol | 490 | −/− | 170 | 360 | 640 | 1,600 | 6,700 |
| N,N-Dimethylglycine | 80 | −/− | 30 | 60 | 90 | 270 | 950 |
| Succinic acid | 110 | −/− | 40 | 70 | 130 | 440 | 1,700 |
| Trimethylamine | 50 | −/− | 20 | 40 | 60 | 170 | 590 |
| Taurine | 410 | −/− | 150 | 310 | 540 | 1,200 | 12,000 |
The parameters Mean and Median assign the concentration mean and median values of the metabolites. Q2.5, Q25, Q75, and Q97.5 represent the respective quantiles (2.5%, 25%, 75%, 97.5%) of the concentration distributions. Because of detection thresholds, Q2.5 and Q25 could not always be determined. Related values are marked as ‘−/−’. Another consequence was that mean values could only be approximated roughly for orientation
In addition, 45 pathological metabolites were analyzed automatically which are generally not found in healthy neonatal urine, except occasionally at low concentrations for short periods: 2-oxoisovaleric acid, 2-hydroxyisovaleric acid, 2-hydroxyphenylacetic acid, 2-oxoisocaproic acid, 2-hydroxyisocaproic acid, 2-phenyllactic acid, 2-hydroxybutyric acid, 3-hydroxyglutaric acid, 3-hydroxyisovaleric acid, 3-hydroxypropionic acid, 3-hydroxyvaleric acid, 3-methyl-2-oxovaleric acid, 3-methylcrotonylglycine, 3-phenyllactic acid, 4-hydroxyphenylacetic acid, 4-hydroxyphenyllactic acid, 5-aminolevulinic acid, acetoacetic acid, acetone, allo-isoleucine, citrulline, d-galactonic acid, d-sorbitol, E-glutaconic acid, ethylmalonic acid, galactitol, glutaric acid, isovalerylglycine, l-leucine, l-isoleucine, l-pyroglutamic acid, methylmalonic acid, N-acetylaspartic acid, neopterin, orotic acid, phenylacetic acid, l-phenylalanine, phenylpyruvic acid, propionic acid, propionylglycine, uracil, uridine, valine and xanthine.
Limits of detection (LODs) and limits of quantification (LOQs) were determined by real spiking experiments and electronically calculating spectra in which different concentrations of the analyte were added to all urine samples from Turkey. Averaging over the total cohort finally gave a rate for true and false detection at given concentration.
Untargeted analysis
Untargeted analysis is used to identify untypical spectroscopic patterns and peaks in the NMR spectrum, be they known or unknown. For this purpose, extensive statistical analysis is necessary. Moreover, a reliable reference data set must be established to represent the normal condition. The initial step is data reduction and preprocessing by the use of the so-called bucketing. Normalized spectra were segmented into n = 900 consecutive integrated spectral regions (buckets) of fixed width, covering the range from 0.5 to 9.5 ppm. This then gives a table in which each line represents a sample and each column represents the intensities within one spectral region (bucket). Each line of the bucket table and hence each sample can be represented by a single point in N-dimensional space.
Statistical Analysis
Principal Component Analysis (PCA) was used to visualize the data and to reduce the number of dimensions for further multivariate statistical analyses. A supervised extension of PCA was used to establish a statistical model of normality in a healthy population of Turkish neonates (Mohammadi et al. 2011; Aygen et al. 2011; Pomerantsev 2008; Vanderginste and Massart 1998). In this approach hierarchical multi-model/soft independent modeling for class analogy (HMM/SIMCA) was used. At the first level, a SIMCA model is built from the complete bucket table. At the second level, the bucket table is divided into two equally large parts and a SIMCA model is derived for each of these. At the third level, the bucket table is divided into four parts. The process is extended until the differences are no longer significant. This process has the advantage to identify both (a) atypical samples and (b) respective atypical deviations in the spectrum.
Additionally, principal component analysis/canonical analysis/k-nearest neighbor (PCA/CA/k-NN) was used if a sample needs to be classified with respect to multiple co-existing classes.
To avoid overfitting the data, extensive validation is needed (Hastie et al. 2009). For example, test set validation divides a bucket table into two parts, one serving as model set and the other as an independent test set. Models are built from the model set only and the test set is classified on this basis. Alternative approaches involve cross-validation and Monte-Carlo embedded cross-validation (MCCV).
Identification of Outliers
In order to establish a reference set for metabolic normality, it is essential to have a procedure for removing atypical samples by outlier detection. In the first step, univariate outliers are detected with respect to the bucket table, indicating buckets with a deviation from normality. In the second step, MCCV is performed for HMM/SIMCA modeling. The modeling is then repeated after the outlier has been removed. The normal model contains 20% outliers, which were used to avoid false-positive results in the newborn screening. Outliers were then tested for an additional multitude of relevant metabolites.
Results
Completeness of Data Collection and Deviations from Study Protocol
With the exception of head circumference, complete demographic data were collected for 727 neonates (75.9%). Deviations from the study protocol were found in 71 of neonates (7.2% of the initial cohort of 989 neonates). These deviations were mainly in gestational age or birth weight.
Center Effects
Center effects were examined with a confusion matrix (Fig. 1) and have to be accepted as a given property of the cohort. As outlined in the methods part, 14 centers distributed over whole Turkey, some of them more than 1,500 km apart, contributed to this study. It has to be anticipated that environmental, ethnical, and even economic factors (compare the city Van in the far east of Turkey with Istanbul) may result in characteristic effects on the metabolic fingerprints resolved by NMR.
Fig. 1.
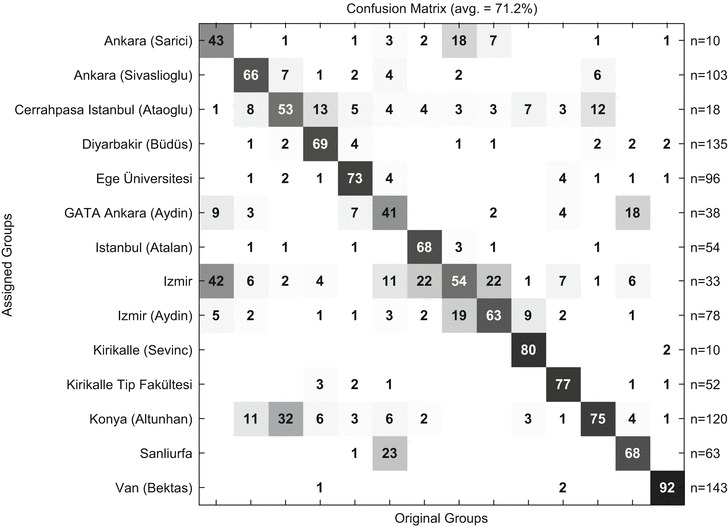
Center prediction from urinary NMR data using 953 INFAI samples as input. The results are summarized in a confusion matrix giving the rates of correct prediction of the respective centers on the diagonal and the rates of false prediction (cross center prediction) in the off diagonal elements of the matrix
Comparison of Spectra in Two Different NMR Laboratories
Nearly all samples were measured twice independently in different laboratories (Bruker and INFAI). The results of this analysis were compared in Fig. 2.
Fig. 2.
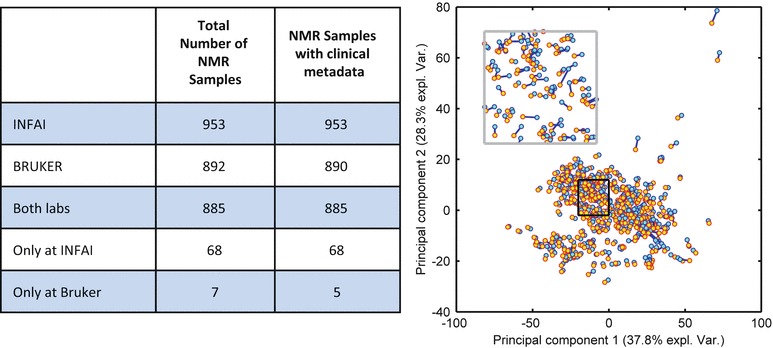
The right figure shows PCA analysis of NMR spectra measured and analyzed at Bruker (600 MHz) and INFAI (500 MHz); each pair of samples is represented by a pair of markers connected by a blue line. The variance explained by principal component 1 and principal component 2 is 37.8% and 28.3%, respectively. The black box is magnified and replotted in the inset at the upper left corner
Reference Ranges
Reference ranges were established for the 20 metabolites that are almost always present in neonatal urine (Table 1). These metabolites are expressed relative to creatinine (except creatinine itself) and these curves can be used to derive percentiles.
LODs and LOQs
The LODs and LOQs are extremely diverse, due to the nature of the metabolites’ NMR signals, the number of protons generating the signal and the spectral regions they are located in. Values for the 95% true detection rate range from 8 for 2-hydroxyisovaleric acid to >>1,000 for citrulline (in mmol/mol creatinine). Due to the so-called confusion potential of heavily overlapped signal regions, the LOD and LOQ determination had to be done individually for every metabolite under investigation.
Outliers: Detection of atypical Samples
A substantial number of the urine samples shows atypical features in their NMR spectra due to, e.g., atypical metabolites, atypical concentrations or atypical concentration ratios and overall signal patterns. Two-hundred and two and 200 samples were identified as outliers in the sample set measured at BRUKER (890 samples: 22.7% outliers) and in the sample set measured at INFAI (953 samples: 21.0% outliers), respectively. They are summarized in Table 2.
Table 2.
List of different classes of outliers and their related atypical deviations
| Type of class | Outlier class | Mmol/mol Crea | Number of outliers | Ppm region | |
|---|---|---|---|---|---|
| Ketosis | 2 | >1,000 | 7 | 2.25–2.45 and 1.18–1.23 | |
| Medication | 3 | \ | 15 | 7.39–7.59 | |
| Panthenol gel | 4 | >100 | 1 | 0.85–0.96 | |
| High concentration of known metabolite | Succinic acid | 5 | >800 | 4 | 2.4–2.42 |
| Acetic acid | 6 | >4,000 | 3 | 1.91–1.94 | |
| Lactic acid | 7 | >1,300 | 3 | 1.31–1.355 | |
| 4-Hydroxyphenyllactic acid | 8 | >900 | 4 | 6.84–6.88 and 7.16–7.20 | |
| 4-Hydroxyphenylacetic acid | 9 | >150 | 2 | 7.15–7.18 | |
| Acetoacetic acid | 10 | >400 | 1 | 2.27–2.29 | |
| Myo-inositol | 11 | >5,000 | 9 | 3.27–3.3 | |
| N,N-Dimethylglycine | 12 | >850 | 1 | 2.92–2.94 | |
| d-Lactose | 13 | >2,000 | 5 | 4.45–4.48 | |
| d-Glucose | 14 | >4,000 | 6 | 4.63–4.67 | |
| Sucrose | 15 | >950 | 1 | 4.2–4.3 | |
| Tiglyglycine | 16 | >800 | 1 | 6.45–6.55 and 1.75–1.85 | |
| N-Phenylacetylglycine | 17 | >50 | 1 | 7.8–7.85 | |
| Salicylurate | 18 | >250 | 1 | 7–7.05 | |
| Threonate | 19 | >1,200 | 1 | 4–4.2 | |
| Gluconate | 20 | >4,500 | 1 | 3.7–4.1 | |
| Propylene glycol | 21 | >700 | 3 | 1.1–1.18 and 3.4–3.6 and 3.85–3.9 | |
| Ethanol | 22 | >11,000 | 1 | 1.18–1.21 | |
| Mannitol | 23 | >1,000 | 1 | 3.6–4 | |
| Proline | 24 | >2,000 | 1 | 1.95–2.1 | |
| Proteinuria | 25 | – | 8 | 0.5–2.5 | |
| Jaundice | 26 | – | 4 | 7.5–7.7 | |
| Unknown signal | Single signal | 28 | 19 | ||
| Multiple signals | 29 | 69 | |||
| Unknown sugars | 30 | 4 | 3–4.5 | ||
The number of outliers refers to the INFAI data set. In about half of the outliers related a-typical signals are not yet identified
The most frequent reasons for classification as an outlier were medication, ketosis, proteinuria, or jaundice, and to a small extent the presence of unknown signals or known signals in unusually high concentrations. Seven ketosis (see Fig. 3), eight proteinuria, four jaundice, and four 4-hydroxyphenyllactic acid cases were confirmed through clinical data.
Fig 3.
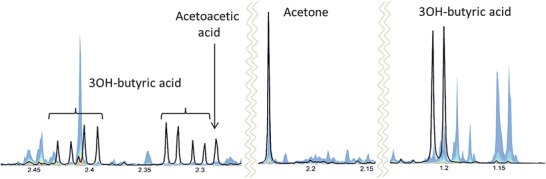
NMR spectrum of a urine sample from a newborn presenting with ketosis (black line). The three markers 3OH-butyric acid, acetoacetic acid and acetone are clearly enhanced as can be seen by comparing to the quantile plot (colored band) representing the normal ranges of spectral intensities in the respective spectral regions
Metabolic Fingerprint of Gender
Differences in the metabolic fingerprint of male and female have been observed and documented in several studies in animals and human studies. To study the gender influence on the metabolic fingerprint in the neonate samples, PCA/CA/k-NN modeling with MCCV validation was done on the spectral subset where gender information is available. It was found that gender modulates the NMR metabolic profile in a characteristic way even in neonates. The rate of correct gender prediction could be estimated to about 77% for male and 63% for female, respectively.
Metabolic Fingerprint of Birth Mode
It can be anticipated that the mode of birth, i.e. spontaneous versus intersection, exposes a strong impact on neonate metabolism during the first days of life. In the subcohort of neonates where birth mode information is available, 49% experienced a spontaneous birth and 51% were delivered by section. PCA/CA/k-NN + MCCV could predict the birth mode from the NMR data at a rate of correct prediction of 66% far above random chance.
Metabolic Fingerprint of Day of Life
The subset of neonates with day of life information was segmented into three classes: class 1 day 0-1, 193 samples; class 2, days 2–4, 317 samples; class 3, days 4–7, 317 samples. PCA/DA/k-NN modeling with MCCV validation of the NMR gave correct prediction for class 1 of 84%, of class 2 59% and of class 3 79% (Assfalg et al. 2008; Bermini et al. 2009).
Untargeted Analysis and Detection of Atypical Samples
PCA was used as a starting point for untargeted analysis in order to get a first impression on the dispersion of the metabolic phenotypes within the cohort (compare Fig. 4).
Fig. 4.
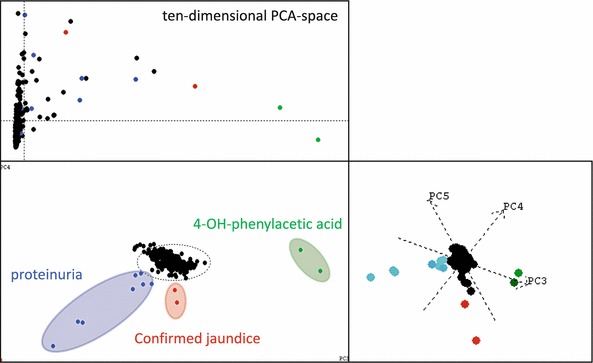
Use of principal component analysis to detect outliers, e.g. proteinuria and confirmed jaundice, as well as 4-OH-phenylacetic acid. The upper left subplot represents the influence plot derived from a 10-dimensional subspace. The lower left plot is the scores plot in principal components 1 and 2. The right plot is the scores plot in PC 3, 4, and 5. Color coding shows the relations of the outlying samples in PC 1, 2 and PC 3, 4, 5. That means, the outlying samples color coded in the figure are outlier in at least a five-dimensional PCA subspace. Proteinuria (blue color) and jaundice (red color) were confirmed in the clinical records of the respective newborns. The figure illustrates, how some of the atypical samples can be easily detected even with a most simple straight forward PCA
Even with this simple approach, some atypical and extremely deviating metabolic profiles could be identified in a straightforward manner, i.e. pathological profiles resulting from enhanced 4-hydroxyphenylacetic acid, or jaundice or proteinuria, respectively. However, for detection of the majority of atypical profiles, PCA turned out to be not appropriate. Instead, MCCV on HMM/SIMCA was needed. As a result, a substantial number of the urine samples shows atypical features in their NMR spectra due to, e.g., atypical metabolites, atypical concentrations or atypical concentration ratios and overall signal patterns. Two-hundred and two and 200 samples were identified as outliers in the sample set measured at BRUKER (890 samples: 22.7% outliers) and in the sample set measured at INFAI (953 samples: 21.0% outliers), respectively. They are summarized in Table 2.
Clinical Discussion of Outliers
Problem of false positive and false negative results should be avoided by classifying outlier groups. Unknown metabolites need additional investigations and different techniques.
In type II and type III tyrosinemia, 3 metabolites: 4-hydroxyphenylacetic acid, 4-hydroxyphenyllactic acid and 4-hydroxyphenylpyruvic acid (Tomoeda et al. 2000) were found in urine, and the amino acid tyrosine must be detectable in plasma (Blau et al. 2003). Figure 5 shows the results from a neonate with possible type II or type III tyrosinemia.
Fig. 5.
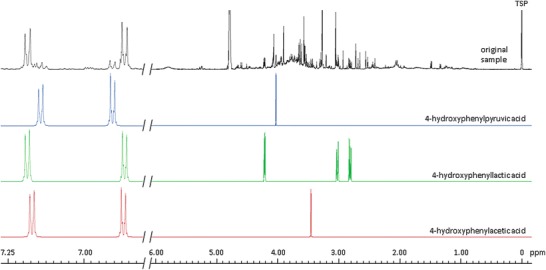
Matching of urine with database spectra of diagnostic metabolites. Urine from a Turkish child with possible type II or type III tyrosinemia, in comparison with 4-hydroxyphenylpyruvic acid, 4-hydroxyphenyllactic acid and 4-hydroxyphenylacetic acid
In type I tyrosinemia additionally to the abovementioned metabolites also 5-aminolevulinic acid should be present, but was not observed. In hawkinsinuria, the first three abovementioned metabolites also appear in urine, but additionally 5-oxoproline and 4-hydroxycyclohexylacetate must be present. However, in this case these metabolites were also not found. Therefore, this neonate may suffer from type II or type III tyrosinemia. Unfortunately, a conclusive diagnosis would only have been possible with a plasma sample, which was not available. Moreover, we have no information on the neonate’s subsequent clinical course.
One of the four neonates with jaundice had to be treated in intensive care in the first week of life. Later, its condition normalized and the neonate could leave the hospital. In eight proteinuria cases, we observed high concentrations of proteins in urine. It is known that some neonates may have a temporary kidney insufficiency after birth. One of the seven cases with ketosis (see Fig. 3) had to be treated.
Discussion
Inborn metabolic diseases can pose a major threat to neonates and to the quality of life of their parents and families. Improved methods of diagnosis and screening may improve diagnosis and detection. Even if the disease is not treatable, the parents are spared the necessity of visiting a long series of physicians in their uncertainty and more rapidly receive reliable advice as to whether they should have further children. Moreover, prenatal diagnosis may then be possible in subsequent pregnancies (Lehotay et al. 2011).
Screening for metabolic disorders may be based on tandem MS (Lehotay et al. 2011; Chace and Kalas 2005) or NMR (Engelke et al. 2008; Wevers et al. 1999). Although tandem-MS is more frequently used, NMR possesses several advantages. In particular, NMR is more reproducible and rapid, one reason being that virtually no sample preparation is required. Tandem-MS is destructive and generally requires prior separation of the metabolites, either by chromatography or capillary electrophoresis (Nicholson et al. 2012). In addition, calibration is easier with NMR, as this can be based on the cumulative data from all measurements. Moreover, limits of quantitation and detection can be derived automatically, without having to use a series of separate samples. Detailed statistical analysis of complete spectra can lead to the identification of novel peaks. An additional advantage is that NMR can be used to monitor treatment success (Dietz et al. 1996).
The aim of the present study was to examine the NMR spectra of 989 Turkish neonates, in order to develop a statistical model for this group. The objectives were to characterize the spectra of healthy neonates, to identify statistical outliers, and to identify the urine spectra of diseased neonates.
The resulting spectra were subjected to both targeted and untargeted analyses. While the untargeted analysis started with no preconceptions about changes in spectra, the targeted analysis concentrated on 20 endogenous metabolites that are always present, together with 45 pathological metabolites that are usually absent in normal samples. The targeted analysis was used to establish distributions for metabolites and to identify inborn errors.
Non-targeted analysis employed the techniques of principal component analysis and HMM/SIMCA modeling. Outliers were tested against reference metabolites. A suspect for type II or type III tyrosinemia was detected in this way (Fig. 5).
Agreement between the two NMR laboratories was good (Fig. 2). Clear center effects were found (Fig. 1). Using the PCA/CA/k-NN approach we demonstrated predictivity with respect to gender, day of life, and birth mode. Although predictivity was above random chance and hence significant, it did not jeopardize the validity of confidence regions derived from the newborn cohort. Non-targeted analysis can be used to detect physiological abnormalities, such as jaundice, ketosis, proteinuria, or raised levels of abnormal metabolites (Fig. 4).
The present report describes the initial characterization and validation of the database resulting from the NMR spectra of 953 urine samples from healthy neonates. Therefore, we developed a statistical normal model of healthy Turkish neonates to allow the identification of statistical outliers and to identify the urine spectra or diseased neonates. Further studies will concentrate on identification of unknown pathological peaks, correlation with clinical parameters, and follow-up measurements, to investigate the evolution of metabolic phenotypes over time.
Acknowledgements
Support from ZIM (Zentrales Innovationsprogramm Mittelstand) is gratefully acknowledged. We also thank our collaborating partners in Turkey, who helped us to execute this study. Altunhan H, Selcuk University, Konya, Turkey; Aydin A, Dokuz Eylül University, Izmir, Turkey; Bektaş MS, Van University, Van, Turkey; Coşkun T, Hacettepe University, Ankara, Turkey; Pehlivanoglu E, International Children Clinic, Istanbul, Turkey; Sanlı C, Diyarbakır Hospital Kadım Doğum, Diyarbakır, Turkey; Sivaslıoğlu S, Etlik Zübeyde Hanım Hospital Kadın Doğum, Ankara, Turkey.
Compliance with Ethics Guidelines
Sitke Aygen, Ulrich Dürr, Peter Hegele and Johannes Kunig, Manfred Spraul, Hartmut Schäfer, David Krings, Claire Cannet, Fang Fang, Birk Schütz, Selda F.H. Bülbül, H. Ibrahim Aydin, S. Ümit Sarıcı, Mehmet Yalaz, Rahmi Örs, Resit Atalan and Oguz Tuncer declare that they have no conflict of interest.
Informed Consent
All procedures followed were in accordance with the ethical standards of the responsible committee on human experimentation (institutional and national) and with the Helsinki Declaration of 1975, as revised in 2000 (5). Informed consent was obtained from the parents or guardians of all patients included in the study.
Footnotes
Competing interests: None declared
Contributor Information
Sitke Aygen, Email: sa@infai.de.
Collaborators: Johannes Zschocke and K Michael Gibson
References
- Assfalg M, Bertini I, Colangiuli D, Luchinat C, Schäfer H, Schutz B, Spraul M. Evidence of different metabolic phenotypes in humans. PNAS. 2008;105:1420–1424. doi: 10.1073/pnas.0705685105. [DOI] [PMC free article] [PubMed] [Google Scholar]
- Aygen S, Spraul M, Schäfer H, et al. Urine based newborn screening study applying high-resolution NMR spectroscopy in Turkey. J Inherit Metab Dis. 2011;34(Suppl 3):S256. [Google Scholar]
- Bernini P, Bertini I, Luchinat C, et al. Individual human phenotypes in metabolic space and time. J Proteome Res. 2009;8:4264–4271. doi: 10.1021/pr900344m. [DOI] [PubMed] [Google Scholar]
- Blau N, Duran M, Blaskovics ME, Gibson KM (2003) Laboratory diagnosis of metabolic diseases (2nd edn, 2nd Printing 2005) Springer-Verlag, Berlin Heidelberg pp 146–147
- Chace DH, Kalas TA. A biochemical perspective on the use of tandem mass spectrometry for new born screening and clinical testing. Clin Biochem. 2005;38:296–309. doi: 10.1016/j.clinbiochem.2005.01.017. [DOI] [PubMed] [Google Scholar]
- Dietz B, Aksu F, Aguigah G, Witting W, Aygen S, Lehnert W, Jakobs C (1996) Vigabatrintherapie bei einem 7jährigen Jungen mit Succinat-Semialdehyd-Dehydrogenase-Mangel. Monatschr Kinderheilkund 144:797–802
- Engelke UFH, Sass JO, Van Coster RN, et al. NMR spectroscopy of aminoacylase 1 deficiency, a novel inborn error of metabolism. NMR Biomed. 2008;21:138–147. doi: 10.1002/nbm.1170. [DOI] [PubMed] [Google Scholar]
- Hasanoglu A, Tümer L, Biberoglu G, Ezgu FS. Ten years experience of a metabolic investigation laboratory in Turkey. Gazi Med J. 2000;11:77–80. [Google Scholar]
- Hastie T, Tibshirani R, Friedman J (2009) The elements of statistical learning. In: Data mining, inference, and prediction, 2nd edn. Springer series in statistics. Springer
- Holmes E, Foxall PJD, Spraul M, Farrant RD, Nicholson JK, Lindon JC. 750 MHz 1H NMR spectroscopy characterisation of the complex metabolic pattern of urine from patients with inborn errors of metabolism: 2-hydroxyglutaric aciduria and maple syrup urine disease. J Pharmaceut Biomed Anal. 1997;15:1647–1659. doi: 10.1016/S0731-7085(97)00066-6. [DOI] [PubMed] [Google Scholar]
- Lehotay DC, Hall P, Lepage J, Eichhorst JC, Etter ML, Greenberg CR. LC-MS/MS progress in newborn screening. Clin Biochem. 2011;44:21–31. doi: 10.1016/j.clinbiochem.2010.08.007. [DOI] [PubMed] [Google Scholar]
- Leonard JV, Morris AA. Diagnosis and early management of inborn errors of metabolism presenting around the time of birth. Acta Paediatr. 2006;95:6–14. doi: 10.1080/08035250500349413. [DOI] [PubMed] [Google Scholar]
- Mohammadi M, Midi H, Arasan J, Al-Talib B. High breakdown estimators to robustify phase II multivariate control charts. J Appl Sci. 2011;11:503–511. doi: 10.3923/jas.2011.503.511. [DOI] [Google Scholar]
- Moolenaar SH, Engelke UFH, Wevers RA. Proton nuclear magnetic resonance spectroscopy of body fluids in the field of inborn errors of metabolism. Ann Clin Biochem. 2003;40:16–24. doi: 10.1258/000456303321016132. [DOI] [PubMed] [Google Scholar]
- Nicholson JK, Holmes E, Kinross JM, Darzi AW, Takats Z, Lindon JC. Metabolic phenotyping in clinical and surgical environments. Nature. 2012;491:384–392. doi: 10.1038/nature11708. [DOI] [PubMed] [Google Scholar]
- Pomerantsev AL. Acceptance areas for multivariate classification derived by projection methods. J Chemometrics. 2008;22:601–609. doi: 10.1002/cem.1147. [DOI] [Google Scholar]
- Saudubray JM, Sedel F, Walter JH. Clinical approach to treatable inborn metabolic diseases: an introduction J Inherit Metab Dis. 2006;29:261–274. doi: 10.1007/s10545-006-0358-0. [DOI] [PubMed] [Google Scholar]
- Scott CR. The genetic tyrosinemias. Am J Med Genet C Semin Med Genet. 2006;142C:121–125. doi: 10.1002/ajmg.c.30092. [DOI] [PubMed] [Google Scholar]
- Tomoeda K, Awata H, Matsuura T, et al. Mutations in the 4-hydroxyphenylpyruvic acid dioxygenase gene are responsible for tyrosinemia type III and hawkinsinuria. Mol Genet Metab. 2000;71:506–510. doi: 10.1006/mgme.2000.3085. [DOI] [PubMed] [Google Scholar]
- Vanderginste BGM, Massart DL, Buydens LMC et al (1998) Handbook of chemometrics and qualimetrics: Part B. Elsevier
- Wevers RA, Engelke UFH, Heerschap A. High resolution 1H-NMR spectroscopy of blood plasma for metabolic studies. Clin Chem. 1994;40:1245–1250. [PubMed] [Google Scholar]
- Wevers RA, Engelke UFH, Moolenaar SH, et al. 1H-NMR spectroscopy of body fluids: inborn errors of purine and pyrimidine metabolism. Clin Chem. 1999;45:539–548. [PubMed] [Google Scholar]