

Abstract
Objective
To compare the prevalence, resource utilization, and mortality for pediatric severe sepsis identified using two established identification strategies.
Design
Observational cohort study from 2004–2012.
Setting
Forty-four pediatric hospitals contributing data to the Pediatric Health Information Systems database.
Patients
Children ≤18 years of age.
Measurements and Main Results
We identified patients with severe sepsis or septic shock by using two International Classification of Diseases, 9th edition-Clinical Modification (ICD9-CM) based coding strategies: 1) combinations of ICD9-CM codes for infection plus organ dysfunction (combination code cohort); 2) ICD9-CM codes for severe sepsis and septic shock (sepsis code cohort). Outcomes included prevalence of severe sepsis, as well as hospital and intensive care unit (ICU) length of stay (LOS), and mortality. Outcomes were compared between the two cohorts examining aggregate differences over the study period and trends over time. The combination code cohort identified, 176,124 hospitalizations (3.1% of all hospitalizations), while the sepsis code cohort identified 25,236 hospitalizations (0.45%), a 7-fold difference. Between 2004 and 2012, the prevalence of sepsis increased from 3.7% to 4.4% using the combination code cohort and from 0.4% to 0.7% using the sepsis code cohort (p<0.001 for trend in each cohort). LOS (hospital and ICU) and costs decreased in both cohorts over the study period (p<0.001). Overall hospital mortality was higher in the sepsis code cohort than the combination code cohort (21.2%, (95% CI: 20.7–21.8 vs. 8.2%,(95% CI: 8.0–8.3). Over the 9 year study period, there was an absolute reduction in mortality of 10.9% (p<0.001) in the sepsis code cohort and 3.8% (p<0.001) in the combination code cohort.
Conclusions
Prevalence of pediatric severe sepsis increased in the studied US children’s hospitals over the past 9 years, though resource utilization and mortality decreased. Epidemiologic estimates of pediatric severe sepsis varied up to 7-fold depending on the strategy used for case ascertainment.
Keywords: Pediatrics, Sepsis, Critical Care, Epidemiology
Introduction
Pediatric sepsis syndrome is a leading source of morbidity, mortality, and health care costs in infants and children in the United States. (1) Accurate and consistent estimates of the national prevalence of and outcomes from pediatric sepsis are critical for distribution of limited health care resources, assignment of research priorities, and uniform benchmarking of publicly reported quality metrics across geographic regions and hospital systems. (2,3)
In 2005, an international consensus conference published specific criteria to define the spectrum of the pediatric systemic inflammatory response syndrome (SIRS), sepsis, severe sepsis, and septic shock. (4–6) These pediatric-specific definitions standardized criteria for diagnosis and enrollment into research studies. However, these consensus criteria are challenging to use for epidemiologic estimates of pediatric sepsis, because their application requires extensive and complex medical record review. As a practical alternative, identification of pediatric cases of severe sepsis and septic shock has relied on International Classification of Diseases, Ninth Revision, Clinical Modification (ICD9-CM) (7) in large administrative databases. (8–10)
Prior to 2003, specific ICD9-CM codes that matched the consensus terminology of severe sepsis or septic shock were not available. Angus et al. combined ICD9-CM codes for a bacterial or fungal infection with codes for acute organ dysfunction to study the epidemiology of severe sepsis in adults from seven state hospital discharge databases.2 They validated this approach by comparing patient characteristics from a prospectively identified cohort with severe sepsis at the same hospitals. This combination strategy has also been used in pediatric severe sepsis, although specific pediatric validation is lacking. (8,9) In 2003, explicit codes for severe sepsis (995.92) and septic shock (785.52) were added to the revised ICD-9 CM schema. (7) The impact of these new coding options on epidemiologic assessments of pediatric severe sepsis are not known, but two recent studies suggest that unique patient subsets are identified using the combination strategy versus sepsis specific codes. (11, 12) In a single center study of 1729 pediatric patients admitted to an academic pediatric intensive care unit, 103 patients were identified using ICD9-CM codes for either infection plus organ dysfunction or severe sepsis/septic shock, but only 13 of these cases (12.6%) were identified by both coding strategies. (12) Gaieski et al. found a 3.5-fold difference in the average annual incidence of adult severe sepsis/septic shock and a 2-fold difference in sepsis mortality using different ICD9-CM abstraction methodologies. (11)
The studies that utilized the ICD9-CM combination strategy developed by Angus et al to report US pediatric sepsis epidemiology did not include patients coded for severe sepsis (995.92). (8,9,10) Despite a 25.3% increase in the use of the 995.92 ICD9-CM code, only 14.4% of adult sepsis patients identified using the combination strategy were assigned this code in a prior study. (11) Moreover, in-hospital mortality for adults coded with severe sepsis (995.92) and septic shock (785.52) was 36.9% and 42.2%, respectively, which was higher than the 28.6% mortality reported by Angus et al. using the combination code strategy. (2) These data raise concern that a growing number of pediatric patients, those most at risk for mortality from sepsis, may not be adequately captured in studies using the combination strategy, leading to underestimates of the national burden of pediatric sepsis mortality.
The objective of this study was to compare epidemiological trends in the prevalence, resource utilization, and mortality of pediatric patients with severe sepsis and septic shock using two established ICD9-CM sepsis identification strategies.
Methods
Design and Data Source
We conducted an observational cohort study using data from the Pediatric Health Information Systems (PHIS) database from 2004–2012. The PHIS database contains clinical and administrative data from inpatient hospitalizations from 44 US children’s hospitals. Data quality and coding reliability are closely monitored through a joint effort between the Children’s Hospital Association (CHA, Overland Park, KS) and participating hospitals, as previously described. (13,14) This use of a de-identified dataset was not considered human subjects research in accordance with the Common Rule (45 CFR 46.102(f)) and the policies of the Children’s Hospital of Philadelphia Institutional Review Board.
Case Selection and Definitions
Hospital admissions of children ≤ 18 years of age with severe sepsis (including septic shock) were identified from the PHIS database between 2004 and 2012 using two ICD9-CM coding strategies. ICD9-CM codes were selected as indexed in the ICD9-CM, Ninth Revision. (7) The combination code cohort was identified following the method described by Angus et al. using ICD9-CM codes for infection plus ICD9-CM codes for organ dysfunction (see Appendix 1 for list of codes used). (2) The sepsis codes cohort was identified using ICD9-CM codes introduced in 2003 specific for severe sepsis (995.92), and septic shock (785.52). For each hospitalization, we collected age, race, sex, hospital and intensive care unit (ICU) length of stay (LOS), total adjusted hospital costs, and whether the patient died of any cause during the hospitalization. To identify the presence of underlying complex chronic conditions, we used the pediatric Complex Chronic Conditions (CCC) classification, (15) an ICD9-CM based system to classify comorbid disease processes into the following nine categories: malignancy, hematology/immune, respiratory, gastrointestinal, metabolic, neuromuscular, cardiovascular, renal, and other congenital abnormalities. Patients were then categorized as having zero, one, two, or three or more CCCs. Costs were estimated using hospital specific cost-to-charge ratios and adjusted for geographic region using the Centers for Medicaid and Medicare Price/Wage Index. (16) We explored age-specific subgroups defined as <60 days old, 60 days-<1 year, 1–4 years, 5–9 years, 10–14 years, and 15–18 years because of known differences in age related sepsis onset, resource utilization, and mortality rates. (8,10) Patients <60 days old were analyzed separately from older infants as sepsis in young infants can be associated with unique pathogens, pathophysiology, and clinical management.
Outcomes
The primary outcome was the annual percentage of hospitalizations with severe sepsis (prevalence) for each coding strategy. Secondary outcomes were ICU admission, ICU and hospital LOS, costs, and all-cause in-hospital mortality annually determined for each coding strategy. Costs were adjusted for inflation and are presented as 2012 dollars.
Data Analysis
We summarized continuous variables using median and interquartile range (IQR), and categorical variables using counts and percentages. Wilcoxon rank sum tests and Hodges-Lehman estimators were used to compare continuous data, and chi-square tests were used to compare categorical data between the two cohorts. As we anticipated that a proportion of sepsis events to be identified by both coding strategies, 95% confidence intervals around point estimates, as observations were not independent. When independence of populations was feasible, we determined odds ratios with 95% confidence intervals for binary outcomes or the Hodges-Lehman estimator to generate median difference with 95% confidence intervals for continuous variables. All statistical analyses were conducted using SAS v9.2 (SAS Institute, Cary, NC), and p values <0.05 were considered statistically significant.
Results
Prevalence
Over the nine year study period, we identified 176,124 hospitalizations (3.2% of total database population) representing 136,382 unique patients in the combination codes cohort. We identified 25,236 hospitalizations (0.5% of total) representing 22,985 unique patients in the sepsis codes cohort. There was a seven-fold difference in the estimated prevalence of pediatric sepsis between the two identification methods (Figure 1a). Demographic characteristics of the combination code and sepsis code cohorts are presented in Table 1. The cohorts had similar distributions of race and sex, but the combination cohort had a greater proportion of patients in the youngest age range of 0–60 days (23.7 vs. 18.3%). The proportion of patients with at least one comorbid CCCs was similar in the combination code and sepsis code cohorts (74% vs. 70%).
Figure 1. Sepsis prevalence.

a. Number of sepsis codes in each cohort. The combination code cohort has International Classification of Diseases 9th Revision (ICD9) codes for infection plus organ dysfunction; the sepsis code cohort has ICD9 codes for severe sepsis or septic shock. b. Proportion of sepsis hospitalizations in the Pediatric Health Information Systems (PHIS) database from 2004–2011.
Table 1. Sepsis Prevalence, Resource Utilization, Mortality.
of sepsis codes in both cohorts. The combination code cohort has ICD9 codes for infection plus organ dysfunction; the sepsis code cohort has ICD9 codes for severe sepsis or septic shock. Complex chronic care conditions are previously defined (Feudtner 2001). Costs are presented as 2012 dollars.
| Combination Code Cohort, n (%) | Sepsis Code Cohort, n (%) | ||
|---|---|---|---|
| Hospitalizations, N | 176,124 | 25,236 | |
| Patients, N | 136,382 | 22,985 | |
| Age | 0–59 days | 41,970 (23.8) | 4,656 (18.4) |
| 60 days-<1 year | 28,910 (16.4) | 3,688 (14.6) | |
| 1–4 years | 39,341 (22.3) | 5,273 (20.9) | |
| 5–9 years | 22,149 (12.6) | 3,358 (13.3) | |
| 10–14 years | 23,514 (13.4) | 4,274 (16.9) | |
| 15–18 years | 20,240 (11.5) | 3,987 (15.8) | |
| Race | Non-Hispanic White | 83,551 (47.4) | 12,330 (48.9) |
| Non-Hispanic Black | 33,750 (19.2) | 4,560 (18.1) | |
| Hispanic | 32,057 (18.2) | 4,455 (17.7) | |
| Asian | 4,537 (2.6) | 697 (2.8) | |
| Other | 22,229 (12.6) | 3,194 (12.7) | |
| Sex | Female | 11,733 (46.5) | 80,305 (45.6) |
| Patients with chronic complex conditions | 130,566(74.1) | 17,742(70.3) | |
| Hospital mortality | 8.2 (8.0, 8.3) | 21.2 (20.7, 21.8) | |
| ICU admission | 73.3 (73.1, 73.5) | 90.9 (90.5, 91.2) | |
| PICU | 57.8 (57.5, 58.0) | 81.0 (80.4, 81.4) | |
| NICU | 19.0 (18.7, 19.1) | 12.6 (12.2, 13.0) | |
| Hospital LOS (days) | 15.0 (3.0, 39.0) | 16.0 (8.0, 37.0) | |
| ICU LOS (days) | 2.0 (0.0, 10.0) | 5.0 (1.0, 14.0) | |
| Hospitalization cost | 70395.1 (24466.2, 194675.7) | 85319 (34871.5, 224089.6) | |
Abbreviations: ICU (Intensive Care Unit); PICU (Pediatric Intensive Care Unit); NICU (Neonatal Intensive Care Unit), LOS (length of stay)
Between 2004 and 2012, the prevalence of sepsis increased from 3.7 to 4.4 % in the combination code cohort and from 0.4 to 0.7% in the sepsis code cohort (p<0.001 for trend for both cohorts, Figure 1b). Over this time period, the use of codes for severe sepsis (995.92) and septic shock (785.51) increased by 7.8% and 2.6% annually. Overall, 1801 (0.9%) hospitalizations identified using the sepsis specific codes were not identified by the combination strategy.
Resource Utilization
A majority of patients identified with both coding strategies were hospitalized in the ICU (Table 1), though a higher proportion of patients in the sepsis code cohort had ICU hospitalizations compared to the combination code cohort (90.9%, 95% CI: 90.5–91.2 vs.73.3%, 95% CI: 73.1–73.5). Median ICU LOS was 5 days (IQR 1–14) for the sepsis code cohort compared to 2 days (IQR 0–10) for the combination code cohort. Median hospital LOS was 16 days (IQR 8–37) for the sepsis code cohort compared to 15 days (IQR 3–39) for the combination code cohort (Table 1). Median hospital and ICU LOS decreased in both cohorts over the study period (p<0.001, Figure 2a and b).
Figure 2. Resource utilization and mortality over time.

a. Hospital length of stay (LOS), b. Intensive Care Unit (ICU) LOS. c. cost, and d. mortality in each cohort. ICU and Hospital LOS are calculated in days, cost is in median dollars per patient per hospitalization. Costs are presented as 2012 dollars. p<0.05 for trend for both cohorts.
Median hospital costs per patient were $65,624 (IQR 27,300-169,624) for the sepsis code cohort compared to $52,888 (IQR 18,765–144,421) for the combination code cohort. (Table 1) Both cohorts demonstrated a decreasing cost trend over the study period (p<0.001, Figure 2c).
Hospital LOS, ICU LOS, and cost were compared between the subjects < 60 days of age and ≥ 60 days of age, (Table 2) and also by the number of comorbid CCCs present in both cohorts (Table 2). We observed increased resource utilization in the < 60 day age group as well as in patients with increasing numbers of comorbid CCCs.
Table 2. Resource utilization and mortality in young infants.
Differences are presented as odds ratios (OR) for proportional variables (mortality, proportion in Intensive Care Unit (ICU), and any comorbidity), and as differences in medians for continuous variables (Hospital length of stay (LOS), ICU LOS, and cost). Costs are presented as 2012 dollars.
| <60 days old, % (95% CI) | ≥60 days old, % (95% CI) | OR (95% CI) or Difference in Medians (95% CI) | ||
|---|---|---|---|---|
| Combination Codes Cohort | Patients, N (%) | 41,711 (23.7) | 134,413 (76.3) | |
| % Mortality | 12.9 (12.5, 13.2) | 6.7 (6.6, 6.9) | 2.0 (2.0, 2.1) | |
| % ICU | 91.7 (91.5, 92.0) | 67.6 (67.4, 67.9) | 5.3 (5.1, 5.5) | |
| Any Comorbidity | 78.0 (77.6, 78.4) | 72.9 (72.7, 73.2) | 1.3 (1.3, 1.4) | |
| Hospital LOS, days | 47.0 (18.0, 93.0) | 12.0 (5.0, 27.0) | 28.0 (27.0, 28.0) | |
| ICU LOS, days | 29.0 (9.0, 75.0) | 3.0 (0.0, 11.0) | 22.0 (21.0, 22.0) | |
| Cost, dollars | 191,743.5 (79503.4, 374330.3) | 50,980 (18849.9, 135777.2) | 106,618.6 (104851.7, | |
| Sepsis Codes Cohort | Patients, N (%) | 4,628 (18.3) | 20,608 (81.7) | |
| % Mortality | 35.7 (34.3, 37.1) | 18.0 (17.5, 18.5) | 2.5 (2.4, 2.7) | |
| % ICU | 93.5 (92.7, 94.2) | 90.3 (89.9, 90.7) | 1.5 (1.4, 1.8) | |
| Any Comorbidity | 67.6 (66.2, 68.9) | 70.9 (70.3, 71.5) | 0.9 (0.8, 0.9) | |
| Hospital LOS, days | 24.0 (10.0, 71.0) | 15.0 (7.0, 33.0) | 7.0 (6.0, 8.0) | |
| ICU LOS, days | 14.5 (4.0, 50.0) | 5.0 (2.0, 15.0) | 7.0 (6.0, 8.0) | |
| Cost, dollars | 120,253 (46314.4, 322879) | 78,946.1 (33223, 204504.9) | 25,229.7 (21951.3, 28630.1) | |
Mortality
Hospital mortality for pediatric severe sepsis/septic shock hospitalizations was 2.6 times higher for the sepsis cohort compared to the combination cohort [(21.2%, (95% CI: 20.7–21.8) vs 8.2%, (95% CI: 8.0–8.3)] (Table 1). From 2004 to 2012, mortality rates decreased from 27.8% to 16.9% in the sepsis code cohort (p<0.001) and from 10.6% to 6.8% in the combination code cohort (p<0.001). We observed the highest mortality in the subset of hospitalizations that were identified only by sepsis codes and not by combination codes (groups C vs. A in Figure 3), with odds ratio for death of 6.6 (95% CI 5.9, 7.3) compared to combination code only subjects. The subset of combination cohort patients who were also identified with sepsis specific codes exhibited increased mortality compared to those patients identified using only the combination codes (groups B vs. A in Figure 3) with an OR of 3.3 (95% CI 3.1, 3.4).
Figure 3. Mortality in patient subsets.
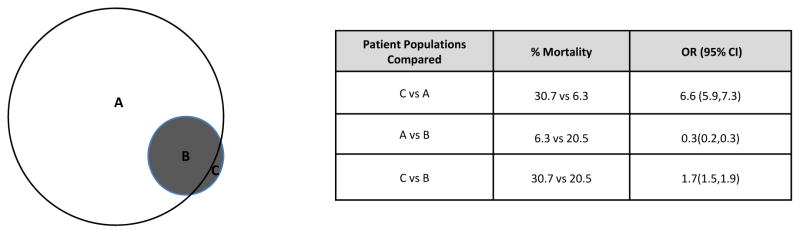
A is patients with combination codes not sepsis codes; B is patients with combination and sepsis codes ; C is patients with sepsis codes not combination codes. Odds Ratios (OR) are presented with accompanying 95% confidence intervals (95% CI).
Mortality for patients < 60 days of age was 1.9 times higher than for patients ≥ 60 days of age in both cohorts (Table 2). During the study period, a decrease in mortality was observed across all age strata (p<0.001) (Supplemental Figure). Mortality was higher in patients with at least one CCC compared to patients without any CCC in both the combination code cohort (OR 1.9, 95% CI 1.8, 2.0) and the sepsis code cohort (OR 1.7, 95% CI 1.6, 1.8) (Table 2).
Discussion
We found that the prevalence of severe sepsis/septic shock has increased in the studied US children’s hospitals between 2004 and 2012, while resource utilization and mortality have decreased over that time period. We also demonstrated that estimates of sepsis prevalence, resource utilization, and mortality were substantially impacted by the strategy used to identify patients. Notably, the combination code strategy identified a cohort of patients that was more than 7-fold larger than the cohort identified using the sepsis code strategy, but with a 2.6 fold lower mortality rate. In addition, the sepsis code strategy identified a cohort that had increased utilization in each dimension of ICU admission, hospital LOS, ICU LOS, and costs. This demonstrates that epidemiological estimates of pediatric sepsis in the US differ substantially depending on the identification strategy. The use of the combination code strategy identifies large numbers of patients, of whom the vast majority survive. However, the use of sepsis specific codes identifies a smaller group of patients with significantly higher mortality. Reconciling these differences and determining which method most accurately identifies true pediatric sepsis cases using administrative data will be critical moving forward nationally as scarce resources are allocated and clinical benchmarking targets are developed.
Our estimates and longitudinal trends of prevalence and mortality add to those of a recent study that used the combination coding strategy. (10) Our study of 44 large children’s hospitals found a similar mortality (8.2%) for patients with severe sepsis/septic shock identified by the combination code strategy. However, we found a significantly higher mortality (21%) when sepsis specific codes were used to capture case. Additionally, we found an important subset of patients with especially high mortality (30.7%) that was only identified utilizing the specific ICD9-CM codes for severe sepsis (995.92), and missed by the combination code strategy. This finding raises concern that utilization of the combination strategy alone may underestimate true case fatality in pediatric severe sepsis/septic shock. In support of this notion, PICU based studies that identified cases using chart review rather than ICD9-CM codes have reported mortality closer to 15–30% for pediatric severe sepsis. (17–20) Although simply adding code 995.92 to the combination code strategy could better capture severe sepsis mortality, the possibility for diluting estimates from the large number of combination cohort patients labeled as having severe sepsis remains. This is supported by a recent study, which demonstrated that adult sepsis mortality rates using the combination code identification method with the severe sepsis code included were lower than those observed either in clinical trials or an alternative administrative method described by Martin. (11)
Our findings are consistent with a recently published study in adults (11) which queried a large national database, and a single center analysis of pediatric sepsis (17) in that two established and commonly used ICD9-CM based methods for identifying severe sepsis and septic shock identify different patient populations. Gaieski et al showed as high as 3.5 fold differences in sepsis incidence, and a two-fold difference in sepsis mortality depending on coding strategy used. (11) In a single center study of 1729 pediatric ICU admissions, 103 patients had sepsis using ICD9-CM code based definitions. Of these, 48 were identified using combination codes and 65 using sepsis specific codes, with only 13% overlap between the two groups. (12) These differences do not appear to be limited to sepsis, as outcome differences based on ICD9-CM coding strategies have also been reported in adults with pneumonia and respiratory failure. (21,22)
It is not clear if the overall increase in sepsis prevalence and decreased in mortality represents an epiphenomenon related to an increase in assigning sepsis codes to less severely ill patients or represents a true decrease in pediatric sepsis epidemiology. There have been multiple national efforts across the country to improve sepsis care for children over the last decade, which may help to explain our findings. The Society for Critical Care Medicine (SCCM) introduced guidelines for pediatric sepsis care in 2002, which were revised in 2007 and again with the most recent Surviving Sepsis Campaign Guidelines. (23–25) Since the guidelines were first introduced, a number of institutions have developed severe sepsis clinical practice guidelines, and have been able to demonstrate improved time to key sepsis interventions and outcomes with increased adherence to guideline recommendations.(26–28) In addition, the national Surviving Sepsis Campaign has raised awareness across the nation regarding the importance of rapid recognition and treatment of sepsis, which may also contribute to improved outcomes. However, our findings of decreased mortality are only temporally correlated with these environmental changes and do not prove causality. Investigations to assess whether individual hospital characteristics such as presence of sepsis clinical guidelines and pathways improve outcomes are imperative.
The high proportion of patients with CCCs in this sample (70–77% in this study depending on identification method) compared with national estimates (49% in previous studies by Watson/Angus) (8) may reflect the complexity of patients at PHIS hospitals. Similar to previous results, we also demonstrate increased mortality in patients with CCCs compared to patients without, and that increasing numbers of CCCs correlates with increasing mortality.
Another unique aspect of this study is that it is the first pediatric sepsis study to our knowledge that evaluates differences in patient outcome by analyzing the youngest infant (<60 days) age group separately. As neonatal sepsis is thought to involve unique pathogens and pathophysiology, it is important to determine whether changes in sepsis outcomes are more attributable to changes within this particularly vulnerable and unique patient subset. Mortality in <60 day old patients was as high as 47.6% in 2004, and in 60 days old to 1 year old patients was as high as 31.8%. We demonstrated that although mortality rates are highest in the young infant subgroup, that the mortality difference we observe between the combination codes cohort and the sepsis codes cohort is preserved with or without the young infant age group included.
There are several limitations to this study. The process for assigning ICD9-CM codes is not standardized between institutions, and therefore misclassification of sepsis is a possible source of error in this and other similar studies. For example, sepsis related codes could have been assigned when in fact sepsis was not clinically present, or the reverse might occur. This is unlikely to have a differential impact on one identification strategy versus the other. Future studies are needed to validate the coding strategies used and identify differences in coding practices between hospitals. Additionally, mortality estimates could be underestimated if patients were transferred from the study institution prior to death. This is unlikely given the fact that the tertiary care pediatric centers in the PHIS database have low rates of transferring patients out to other institutions. Finally, we reported our assessment of costs in standardized cost dollars, which are not the actual dollars spent. These cost estimates are, however, comparable across hospitals and may be closer to real expenditures than charges. (29)
In conclusion, we found that estimates of the prevalence, resource utilization, and mortality of pediatric patients with severe sepsis in US children’s hospitals are highly variable depending on the method used. These discrepancies need to be considered in decisions about distribution of health care resources, assignment of research priorities, and benchmarking across geographic regions and hospital systems. Despite this variability, overall prevalence has increased over time, while mortality and resource utilization have decreased. Future studies that validate administrative diagnostic coding algorithms with clinical chart review are needed to determine the best strategy to accurately identify and track prevalence, resource utilization, and outcomes of pediatric severe sepsis.
Supplementary Material
Table 3. Resource utilization and mortality in subjects with underlying medical conditions.
Differences are presented as odds ratios (OR) for proportional variables (mortality, proportion in ICU, and any comorbidity), and as differences in medians for continuous variables (Hospital length of stay (LOS), ICU LOS, and cost). Costs are presented as 2012 dollars.
| Number of Chronic Complex Conditions, % (95% CI) | OR (95%CI) or Difference in Medians (95% CI) |
|||||
|---|---|---|---|---|---|---|
| 0 | 1 | 2 | 3+ | |||
| Combination Codes Cohort | Patients, N (%) | 45,558 (25.9) | 69,844 (39.7) | 41,414 (23.5) | 19,308 (11.0) | |
| % Mortality | 5.1 (4.9, 5.3) | 7.8 (7.6, 8.0) | 10.0 (9.7, 10.3) | 12.9 (12.5, 13.4) | 1.9 (1.8, 2.0) | |
| % ICU | 71.3 (70.8, 71.7) | 69.7 (69.4, 70.1) | 76.9 (76.5, 77.3) | 83.6 (83.1, 84.1) | 1.2 (1.1, 1.2) | |
| Hospital LOS, days | 10.0 (4.0, 19.0) | 14.0 (6.0, 35.0) | 23.0 (9.0, 59.0) | 38.0 (14.0, 88.0) | 7.5 (7.0, 8.0) | |
| ICU LOS, days | 3.0 (0.0, 9.0) | 4.0 (0.0, 17.0) | 9.0 (1.0, 33.0) | 17.0 (3.0, 58.0) | 2.5 (2.0, 3.0) | |
| Cost, dollars | 37,887.9 (15,808.3, 87,560.1) | 66,405.6 (22,999.8, 175,842.9) | 114,852.2 (39,351.5, 277,564.5) | 183,305.4 (66,072.4, 398,387.4) | 39,516.9 (38,504.9, 40,528.8) | |
| Sepsis Codes Cohort | Patients, N (%) | 7,494 (29.7) | 9,740 (38.6) | 5,389 (21.4) | 2,613 (10.4) | |
| % Mortality | 15.6 (14.8, 16.4) | 21.6 (20.8, 22.5) | 25.3 (24.2, 26.5) | 27.6 (25.9, 29.4) | 1.7 (1.6, 1.8) | |
| % ICU | 89.5 (88.8, 90.2) | 90.2 (89.6, 90.8) | 92.3 (91.6, 93.0) | 94.1 (93.1, 95.0) | 1.3 (1.1, 1.4) | |
| Hospital LOS, days | 11.0 (5.0, 21.0) | 16.0 (7.0, 35.0) | 23.0 (10.0, 53.0) | 36.0 (15.0, 81.0) | 7.0 (7.0, 8.0) | |
| ICU LOS, days | 4.0 (1.0, 11.0) | 6.0 (2.0, 17.0) | 10.0 (3.0, 28.0) | 17.0 (5.0, 50.0) | 2.0 (2.0, 3.0) | |
| Cost, dollars | 51,198.7 (23,839.5, 118,621.1) | 84,934.2 (35,404.8, 211,439.1) | 127,272.2 (519,46.4, 315,519.5) | 201,981.6 (786,41.4, 454,008.4) | 41,690 (39,039.4, 44,341.0) | |
Acknowledgments
Funding Source: Dr. Balamuth received career development support from NIH NHLBI K12-HL109009. Dr Weiss received support from the National Institutes of Health grant K12-HD047349. The funders were not involved in design and conduct of the study; collection, management, analysis, interpretation of the data; preparation, review, or approval of the manuscript.
The authors gratefully acknowledge Katie Hayes, BA of The Children’s Hospital of Philadelphia for her assistance with manuscript preparation.
Footnotes
Reprints will not be ordered.
Data Integrity
None of the authors of this manuscript have any conflicts of interest to report. The use of the de-identified dataset in this study was not considered human subjects research in accordance with the Common Rule (45 CFR 46.102(f)) and the policies of the Children’s Hospital of Philadelphia Institutional Review Board. Matt Hall had full access to all of the data in the study and takes responsibility for the integrity of the data and the accuracy of the data analysis, and conducted the data analysis.
References
- 1.National Vital Statistics System, Natioanl Center for Health Statistics, Centers for Disease Control and Prevention. 2010 [Google Scholar]
- 2.Angus DC, Linde-Zwirble WT, Lidicker J, Clermont G, Carcillo J, Pinsky MR. Epidemiology of severe sepsis in the United States: analysis of incidence, outcome, and associated costs of care. Crit Care Med. 2001;29:1303–1310. doi: 10.1097/00003246-200107000-00002. [DOI] [PubMed] [Google Scholar]
- 3.Marshall JC. Sepsis: rethinking the approach to clinical research. J Leukoc Biol. 2008;83:471–482. doi: 10.1189/jlb.0607380. [DOI] [PubMed] [Google Scholar]
- 4.Geroulanos S, Douka ET. Historical perspective of the word “sepsis”. Intensive Care Med. 2006;32:2077. doi: 10.1007/s00134-006-0392-2. [DOI] [PubMed] [Google Scholar]
- 5.Levy MM, Fink MP, Marshall JC, et al. 2001 SCCM/ESICM/ACCP/ATS/SIS International Sepsis Definitions Conference. Intensive Care Med. 2003;29:530–538. doi: 10.1007/s00134-003-1662-x. [DOI] [PubMed] [Google Scholar]
- 6.Goldstein B, Giroir B, Randolph A. International pediatric sepsis consensus conference: definitions for sepsis and organ dysfunction in pediatrics. Pediatr Crit Care Med. 2005;6:2–8. doi: 10.1097/01.PCC.0000149131.72248.E6. [DOI] [PubMed] [Google Scholar]
- 7.Hart A, Stegman M, Ford B, editors. International Classification of Diseases 9th Revision Clinical Modification. 6. Salt Lake City: OptumInsight, Inc; 2012. [Google Scholar]
- 8.Watson RS, Carcillo JA, Linde-Zwirble WT, Clermont G, Lidicker J, Angus DC. The epidemiology of severe sepsis in children in the United States. Am J Respir Crit Care Med. 2003 Jan;167:695–701. doi: 10.1164/rccm.200207-682OC. [DOI] [PubMed] [Google Scholar]
- 9.Odetola FO, Gebremariam A, Freed GL. Patient and hospital correlates of clinical outcomes and resource utilization in severe pediatric sepsis. Pediatrics. 2007;119:487–494. doi: 10.1542/peds.2006-2353. [DOI] [PubMed] [Google Scholar]
- 10.Hartman ME, Linde-Zwirble WT, Angus DC, Watson RS. Trends in the epidemiology of pediatric severe sepsis. Pediatr Crit Care Med. 2013;14:686–693. doi: 10.1097/PCC.0b013e3182917fad. [DOI] [PubMed] [Google Scholar]
- 11.Gaieski DF, Edwards JM, Kallan MJ, Carr BG. Benchmarking the incidence and mortality of severe sepsis in the United States. Crit Care Med. 2013;41:1167–1174. doi: 10.1097/CCM.0b013e31827c09f8. [DOI] [PubMed] [Google Scholar]
- 12.Weiss SPB, Bullock M, et al. Defining pediatric sepsis by different criteria: Discrepancies in populations and implications for clinical practice. Pediatric Critical Care Medicine. 2012;13:e219–226. doi: 10.1097/PCC.0b013e31823c98da. [DOI] [PubMed] [Google Scholar]
- 13.Steinberg DM, Fine J, Chappell R. Sample size for positive and negative predictive value in diagnostic research using case-control designs. Biostatistics. 2009 Jan;10(1):94–105. doi: 10.1093/biostatistics/kxn018. [DOI] [PMC free article] [PubMed] [Google Scholar]
- 14.Mongelluzzo J, Mohamad Z, Ten Have TR, Shah SS. Corticosteroids and mortality in children with bacterial meningitis. JAMA. 2008;299:2048–2055. doi: 10.1001/jama.299.17.2048. [DOI] [PubMed] [Google Scholar]
- 15.Feudtner C, Hays RM, Haynes G, Geyer JR, Neff JM, Koepsell TD. Deaths attributed to pediatric complex chronic conditions: national trends and implications for supportive care services. Pediatrics. 2001;107(6):E99. doi: 10.1542/peds.107.6.e99. [DOI] [PubMed] [Google Scholar]
- 16.Centers for Medicare and Medicaid Services Wage Index Home Page. 2013 www.cms.gov.
- 17.Weiss SL, Parker B, Bullock ME, et al. Defining pediatric sepsis by different criteria: Discrepancies in populations and implications for clinical practice. Pediatr Crit Care Med. 2012;13:e219–226. doi: 10.1097/PCC.0b013e31823c98da. [DOI] [PubMed] [Google Scholar]
- 18.Jaramillo-Bustamante JC, Marin-Agudelo A, Fernandez-Laverde M, Bareno-Silva J. Epidemiology of sepsis in pediatric intensive care units: first Colombian multicenter study. Pediatr Crit Care Med. 2012;13:501–508. doi: 10.1097/PCC.0b013e31823c980f. [DOI] [PubMed] [Google Scholar]
- 19.Kutko MC, Calarco MP, Flaherty MB, et al. Mortality rates in pediatric septic shock with and without multiple organ system failure. Pediatr Crit Care Med. 2003;4:333–337. doi: 10.1097/01.PCC.0000074266.10576.9B. [DOI] [PubMed] [Google Scholar]
- 20.Nadel S, Goldstein B, Williams MD, et al. Drotrecogin alfa (activated) in children with severe sepsis: a multicentre phase III randomised controlled trial. Lancet. 2007;369:836–843. doi: 10.1016/S0140-6736(07)60411-5. [DOI] [PubMed] [Google Scholar]
- 21.Ruhnke GW, Coca Perraillon M, Cutler DM. Mortality reduction among pneumonia patients still substantial despite the impact of coding changes. Am J Med. 2013;126:266–269. doi: 10.1016/j.amjmed.2012.08.006. [DOI] [PubMed] [Google Scholar]
- 22.Lindenauer PK, Lagu T, Shieh MS, Pekow PS, Rothberg MB. Association of diagnostic coding with trends in hospitalizations and mortality of patients with pneumonia, 2003–2009. JAMA. 2012;307:1405–1413. doi: 10.1001/jama.2012.384. [DOI] [PubMed] [Google Scholar]
- 23.Carcillo JA, Fields AI. Clinical practice parameters for hemodynamic support of pediatric and neonatal patients in septic shock. Crit Care Med. 2002;30:1365–1378. doi: 10.1097/00003246-200206000-00040. [DOI] [PubMed] [Google Scholar]
- 24.Brierley J, Choong K, Cornell T, et al. 2007 American College of Critical Care Medicine clinical practice parameters for hemodynamic support of pediatric and neonatal septic shock. Crit Care Med. 2009;37:666–688. doi: 10.1097/CCM.0b013e31819323c6. [DOI] [PMC free article] [PubMed] [Google Scholar]
- 25.Dellinger RP, Levy MM, Rhodes A, et al. Surviving sepsis campaign: international guidelines for management of severe sepsis and septic shock: 2012. Crit Care Med. 2013;41:580–637. doi: 10.1097/CCM.0b013e31827e83af. [DOI] [PubMed] [Google Scholar]
- 26.Cruz AT, Perry AM, Williams EA, Graf JM, Wuestner ER, Patel B. Implementation of goal-directed therapy for children with suspected sepsis in the emergency department. Pediatrics. 2011;127:e758–766. doi: 10.1542/peds.2010-2895. [DOI] [PubMed] [Google Scholar]
- 27.Larsen GY, Mecham N, Greenberg R. An emergency department septic shock protocol and care guideline for children initiated at triage. Pediatrics. 2011;127:e1585–1592. doi: 10.1542/peds.2010-3513. [DOI] [PubMed] [Google Scholar]
- 28.Paul R, Neuman MI, Monuteaux MC, Melendez E. Adherence to PALS Sepsis Guidelines and Hospital Length of Stay. Pediatrics. 2012;130:e273–280. doi: 10.1542/peds.2012-0094. [DOI] [PubMed] [Google Scholar]
- 29.Lagu T, Krumholz HM, Dharmarajan K, et al. Spending more, doing more, or both? An alternative method for quantifying utilization during hospitalizations. J Hosp Med. 2013;8:373–379. doi: 10.1002/jhm.2046. [DOI] [PMC free article] [PubMed] [Google Scholar]
Associated Data
This section collects any data citations, data availability statements, or supplementary materials included in this article.