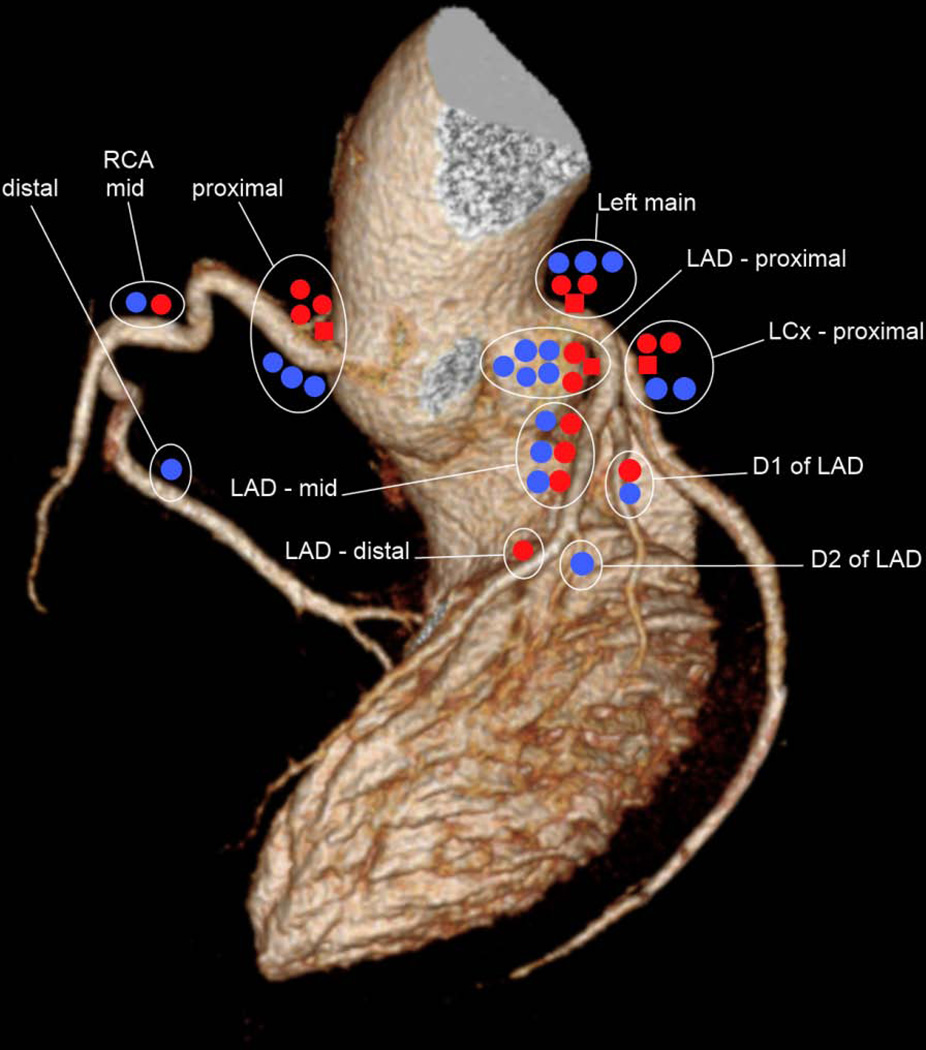
Figure 3.
Schematic plot of the distribution of lesions identified by coronary computed tomographic angiography along coronary territories, demonstrating clustering of lesions in the proximal coronary arteries. Red = Hodgkin lymphoma survivors treated with radiotherapy only; Blue = Hodgkin lymphoma survivors treated with multimodal therapy; ■= obstructive plaque;●, ●= nonobstructive plaque.

