

Abstract
Magnetic resonance imaging (MRI) techniques have been used to quantitatively assess focal and network abnormalities. Idiopathic generalized epilepsy (IGE) is characterized by bilateral synchronous spike–wave discharges on electroencephalography (EEG) but normal clinical MRI. Dysfunctions involving the neocortex, particularly the prefrontal cortex, and thalamus likely contribute to seizure activity. To identify possible morphometric and functional differences in the brains of IGE patients and normal controls, we employed measures of thalamic volumes, cortical thickness, gray–white blurring, fractional anisotropy (FA) measures from diffusion tensor imaging (DTI) and fractional amplitude of low frequency fluctuations (fALFF) in thalamic subregions from resting state functional MRI. Data from 27 patients with IGE and 27 age- and sex-matched controls showed similar thalamic volumes, cortical thickness and gray–white contrast. There were no differences in FA values on DTI in tracts connecting the thalamus and prefrontal cortex. Functional analysis revealed decreased fALFF in the prefrontal cortex (PFC) subregion of the thalamus in patients with IGE. We provide minimum detectable effect sizes for each measure used in the study. Our analysis indicates that fMRI-based methods are more sensitive than quantitative structural techniques for characterizing brain abnormalities in IGE.
Keywords: IGE (idiopathic generalized epilepsy), fALFF (fractional amplitude of low frequency fluctuations), DTI (diffusion tensor imaging), quantitative morphometry
Highlights
-
•
People with idiopathic generalized epilepsy show no brain abnormalities on visual inspection of clinical images.
-
•
Quantitative MRI measures can be deployed to detect structural and functional aberrancies
-
•
Fractional amplitude of low frequency fluctuations (fALFF) from resting state fMRI is decreased in the anterior thalamus in patients with IGE
-
•
We were unable to detect structural differences in the cortex or thalami in IGE compared to controls.
1. Introduction
Idiopathic generalized epilepsy (IGE) is characterized by bilateral spike–wave epileptiform discharges on electroencephalography (EEG), and recurrent generalized seizure types including absence, myoclonic, and/or generalized tonic–clonic seizures (GTCS). The classical EEG abnormalities simultaneously involve widespread, bilateral brain networks. IGE syndromes are defined primarily by predominant seizure types and age of onset. These include childhood and juvenile absence epilepsy, juvenile myoclonic epilepsy (JME), and generalized tonic–clonic seizures (GTCS). While classification systems emphasize differences between IGE subtypes, many phenotypic features are shared, most notably EEG features, and coexistence of multiple seizure types. For example, ~85% of JME and ~50% of absence epilepsy cases develop GTCS (Mehndiratta and Aggarwal, 2002). Some patients begin with one syndrome (e.g., childhood absence) and later evolve into another syndrome (e.g., JME), while others straddle syndromes (e.g., JME and GTCS). All exhibit normal brain morphology on visual inspection of clinical magnetic resonance imaging (MRI).
While normal clinical MRI is typically required for a diagnosis of IGE, emerging quantitative MRI analysis techniques have shown subtle structural changes between patients with IGE and controls in cortical and subcortical structures, though the findings are inconsistent among studies. Thalamic volumes in IGE patients have been shown to be decreased (Bernhardt et al., 2009; Lin et al., 2009; Kim et al., 2014; Chan et al., 2006; Ciumas and Savic, 2006), increased (Betting et al., 2006) or normal (Bernasconi et al., 2003; Natsume et al., 2003). Similarly, cortical thickness or volume in IGE has been shown to be increased (Lin et al., 2009; Kim et al., 2007; Biswal et al., 2010), decreased (Bernhardt et al., 2009) or normal (Bernasconi et al., 2003; Natsume et al., 2003). To a degree, these variable findings may be explained by the use of different sample sizes and different methodologies such as voxel based or deformation-based morphometry, or manual tracing.
In contrast to uncertainty concerning subtle structural brain abnormalities in IGE, there is an extensive body of research indicating abnormal function of frontal and thalamic brain regions in IGE (van Diessen et al., 2013). Electrophysiology studies first demonstrated frontal lobe dysfunction in IGE (Marcus and Watson, 1966). Aberrant thalamic activity and specific cortical changes occurring primarily in the frontal lobe suggest that dysregulated thalamo-cortical interactions generate or propagate seizures (Avanzini et al., 1993). The synchronous EEG activity underlying spike–wave discharges correlates with oscillatory patterns involving interconnected cortical and thalamic neurons (Avanzini et al., 2000). Debate continues whether seizures in people with IGE arise from the cortex, subcortex (e.g., thalamus) or simultaneously in a cortical–subcortical network.
More recent work has applied new techniques such as blood oxygen level dependent (BOLD) functional MR imaging (fMRI) to understanding the basis of IGE. Analysis of low frequency oscillations of the BOLD signal in the 0.01–0.08 Hz range from fMRI reliably assesses the resting state, when cognitive and physical demands are removed. This time course correlates synchronous, spontaneous activity that underlies strengthened synaptic connectivity between distant brain regions (Biswal et al., 1995; Berg et al., 2010). Using resting state functional connectivity (RSFC), we showed that the anterior medial prefrontal cortex (amPFC) was abnormally integrated in the default mode network in IGE patients (McGill et al., 2012). While the majority of RSFC studies focus on correlations in the time course of low frequency oscillations across brain regions, it is also possible to interrogate regional brain function by quantifying the amplitude of these oscillations to identify abnormal activity at rest that disrupts functional architecture (Biswal et al., 1995; Zang et al., 2007). The amplitude of low frequency fluctuations (ALFF) has a neuronal basis and is decreased in disorders that arise from a localized abnormality (e.g., temporal lobe epilepsy (TLE)) (Zhang et al., 2010) and the more widespread disorders (e.g., attention deficit hyperactivity disorder (ADHD)) (Tian et al., 2006). Abnormalities of the ALFF have been shown in thalamic and prefrontal cortex in IGE (Wang et al., 2014). The fractional ALFF, or fALFF, is used to study the proportional decrease of BOLD fluctuations in the low frequency band, which is thought to reflect spontaneous activity underlying stable, functional connections between distinct brain regions (Zou et al., 2008).
For this study, we sought to identify functional abnormalities in IGE patients as compared to normal controls using fALFF. We also apply quantitative structural neuroimaging analyses including volumetric, cortical thickness, gray–white contrast and diffusion tensor imaging (DTI) to enable function/structure correlations. Given strong prior evidence for frontal–thalamic abnormalities in IGE (Kim et al., 2014), we focus on these regions of interest, though also assess whole-brain effects. This study combines structural and functional data to characterize focal and network abnormalities in IGE. We hypothesized that morphologic abnormalities would be restricted to the frontal lobes, specifically the amPFC, while abnormal anatomic connections characterized by decreased integrity of white matter tracts on DTI would exist between the frontal lobes and the thalamus. Finally, we hypothesized that decreased fALFF in thalamic areas would be identified in dysregulated thalamo-cortical circuitry with the frontal lobe. In order to assist future MRI-based studies of IGE, we used power analysis methods to estimate the minimum detectable effect size for each of the methods (structural and functional) used in this study.
2. Methods
2.1. Participants
Twenty-seven patients with IGE were recruited from the New York University Comprehensive Epilepsy Center (12 women, age range 19.9–49.6 years, mean age 32.2 years) and were age- and sex-matched with 27 normal control subjects recruited from the general population (12 women, age range 20.9–48.6 years, mean age 32.1 years). Patients met criteria for IGE and had no history of developmental delay or structural brain abnormalities. Standard, diagnostic structural imaging studies were normal. Electrophysiologic evaluation with interictal, and in most patients, ictal EEG demonstrated typical generalized epileptiform spikes. Patients with focal epileptiform discharges or focal slowing on EEG were excluded. People with IGE were classified according to the International League Against Epilepsy (ILAE) classification as having absence seizures (37%), myoclonic seizures (59%), or generalized tonic–clonic seizures (78%) (Table 1). All of the study participants diagnosed with IGE were under medical treatment at the time of study, and all gave their written informed consent to participate in this study, which was approved by the Institutional Review Board of NYU Langone School of Medicine.
Table 1.
IGE subject sex, age, age at epilepsy onset, epilepsy duration, seizure type(s) and scans acquired for analysis purposes.
| Demographics |
Seizure types |
MRI scans |
||||||||
|---|---|---|---|---|---|---|---|---|---|---|
| Patient | Sex | Age | Onset age | Epilepsy duration | Absence | Myoclonic | GTC | T1 | Rs | DTI |
| 1 | M | 28.6 | 15 | 13.6 | X | X | X | |||
| 2 | F | 40.9 | 10.1 | 30.8 | X | X | X | |||
| 3 | M | 30.0 | 0.9 | 29.1 | X | X | ||||
| 4 | M | 46.3 | 12 | 34.3 | X | X | X | |||
| 5 | M | 25.5 | 2.9 | 22.6 | X | X | X | X | ||
| 6 | F | 41.0 | 15 | 26 | X | X | ||||
| 7 | M | 29.5 | 10 | 19.5 | X | X | ||||
| 8 | F | 27.5 | 19 | 8.5 | X | X | X | |||
| 9 | M | 26.3 | 5 | 21.3 | X | X | X | X | X | X |
| 10 | M | 49.6 | 19 | 30.6 | X | X | X | |||
| 11 | F | 48.7 | 17 | 31.7 | X | X | X | X | X | X |
| 12 | M | 47.4 | 16 | 31.4 | X | X | X | X | ||
| 13 | M | 27.5 | 19.8 | 7.7 | X | X | X | |||
| 14 | F | 32.1 | 20 | 12.1 | X | X | X | X | ||
| 15 | F | 22.8 | 13 | 9.8 | X | X | X | X | X | |
| 16 | M | 19.9 | 14 | 5.9 | X | X | ||||
| 17 | F | 21.7 | 18.1 | 3.6 | X | X | X | X | X | |
| 18 | F | 28.3 | 22 | 6.3 | X | X | X | |||
| 19 | F | 38.8 | 12 | 26.8 | X | X | X | X | X | |
| 20 | M | 27.7 | 1.5 | 26.2 | X | X | X | X | ||
| 21 | M | 35.6 | 9 | 26.6 | X | X | X | X | X | |
| 22 | M | 36.3 | 31 | 5.3 | X | X | X | X | ||
| 23 | M | 25.7 | 12.5 | 13.2 | X | X | X | X | X | |
| 24 | F | 24.7 | 15.1 | 9.6 | X | X | X | X | X | X |
| 25 | M | 20.6 | 15 | 5.6 | X | X | X | X | ||
| 26 | F | 37.9 | 14 | 23.9 | X | X | X | X | X | |
| 27 | F | 27.6 | 9.8 | 17.8 | X | X | X | X | X | X |
2.2. MRI scanning
Subjects underwent scanning on a Siemens Allegra 3 T scanner at New York University Center for Brain Imaging. All fifty-four participants had a T1-weighted MRI sequence optimized for gray–white matter contrast (TR = 2530 ms, TE = 3.25 ms, T1 = 1100 ms, flip angle = 7°, field of view (FOV) = 256 mm, matrix = 256 × 256 × 192, voxel size = 1 × 1.33 × 1.33 mm). Images were corrected for nonlinear warping caused by non-uniform fields created by the gradient coils. Image intensities were further normalized and made uniform with the FreeSurfer (4.0.2) software package. Fifteen people with IGE (8 women, mean age 30.13 years) and 15 age- and sex-matched control subjects (8 women, mean age 29.8 years) underwent resting state scans. We collected 197 contiguous echo planar imaging functional volumes for each subject (TR = 2000 ms; TE = 25 ms; flip angle = 90°, 39 slices, matrix = 64 × 64; FOV = 192 mm; acquisition voxel size = 3 × 3 × 3 mm). All participants were instructed to lie as still as possible with their eyes closed for the duration of the 6 min, 38 s scan. Eighteen people with IGE (8 women, mean age 31.71 years) and 18 age- and sex-matched normal control subjects (8 women, mean age 31.55 years) also had DTI scans. Diffusion-weighted echo-planar MRI were acquired by applying diffusion gradients along 64 directions (b value = 1000 s/mm2) with the following parameters during the 6-min, 3 s scan (TR = 5500 ms, TE = 86 ms, FOV = 240 mm, slice thickness = 2.5 mm, voxel size = 2.5 × 2.5 × 2.5 mm).
2.3. Image processing and analysis
2.3.1. Functional: fractional amplitude of low frequency fluctuation analysis
Preprocessing steps were carried out using SPM8, (http://www.fil.ion.ucl.ac.uk/spm) and Data Processing Assistant for Resting-State fMRI (DPARSF) V2.0 Basic Edition (Chao-Gan and Yu-Feng, 2010). The first 10 of 197 time points were removed and slice-timing correction for interleaved acquisition was performed. The volumes were all realigned and linearly normalized to their standard MNI template in 3 mm space. To control for the effects of motion, as well as normal physiologic processes such as cardiac and respiratory rhythms, each participant's 4-dimensional (4-D) preprocessed volume was regressed on 9 predictors that modeled nuisance signals from white matter, cerebrospinal fluid and the global signal and 6 motion parameters. Correction for time series autocorrelation (prewhitening) was performed. The images were smoothed with a full-width half maximum Gaussian kernel of 4 mm. The data were then detrended. The time series was transformed to the frequency domain with a fast Fourier transform to obtain the power spectrum.
2.3.1.1. Voxelwise fALFF analysis
We compared the amplitude of the BOLD signal in the bandpass of the power spectrum between 0.01 and 0.08 Hz in patients with IGE and normal control subjects. This bandpass is often used to look at spontaneous neural activity that, when in temporal synchrony with other distinct regions, suggests functional connectivity. The fractional amplitude of the low frequency bandpass at each voxel was calculated by dividing the amplitude of the BOLD signal at the specified bandpass (0.01–0.08 Hz by the amplitude of the entire BOLD signal at that voxel (0.01–0.25 Hz)) (Zou et al., 2008).
2.3.1.2. Region-of-interest fALFF analysis
Because there is strong evidence for thalamic dysfunction in IGE, we focused specifically on this region. To determine what specific parts of the thalamus show differences in spontaneous activity at this meaningful frequency, we compared the fALFF in bilateral thalamic subregions and entire thalami. Thalamic subregions were determined from the thalamic atlas in FSL (Behrens et al., 2003) thresholded at 50%. Subregions of the thalamus that correspond to specific nuclei were classified by determining reciprocal white matter tracts between the thalamus and seven cortical areas including the prefrontal, premotor, primary motor, sensory, temporal, posterior parietal and occipital cortices (Behrens et al., 2003). Statistical analysis in SPSS using two-sided t-tests of the average fALFF values across all voxels within each identified region was used to determine the subregions that show differences in functional activity between IGE patients and the control group.
2.3.2. Structural
2.3.2.1. Volumetric analysis
FreeSurfer (http://surfer.nmr.mgh.harvard.edu) software package was used to segment subcortical structures and generate volumes for these structures. Each voxel is assigned a neuroanatomical label based on probabilistic information from an atlas (Fischl et al., 2002). FreeSurfer measures of right and left thalamic volumes were collected from each subject, as was intracranial volume (ICV) to control for differences in head size. The statistical software package SPSS was used to compare volumetric differences between people with IGE and normal controls. Thalamic volume was modeled as the dependent variable using multiple linear regression and ICV and subject status (i.e., IGE or normal control) were used as independent variables.
2.3.2.2. Cortical thickness analysis
FreeSurfer was used to reconstruct surface models of each subject's cortex using T1-weighted anatomic MRI scans. The automated steps to facilitate quantitative cortical measurements include identification and tessellation of both the gray/white boundary and the pial surface of the brain. The folded surfaces are inflated and topological defects corrected. These steps are described in detail elsewhere (Fischl et al., 1999). Estimates of cortical thickness are made by averaging the distance perpendicular from each point on the white matter surface to the pial surface, and the distance from each point on the pial surface to the white matter surface. Maps are smoothed with a Gaussian kernel of 10 mm full width half maximum (FWHM) across the surface and averaged across participants using a spherical averaging technique (Fischl et al., 1999).
2.3.2.2.1. Whole-brain cortical thickness analysis
Cortical thickness was measured across the entire cortex and compared on a vertex-wise basis between the IGE group and normal control group, controlling for age. All results were corrected for multiple comparisons using Monte Carlo simulations.
2.3.2.2.2. Region-of-interest amPFC cortical thickness analysis
A region of interest (ROI) in the amPFC was identified in a previous study (McGill et al., 2012) that showed abnormal functional integration with a cortical network, the default mode network (DMN). Given the abnormal resting state functional connectivity of all voxels in this amPFC ROI and previous research showing that the PFC may contribute to the pathogenesis of generalized epilepsy, we specifically interrogated structural and anatomical network properties of this ROI. Cortical thickness values were averaged over the amPFC ROI in each subject and subsequent t-tests were employed in SPSS to detect differences between groups.
2.3.2.3. Gray–white contrast
Gray/white matter contrasts are calculated by measuring the image intensity contrast ([white − gray] / [white + gray]) at 0.5 mm from the white matter surface. Values at each voxel indicate contrast measures, with values closer to zero indicating increased blurring.
2.3.2.3.1. Whole-brain cortical gray–white contrast analysis
As with cortical thickness, gray–white contrast was measured across the entire cortex and compared vertex-wise between the IGE group and the normal control group, controlling for age. In addition, thalamic volumes and each of these cortical measures were correlated in each subject to determine if thalamo-cortical morphometric variations differ between each group. Results were corrected for multiple comparisons.
2.3.2.3.2. Focused amPFC ROI cortical thickness analysis
As with cortical thickness, GWC values were averaged over the amPFC ROI in each subject and subsequent t-tests were employed in SPSS to detect differences between groups. All results were corrected for multiple comparisons using Monte Carlo simulations.
2.3.3. Diffusion tensor imaging
2.3.3.1. Focused thalamus–PFC tractography
DTI analysis was performed using FMRIB's Diffusion Toolbox (FDT) (http://fsl.fmrib.ox.ac.uk/fsl/fsl-4.1.9/fdt/) implemented in FSL. Briefly, preprocessing of data included correction of both eddy current distortion induced by the gradient coils and simple head motion. Diffusion data were co-registered with T1-weighted images to create brain masks. Vectors were normalized at every voxel and probabilistic tractography was created by modeling crossing fibers using Bayesian estimation of diffusion parameters obtained using sampling techniques. Probabilistic tracts were generated between the thalamus and the amPFC and fractional anisotropy (FA) values at all voxels along the tract were determined. FA reflects the degree to which water diffuses most readily along a specified direction and is used as a measure of tract integrity. Analysis of variance of average FA values across the tracts between the thalamus and amPFC in each group was calculated between the IGE and normal control groups.
2.3.3.2. Whole-brain tract based spatial statistics
Voxelwise statistical analysis of the FA data over the entire brain was carried out using tract based spatial statistics (TBSS), part of FSL. First, FA images were created by fitting a tensor model to the raw diffusion data using FDT, and then brain-extracted using the brain extraction tool (BET) in FSL. All subjects' FA data were then aligned into a common space using the nonlinear registration tool FNIRT, which uses a b-spline representation of the registration warp field. Next, the mean FA image was created and thinned to create a mean FA skeleton, which represents the centers of all tracts common to the group. Each subject's aligned FA data were then projected onto this skeleton and the resulting data subjected to voxelwise cross-subject statistics. A permutation algorithm (randomize, within FSL) was used for inference testing, and a total of 500 permutations were conducted. Both uncorrected and family-wise error (FWE) –corrected p-value images were generated using a threshold-free cluster enhancement (TFCE) approach.
2.4. Minimal detectable differences
For each metric specified above, the minimal detectable difference was calculated using standard power analysis methods with the following parameters: alpha = 0.05, power = 0.8, two sample t-test, two sided distribution, and calculated using the “power.t.test” function provided with the software package “R”. The power of a statistical comparison is defined as 1 — beta, where beta is the false negative rate of the test. The typical community accepted standard for power is 0.8. We calculated the minimum difference that could be detected for each comparison using a power level of 0.8. For each metric the standard deviation was estimated separately for IGE and control groups then averaged. These measurements allow us to estimate the minimum effect size difference between IGE subjects and controls that can be detected using our study design.
3. Results
3.1. Functional
3.1.1. fALFF
Fractional amplitudes of low frequency fluctuations in the 0.01–0.08 Hz range compared to the entire detectable signal range (0–0.25 Hz) were averaged over every voxel in each of the seven thalamic subregions and the entire thalamus in each subject. The subregion that is connected structurally to the prefrontal cortex (PFC subregion) showed significant reductions (p = 0.023) in the fALFF values in IGE patients compared to controls (Fig. 1). fALFF differences in other subregions and the entire thalamus failed to reach significance.
Fig. 1.
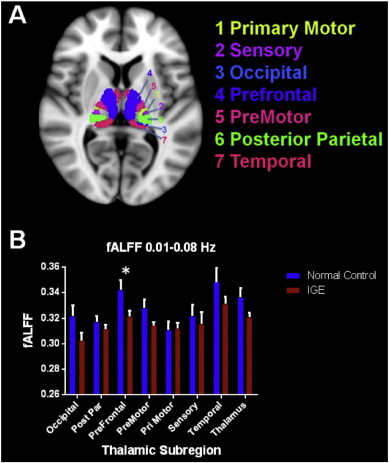
A. Thalamic subregions based on axonal projections to specific cortical regions are depicted. B. Average fALFF values in the 0.01–0.08 Hz bandpass in normal controls and patients with IGE are shown in this graph. In the prefrontal subregion patients with IGE showed reduced fALFF values compared to controls.
Because the prefrontal subregion of the thalamus showed significant differences in fALFF, the fALFF in the amPFC ROI that is abnormally integrated into the DMN was examined. IGE patients showed decreased fALFF (M = 0.350, SD = 0.019) in this region compared to normal controls (M = 0.363, SD = 0.030), however this difference failed to reach statistical significance (t(28) = 1.378, p = 0.179).
3.2. Structural
3.2.1. Volumetric
Thalamic volume did not differ between patients with IGE and controls. Left thalamic volumes for those with IGE and normal controls were 6940 and 6744 mm3, respectively (p = .299). Right thalamic volumes for IGE and normal controls were 6982 and 7027 mm3, respectively (p = .814). ICV was a predictor of both left and right thalamic volumes (p < 0.001), but a history of epilepsy was not predictive of left thalamus volume (p = 0.599) or right thalamus volume (p = 0.232). Fig. 2 depicts the distribution of thalamic volumes in patients with IGE and normal controls.
Fig. 2.
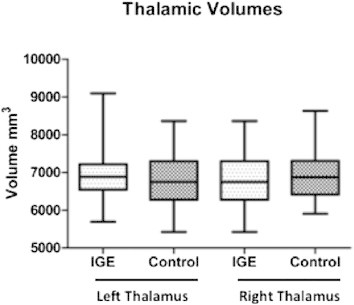
Box plots of the right and the left thalamus show volumes in IGE subjects and normal controls. There are no significant volumetric differences between the two study groups.
3.2.2. Cortical thickness and gray–white contrast
Both average cortical thickness and GWC were preserved in the amPFC ROI (Fig. 3). The average cortical thickness in the amPFC in normal controls was 2.698 mm and in patients with IGE it was 2.697 (p = 0.98). The average GWC in this region was 0.132 in normal controls and 0.133 in IGE patients (p = 0.65). To explore possible cortical differences located elsewhere in the brain, a whole-brain analysis of cortical thickness and gray–white contrast measures was performed. No significant differences were identified, when results were corrected for multiple comparisons with Monte Carlo simulations. Correlations between thalamic volumes and cortical thickness also revealed no differences between the two groups when corrected for multiple comparisons using Monte Carlo simulations.
Fig. 3.
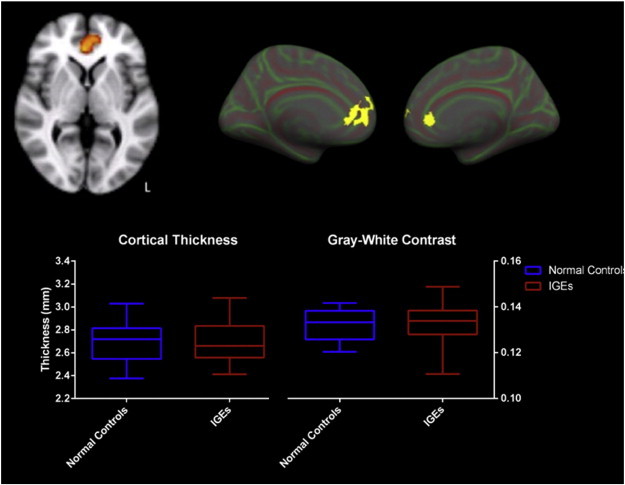
The amPFC ROI, identified as having abnormal resting state is shown A. on a volumetric scan and B. projected onto the pial surface of the inflated pial surface in both left and right hemispheres. C. There were no significant differences in cortical thickness or gray–white contrast in this ROI between patients with IGE and normal controls shown in the box plots.
Cortical thickness and GWC measures are normal throughout the brain in patients with IGE. No differences between the patient and control groups were seen in the cortical gray–white contrast throughout the cortex after correction for multiple comparisons and controlling for age.
3.3. DTI
The tracts generated from the thalamic prefrontal subregion (Behrens et al., 2003) to the prefrontal cortex are shown in Fig. 4. The tractography generated in each subject from the thalamus to the amPFC showed viable neuronal tracts, determined by normal FA values along the radiations, in both epilepsy patients and normal controls. Scatter plots of each subject's FA values averaged along all tracts are shown. Tract integrity is preserved along this anterior thalamic radiation bilaterally in patients with IGE.
Fig. 4.
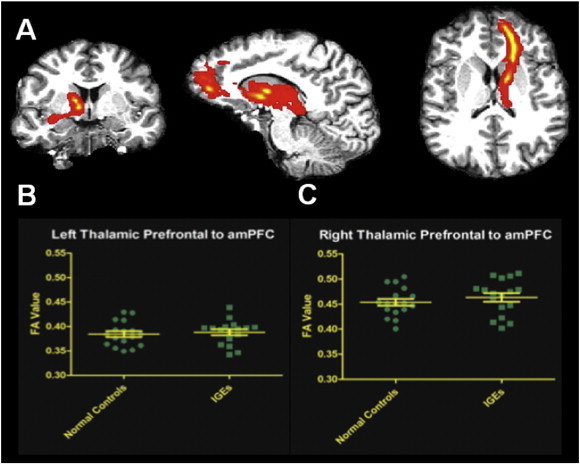
A. Thalamic white matter tracts from the prefrontal subregion of the left thalamus to the amPFC in a representative subject are shown here in patient diffusion space. Scatter plots depict the distribution of average FA values from all normal controls and IGEs within the tracts with mean and standard error of the mean illustrated, for B. the left hemisphere and C. the right hemisphere. No differences in tract integrity across all IGE subjects and normal controls were significant.
Tract based spatial statistics was used in group comparisons to study FA values along skeletonized white matter tracts throughout the brain. Analysis using TBSS showed no differences between FA values along any of the skeletonized tracks throughout the brain, using threshold-free cluster enhancement to correct for family-wise errors.
3.4. Minimal detectable differences
No differences were observed in IGE for any of the structural measures used in this study. In order to assist future studies, we conducted power analyses to estimate the minimum difference between IGE and controls that would be required to exist for our study design to detect these differences. These measures are summarized in Table 2. For example, we estimate that our study was able to detect a 0.14 mm cortical thickness difference between IGE subjects and controls in the amPFC region.
Table 2.
Estimates of minimum detectable effect size for each of the measures used in this study. Units are provided for measures with associated spatial dimensions (cortical thickness and thalamus volume). No differences were identified with any morphometric analyses in this study; therefore if any differences in these properties exist in IGE they are likely to be less than the values provided (amPFC = anterior medial prefrontal cortex; fALFF = fractional amplitude of low frequency fluctuations; GW = gray–white).
| Measure | Region | Minimum detectable difference | n per group |
|---|---|---|---|
| Cortical thickness | amPFC | 0.14 mm | 27 |
| GW contrast | amPFC | 0.00543 | 27 |
| Thalamus volume | Thalamus | 534.54 mm3 | 27 |
| Fractional anisotropy | Left thal–PFC | 0.024 | 17 |
| Right thal–PFC | 0.034 | 17 | |
| fALFF | Occipital | 0.0286 | 15 |
| Postpar | 0.0168 | 15 | |
| Prefrontal | 0.0244 | 15 | |
| Premotor | 0.0189 | 15 | |
| Primotor | 0.0231 | 15 | |
| Sensory | 0.0362 | 15 | |
| Temporal | 0.0343 | 15 | |
| Thalamus | 0.0224 | 15 |
Estimates of minimum detectable effect size for each of the measures used in this study. Units are provided for measures with associated spatial dimensions (cortical thickness and thalamus volume). No differences were identified with any morphometric analyses in this study; therefore if any differences in these properties exist in IGE they are likely to be less than the values provided (amPFC = anterior medial prefrontal cortex; fALFF = fractional amplitude of low frequency fluctuations; GW = gray– white).
4. Discussion
Our structural and functional studies of thalamic–prefrontal network integrity in IGE patients identified only functional differences. Anatomic integrity was maintained in both thalamic size and cortical measures including thickness and GWC. Axon tracts between these areas as determined by DTI were not compromised in the patient group, suggesting that these structural connections are intact in IGE. While cortical and thalamic structures in IGE are morphometrically normal, abnormal rest function (i.e., decreased fALFF of the BOLD signal) was detected in the thalamic subregion that is structurally connected with the prefrontal cortex.
4.1. Morphometry — thalamic volumes, cortical thickness and gray–white contrast
IGE is characterized by normal MRI on visual inspection and there are no commonly accepted cellular changes attributable to generalized epilepsy. We did not identify any significant differences in cortical thickness, gray–white contrast measures, or thalamic volumes, when compared to age-matched controls in our study population. These findings support the view that IGE brains resemble healthy controls, within the spatial resolution limits of the structural MRI acquired in this study. In focal epilepsy, these imaging measures often identify focal cortical dysplasia or epileptogenic tissue (Thesen et al., 2011). We specifically examined the morphometry measures in a ROI in the amPFC because atypical PFC signaling with the thalamus is implicated in IGE and this area is abnormally integrated with the DMN (McGill et al., 2012). However, there were no structural differences in the amPFC, and further whole-brain analyses failed to show morphometric differences throughout the brain.
Our study found normal thalamic volumes in IGE. While cortical thinning and thalamic volume loss would support the concept that thalamo-cortical networks are abnormal in IGE based on morphometric changes (Duncan, 2005), other studies have failed to identify consistent thalamic structural abnormalities in IGE (Bernasconi et al., 2003; Natsume et al., 2003). Our findings suggest that morphometric changes may not correlate with the physiologic abnormalities present on electroencephalographic recordings in IGE.
4.2. Thalamic–prefrontal network
Despite normal brain morphometry in IGE, abnormal prefrontal–thalamic network function likely underlies seizure generation. During spike-and-wave bursts, EEG–fMRI shows an association between increased thalamic activity and decreased BOLD fluctuations in frontal regions (Aghakhani et al., 2004; Gotman et al., 2005). Stimulation of either the thalamus (Guerrero-Figueroa et al., 1963) or the frontal cortex (Bancaud et al., 1974) elicits spike–wave phenomena suggesting that the connections between these two areas are essential for initiation or propagation of epileptiform activity.
The anterior thalamic radiation (ATR) carries nerve fibers between the thalamus and the prefrontal cortex in the anterior limb of the internal capsule. Decreased integrity of ATR, attributed to decreased fractional anisotropy occurs in other neuropathologies with frontal lobe dysfunction (Mamah et al., 2010). Given the concomitant aberrant functioning in the thalamus and PFC in IGE, we examined the integrity of this tract in IGE but found no differences in FA values in the ATR between patients and controls. The lack of differences in this neuronal bundle suggests that the integrity of tracts is not a contributing factor to network abnormalities in IGE. Skeletonized tracts showed no differences in FA values implying that tract integrity is maintained throughout the brain in these patients. Their integrity may be crucial for widespread propagation of abnormal epileptiform discharges in widely distributed cortical networks.
4.3. Focal functional differences
Decreases in the fALFF in a specific thalamic subregion provide initial evidence of functional abnormalities in this subcortical structure at rest. Differences in the amplitude of the BOLD signal have been found in several neuropathologies (Zhang et al., 2008; Hoptman et al., 2010). While these low frequency oscillations identify resting state networks, they may also correlate with or entrain faster EEG bands (Buzsáki and Draguhn, 2004). The slow oscillations (<0.1 Hz) are correlated with changes in the amplitude of EEG alpha rhythms (Mantini et al., 2007). Abnormalities in these slow oscillations may precipitate certain types of seizures (Vanhatalo et al., 2004).
Low frequency fluctuations are an integral component of activity in the thalamus and are present in thalamic firing during the generation of cyclic paroxysms, as seen in experimental electrographic recordings of seizures in cats (Steriade and Contreras, 1995). The decrease in fALFF in the PFC thalamic subregion suggests that this cyclic, spontaneous activity in either intrathalamic or thalamocortical neurons is abnormal. This functional pathology may underlie spike-and-wave discharges that spread throughout the entire cortex. However, the normal thalamic–frontal connectivity findings are not directly consistent with a network-level disorder and suggest that local fALFF changes related to IGE can occur independent of network changes. Our observed difference in the fALFF in the thalamus is contrary to previously reported findings from Wang et al. who observed increased fALFF in the thalamus (Wang et al., 2014). These differences may be explained by the specific regions interrogated, i.e., thalamic subregions vs. the entire thalamus. The present study shows decreased fALFF in the prefrontal subregion of the thalamus, while Wang et al. also showed decreased fALFF in the mPFC.
Individual thalamic nuclei cannot be discerned by 3 T MR imaging. Based on the tractography projections (Behrens et al., 2003), thalamic subregions showing decreased fALFF values correspond to specific nuclei. The mediodorsal nucleus is connected to the prefrontal cortex via the anterior thalamic peduncle (Tanaka, 1976). Since the prefrontal cortex may help generate spike-and-wave activity, identifying functional aberrations at rest in a thalamic nucleus with reciprocal connections with prefrontal cortex strengthens the notion that this cortico-thalamic circuitry is etiologically involved in IGE.
Evidence of abnormalities in voltage gated channels in thalamic neurons may partly explain thalamic functional differences seen (Steriade and Contreras, 1995). GABAergic neurons of the reticular nucleus and T-type Ca2+ currents in thalamocortical relay cells are among several channelopathies implicated in the cortical spike-and-wave phenomena of generalized seizures (Coulter et al., 1989). The cyclic gating of these channels, specifically the de-inactivation of the T-type Ca2+ channel and feedback inhibition of the GABAergic neurons, may contribute to the coordinated firing of spike–wave discharges propagated to the cortex. Since low frequency oscillations reflect network coupling and cortical inputs to the thalamus in part mediate the cyclic nature of thalamic activity, decreased fALFF in the prefrontal subregion of the thalamus suggests that a fronto-thalamic network contributes to uncontrolled gating of neuronal activity that causes epileptic activity.
5. Conclusions
This study employs functional and anatomic analyses of MRI scans to detect focal and network abnormalities in IGE. The functional differences described here are drawn from the BOLD signal, a hemodynamic correlate for neuronal activity, during interictal intervals. Changes in low frequency oscillations at rest highlight abnormalities that potentially set the stage for a spontaneous onset of seizure activity that propagates throughout the cortex seemingly instantaneously. While these advances in MRI analysis techniques provide important information about underlying pathology in epilepsy, further studies of electrophysiology and channelopathies in specific thalamic nuclei will elucidate further the primary pathology contributing to epileptogenesis in IGE.
6. Limitations and future directions
The primary findings of this study reflect functional differences in subdivisions of the thalamus, suggesting that focal, functional abnormalities contribute to, or result from seizures in IGE. In 3 T MRI, individual thalamic nuclei cannot be discerned. An atlas of thalamic subregions (Behrens et al., 2003) provides an approximate map of different nuclei but is based on structural connectivity with different cortical regions and does not reflect functional regions of the thalamus. Furthermore, all images from subjects are co-registered to a standard brain before analyses are performed, yielding it impossible to study functional differences in subregions specific to each subject. Future studies that incorporate higher power imaging, such as 7 T MRI might improve identification of thalamic nuclei in individual subjects and would lend themselves better to studying functional differences in these areas.
Our inability to discern structural differences between IGE patients and controls using anatomic measures such as cortical thickness, gray–white contrast thalamic volumes and DTI could relate to small sample size; the possibility of subtle differences, which have been detected in some studies, cannot be ruled out. However, functional measures seem to be more sensitive to changes in IGE supporting their use as imaging biomarkers. We have provided estimates of the minimum detectable difference for each of the measures used in this study (Table 2). Future studies investigating morphometric differences in IGE should take these estimates into account by planning increased sample size accordingly or using methods with higher sensitivity. Methodological improvements that may provide this increased sensitivity could include higher spatial resolution or high contrast imaging for cortical thickness, thalamic volume and GW contrast; or the use of more recent advanced diffusion MRI methods for improved discrimination of white matter fiber tracks.
Furthermore, we are unable to rule out cellular changes that might not affect macroscopic morphometry. Microscopic changes that leave the cortical ribbon and thalamus intact would not be detected with the MRI analysis techniques presented here.
Though the pathogenesis underlying IGE has historically been considered nonlocalizable, our results suggest that there may be a focal functional abnormality of thalamic–PFC network. Future studies of this network may provide a path towards targeting treatment options in patients with medically refractory IGE, including guiding development of novel surgical or other treatments to normalize aberrant thalamic connectivity. Emerging imaging techniques including fMRI analyses, and magnetoencephalography (MEG) will advance the understanding of the primary pathology underlying seizures in generalized epilepsy.
References
- Aghakhani Y., Bagshaw A.P., Benar C.G. fMRI activation during spike and wave discharges in idiopathic generalized epilepsy. Brain. 2004;127(5):1127–1144. doi: 10.1093/brain/awh136. [DOI] [PubMed] [Google Scholar]
- Avanzini G., Panzica F., de Curtis M. The role of the thalamus in vigilance and epileptogenic mechanisms. Clinical Neurophysiology: Official Journal of the International Federation of Clinical Neurophysiology. 2000;111(Suppl. 2):S19–S26. doi: 10.1016/s1388-2457(00)00398-9. 10996551 [DOI] [PubMed] [Google Scholar]
- Avanzini G., Vergnes M., Spreafico R., Marescaux C. Calcium-dependent regulation of genetically determined spike and waves by the reticular thalamic nucleus of rats. Epilepsia. 1993;34(1):1–7. doi: 10.1111/j.1528-1157.1993.tb02369.x. 8422841 [DOI] [PubMed] [Google Scholar]
- Bancaud J., Talairach J., Morel P. “Generalized” epileptic seizures elicited by electrical stimulation of the frontal lobe in man. Electroencephalography and Clinical Neurophysiology. 1974;37(3):275–282. doi: 10.1016/0013-4694(74)90031-5. 4136279 [DOI] [PubMed] [Google Scholar]
- Behrens T.E., Johansen-Berg H., Woolrich M.W. Non-invasive mapping of connections between human thalamus and cortex using diffusion imaging. Nature Neuroscience. 2003;6(7):750–757. doi: 10.1038/nn1075. 12808459 [DOI] [PubMed] [Google Scholar]
- Berg A.T., Berkovic S.F., Brodie M.J., Buchhalter J., Cross J.H., van Emde Boas W., Engel J., French J., Glauser T.A., Mathern G.W., Moshé S.L., Nordli D., Plouin P., Scheffer I.E. Revised terminology and concepts for organization of seizures and epilepsies: report of the ILAE Commission on Classification and Terminology, 2005-2009. Epilepsia. 2010;51:676–685. doi: 10.1111/j.1528-1167.2010.02522.x. 20196795 [DOI] [PubMed] [Google Scholar]
- Bernasconi A., Bernasconi N., Natsume J., Antel S.B., Andermann F., Arnold D.L. Magnetic resonance spectroscopy and imaging of the thalamus in idiopathic generalized epilepsy. Brain: A Journal of Neurology. 2003;126(11):2447–2454. doi: 10.1093/brain/awg249. 12902313 [DOI] [PubMed] [Google Scholar]
- Bernhardt B.C., Rozen D.A., Worsley K.J., Evans A.C., Bernasconi N., Bernasconi A. Thalamo-cortical network pathology in idiopathic generalized epilepsy: insights from MRI-based morphometric correlation analysis. Neuroimage. 2009;46(2):373–381. doi: 10.1016/j.neuroimage.2009.01.055. 19385011 [DOI] [PubMed] [Google Scholar]
- Betting L.E., Mory S.B., Lopes-Cendes I. MRI volumetry shows increased anterior thalamic volumes in patients with absence seizures. Epilepsy & Behavior: E&B. 2006;8(3):575–580. doi: 10.1016/j.yebeh.2006.02.002. 16530016 [DOI] [PubMed] [Google Scholar]
- Biswal B., Yetkin F.Z., Haughton V.M., Hyde J.S. Functional connectivity in the motor cortex of resting human brain using echo-planar MRI. Magnetic Resonance in Medicine: Official Journal of the Society of Magnetic Resonance in Medicine / Society of Magnetic Resonance in Medicine. 1995;34(4):537–541. doi: 10.1002/mrm.1910340409. 8524021 [DOI] [PubMed] [Google Scholar]
- Biswal B.B., Mennes M., Zuo X.- Toward discovery science of human brain function. Proceedings of the National Academy of Sciences. 2010;107(10):4734–4739. doi: 10.1073/pnas.0911855107. [DOI] [PMC free article] [PubMed] [Google Scholar]
- Buzsáki G., Draguhn A. Neuronal oscillations in cortical networks. Science (New York, N.Y.) 2004;304(5679):1926–1929. doi: 10.1126/science.1099745. 15218136 [DOI] [PubMed] [Google Scholar]
- Chan C.H., Briellmann R.S., Pell G.S., Scheffer I.E., Abbott D.F., Jackson G.D. Thalamic atrophy in childhood absence epilepsy. Epilepsia. 2006;47(2):399–405. doi: 10.1111/j.1528-1167.2006.00435.x. 16499767 [DOI] [PubMed] [Google Scholar]
- Chao-Gan Y., Yu-Feng Z. DPARSF: a MATLAB toolbox for “pipeline” data analysis of resting-state fMRI. Frontiers in Systems Neuroscience. 2010;4:13. doi: 10.3389/fnsys.2010.00013. 20577591 [DOI] [PMC free article] [PubMed] [Google Scholar]
- Ciumas C., Savic I. Structural changes in patients with primary generalized tonic and clonic seizures. Neurology. 2006;67(4):683–686. doi: 10.1212/01.wnl.0000230171.23913.cf. 16924024 [DOI] [PubMed] [Google Scholar]
- Coulter D.A., Huguenard J.R., Prince D.A. Calcium currents in rat thalamocortical relay neurones: kinetic properties of the transient, low-threshold current. Journal of Physiology. 1989;414:587–604. doi: 10.1113/jphysiol.1989.sp017705. 2607443 [DOI] [PMC free article] [PubMed] [Google Scholar]
- Duncan J.S. Brain imaging in idiopathic generalized epilepsies. Epilepsia. 2005;46(Suppl. 9):108–111. doi: 10.1111/j.1528-1167.2005.00321.x. 16302883 [DOI] [PubMed] [Google Scholar]
- Fischl B., Salat D.H., Busa E. Whole brain segmentation: automated labeling of neuroanatomical structures in the human brain. Neuron. 2002;33(3):341–355. doi: 10.1016/s0896-6273(02)00569-x. 11832223 [DOI] [PubMed] [Google Scholar]
- Fischl B., Sereno M.I., Dale A.M. Cortical surface-based analysis. II: inflation, flattening, and a surface-based coordinate system. Neuroimage. 1999;9(2):195–207. doi: 10.1006/nimg.1998.0396. 9931269 [DOI] [PubMed] [Google Scholar]
- Gotman J., Grova C., Bagshaw A., Kobayashi E., Aghakhani Y., Dubeau F. Generalized epileptic discharges show thalamocortical activation and suspension of the default state of the brain. Proceedings of the National Academy of Sciences of the United States of America. 2005;102(42):15236–15240. doi: 10.1073/pnas.0504935102. 16217042 [DOI] [PMC free article] [PubMed] [Google Scholar]
- Guerrero-Figueroa R., Barros A., De Verster F.B., Heath R.G. Experimental “petit mal” in kittens. Archives of Neurology. 1963;9:297–306. doi: 10.1001/archneur.1963.00460090103012. 14049404 [DOI] [PubMed] [Google Scholar]
- Hoptman M.J., Zuo X.N., Butler P.D. Amplitude of low-frequency oscillations in schizophrenia: a resting state fMRI study. Schizophrenia Research. 2010;117(1):13–20. doi: 10.1016/j.schres.2009.09.030. 19854028 [DOI] [PMC free article] [PubMed] [Google Scholar]
- Kim J.B., Suh S.I., Seo W.K., Oh K., Koh S.B., Kim J.H. Altered thalamocortical functional connectivity in idiopathic generalized epilepsy. Epilepsia. 2014;55(4):592–600. doi: 10.1111/epi.12580. [DOI] [PubMed] [Google Scholar]
- Kim J.H., Lee J.K., Koh S.B. Regional grey matter abnormalities in juvenile myoclonic epilepsy: a voxel-based morphometry study. Neuroimage. 2007;37(4):1132–1137. doi: 10.1016/j.neuroimage.2007.06.025. 17689105 [DOI] [PubMed] [Google Scholar]
- Lin K., Jackowski A.P., Carrete H. Voxel-based morphometry evaluation of patients with photosensitive juvenile myoclonic epilepsy. Epilepsy Research. 2009;86(2–3):138–145. doi: 10.1016/j.eplepsyres.2009.05.016. 19570650 [DOI] [PubMed] [Google Scholar]
- Mamah D., Conturo T.E., Harms M.P. Anterior thalamic radiation integrity in schizophrenia: a diffusion-tensor imaging study. Psychiatry Research. 2010;183(2):144–150. doi: 10.1016/j.pscychresns.2010.04.013. 20619618 [DOI] [PMC free article] [PubMed] [Google Scholar]
- Mantini D., Perrucci M.G., Del Gratta C., Romani G.L., Corbetta M. Electrophysiological signatures of resting state networks in the human brain. Proceedings of the National Academy of Sciences of the United States of America. 2007;104(32):13170–13175. doi: 10.1073/pnas.0700668104. 17670949 [DOI] [PMC free article] [PubMed] [Google Scholar]
- Marcus E.M., Watson C.W. Bilateral synchronous spike wave electrographic patterns in the cat. Interaction of bilateral cortical foci in the intact, the bilateral cortical–callosal, and adiencephalic preparation. Archives of Neurology. 1966;14(6):601–610. doi: 10.1001/archneur.1966.00470120033006. 4286969 [DOI] [PubMed] [Google Scholar]
- McGill M.L., Devinsky O., Kelly C. Default mode network abnormalities in idiopathic generalized epilepsy. Epilepsy & Behavior: E&B. 2012;23(3):353–359. doi: 10.1016/j.yebeh.2012.01.013. 22381387 [DOI] [PMC free article] [PubMed] [Google Scholar]
- Mehndiratta M.M., Aggarwal P. Clinical expression and EEG features of patients with juvenile myoclonic epilepsy (JME) from North India. Seizure. 2002;11(7):431–436. doi: 10.1053/seiz.2001.0662. 12237068 [DOI] [PubMed] [Google Scholar]
- Natsume J., Bernasconi N., Andermann F., Bernasconi A. MRI volumetry of the thalamus in temporal, extratemporal, and idiopathic generalized epilepsy. Neurology. 2003;60(8):1296–1300. doi: 10.1212/01.wnl.0000058764.34968.c2. 12707432 [DOI] [PubMed] [Google Scholar]
- Steriade M., Contreras D. Relations between cortical and thalamic cellular events during transition from sleep patterns to paroxysmal activity. Journal of Neuroscience: the Official Journal of the Society for Neuroscience. 1995;15(1 Pt 2):623–642. doi: 10.1523/JNEUROSCI.15-01-00623.1995. 7823168 [DOI] [PMC free article] [PubMed] [Google Scholar]
- Tanaka D. Thalamic projections of the dorsomedial prefrontal cortex in the rhesus monkey (Macaca mulatta) Brain Research. 1976;110(1):21–38. doi: 10.1016/0006-8993(76)90206-7. 819108 [DOI] [PubMed] [Google Scholar]
- Thesen T., Quinn B.T., Carlson C. Detection of epileptogenic cortical malformations with surface-based MRI morphometry. PloS One. 2011;6(2):e16430. doi: 10.1371/journal.pone.0016430. 21326599 [DOI] [PMC free article] [PubMed] [Google Scholar]
- Tian L., Jiang T., Wang Y. Altered resting-state functional connectivity patterns of anterior cingulate cortex in adolescents with attention deficit hyperactivity disorder. Neuroscience Letters. 2006;400(1–2):39–43. doi: 10.1016/j.neulet.2006.02.022. 16510242 [DOI] [PubMed] [Google Scholar]
- Van Diessen E., Diederen S.J., Braun K.P., Jansen F.E., Stam C.J. Functional and structural brain networks in epilepsy: what have we learned? Epilepsia. 2013;54(11):1855–1865. doi: 10.1111/epi.12350. 24032627 [DOI] [PubMed] [Google Scholar]
- Vanhatalo S., Palva J.M., Holmes M.D., Miller J.W., Voipio J. Infraslow oscillations modulate excitability and interictal epileptic activity in the human cortex during sleep. Proceedings of the National Academy of Sciences of the United States of America. 2004;101(14):5053–5057. doi: 10.1073/pnas.0305375101. 15044698 [DOI] [PMC free article] [PubMed] [Google Scholar]
- Wang Z., Zhang Z., Liao W. Frequency-dependent amplitude alterations of resting-state spontaneous fluctuations in idiopathic generalized epilepsy. Epilepsy Research. 2014;108:853–860. doi: 10.1016/j.eplepsyres.2014.03.003. 24721198 [DOI] [PubMed] [Google Scholar]
- Zang Y.F., He Y., Zhu C.Z. Altered baseline brain activity in children with ADHD revealed by resting-state functional MRI. Brain & Development. 2007;29(2):83–91. doi: 10.1016/j.braindev.2006.07.002. 16919409 [DOI] [PubMed] [Google Scholar]
- Zhang Z., Lu G., Zhong Y. fMRI study of mesial temporal lobe epilepsy using amplitude of low-frequency fluctuation analysis. Human Brain Mapping. 2010;31(12):1851–1861. doi: 10.1002/hbm.20982. 20225278 [DOI] [PMC free article] [PubMed] [Google Scholar]
- Zhang Z.Q., Lu G.M., Zhong Y. [Application of amplitude of low-frequency fluctuation to the temporal lobe epilepsy with bilateral hippocampal sclerosis: an fMRI study] Zhonghua Yi Xue za Zhi. 2008;88(23):1594–1598. 19035096 [PubMed] [Google Scholar]
- Zou Q.H., Zhu C.Z., Yang Y. An improved approach to detection of amplitude of low-frequency fluctuation (ALFF) for resting-state fMRI: fractional ALFF. Journal of Neuroscience Methods. 2008;172(1):137–141. doi: 10.1016/j.jneumeth.2008.04.012. 18501969 [DOI] [PMC free article] [PubMed] [Google Scholar]