

Abstract
Glutathione plays an essential role in the intracellular antioxidant defense against oxidant radicals, especially the •OH radical. To understand the early and progressive cellular changes in the development of Alzheimer's disease (AD), we investigated reduced glutathione/oxidized glutathione (GSH/GSSG) status in a double mutated AD transgenic mouse model (B6.Cg-Tg), which carries Swedish amyloid-β protein precursor mutation (AβPPswe) and exon 9 deletion of the PSEN1 gene. In this study, we quantified and compared both GSH/GSSG and mixed-disulfide (Pr-SSG) levels in blood samples and three anatomic positions in brain (cerebrum, cerebellum, and hippocampus) at 3 age stages (1, 5, and 11 months) of AD transgenic (Tg)/wild type mice. The present study was designed to characterize and provide insight into the glutathione redox state of both brain tissues and blood samples at different disease stages of this Tg model. The level of Pr-SSG increased in all AD brain tissues and blood compared with controls regardless of age. The GSH/GSSG ratio in AD-Tg brain tissue started at a higher value at 1 month, fell at the transitional period of 5 months, right before the onset of amyloid plaques, followed by an increase in GSSG and associated decrease of GSH/GSSG at 11 months. These results suggest that formation of Pr-SSG may be an early event, preceding amyloid plaque appearance, and the data further implies that tissue thiol redox is tightly regulated. Notably, the high basal levels of mixed-disulfides in hippocampus suggest a potential for increased oxidative damage under oxidizing conditions and increased GSSG in this vulnerable region.
Keywords: Alzheimer's disease, glutathione, mixed disulfide, oxidized glutathione
INTRODUCTION
Alzheimer's disease (AD) often has a long stage of neuropathological changes and cognitive decline starting at a molecular level, possibly decades earlier than decline is detected by neuropsychological testing [1, 2]. Oxidative stress induced by reactive oxygen species (ROS) and a disturbance of glutathione (GSH) homeostasis in the brain has been implicated as a contributing factor to AD [3].
The homeostasis of brain redox status is mainly controlled by GSH that functions in radical scavenging and protects cells from oxidative stress [4, 5]. GSH is the most abundant non-protein thiol [6] and is first line of defense against superoxide anions and •OH radicals produced in mammalian cells [7, 8]. Free (non-protein bound) glutathione exists primarily in its reduced form (GSH), which can be oxidized to glutathione disulfide (GSSG) during oxidative stress [9]. GSH is regenerated from GSSG in the glutathione redox cycle catalyzed by GSSG reductase (GR) at the expense of reduced nicotinamide adenine dinucleotide phosphate (NADPH). GSSG, when elevated, can promote protein-protein or protein-lipid cross-linkage [10]; the generation of protein mixed-disulfides (Pr-SSG) involves thiol/disulfide exchange between GSSG and Cys residues on proteins [11]. Thus enhanced levels of GSSG may cause greater formation of Pr-SSG [12].
In the present study, we evaluated glutathione oxidative stress in a transgenic model of AD (B6.Cg). The double-transgenic mice incorporating a chimeric human/murine AβPP construct and co-expressing the AβPPswe and exon 9 deletion (ΔE9) of the PSEN1 gene shows onset of amyloid plaques (Aβ) at 6-7 months old. This Tg-AD mouse model develops amyloid plaques and cognitive impairment in an age-dependent manner, which closely mimics the progression of the human disease.
The fact that the brain displays regional variability to AD pathology is well established, but little is known regarding regional tissue differences in glutathione redox status. To determine if regional vulnerability of the AD brain is reflected in differences in the GSH/GSSG and Pr-SSG pattern, we examined the redox status in three different AD brain areas, namely, the vulnerable regions of cerebrum and hippocampus, and the relatively resistant region of cerebellum. In addition, we have also determined the redox status of blood GSH, typically considered a marker for oxidative stress and free radical induced pathologies since low GSH, high GSSG, and associated low GSH/GSSG ratio have been observed in AD patients [13, 14].
The present investigation was initiated to determine the glutathione redox state and Pr-SSG in 1-, 5-, and 11-month-old B6.Cg mice siblings of both genders. Endpoint measures were tissue levels of GSH and GSSG in the abovementioned three anatomic brain tissues and blood as well as tissue levels of Pr-SSG. The results revealed interesting relationships among the three factors of age, genotype, and specific brain regions pertaining to glutathione redox status of the AD mouse brain and blood. In terms of an age effect, unexpectedly, we observed a decrease of GSSG and a corresponding higher GSH/GSSG ratio at 5 months, the age right before Aβ manifestation. The results suggest minimal difference in oxidative susceptibility of a 1-month and a 5-month-old brain in these Tg mice. With respect to genotype effect, Pr-SSG levels were found to increase in Tg brain and blood as compared to wild-type (WT) controls at all ages. Regarding specific brain regional effect, the hippocampus exhibited high levels of Pr-SSG even at basal level (1 month) regardless of genotype, consistent with selective vulnerability in the hippocampus region in AD.
MATERIALS AND METHODS
Reagents
Mice identification tags were purchased from Hasco Tag (Dayton, KY). AβPP and PSEN1 primers were from IDT (Coralville, IA). Master mix for PCR was from Idaho Technology Inc. (Salt Lake City, UT). Grx was from IMCO (Stamford, CT). GSH and GSSG were from Calbiochem. Diamide was from Research Organics Inc. (Cleveland, OH). 5,5′ -Dithiobis (2-nitrobenzoic acid) (DTNB) was bought from Biosynth (Itasca, IL). Iodoacetic acid, 1-fluoro-2,4-dinitrobenzen (FDNB), and triton X-100 were obtained from Alfa Aesar (Ward Hill, MA). N-ethylmaleimide, immobilized TCEP disulfide reducing gel, bicinchoninic acid (BCA) protein assay kit were from Thermo Scientific (Rockford, IL). Sodium dodecyl sulfate (SDS), sodium phosphate diabasic, potassium phosphate monobasic, tris (hydroxymethyl)-aminomethane, tricine, ethylenediaminetetraacetic acid (EDTA), sodium hydroxide, hydrochloric acid and trichloroacetic acid (TCA) were all from Sigma (St. Louis, MO). Glutathione reductase assay kit and glutathione peroxidase assay kit were both purchased from Cayman Chemical Company (Ann Arbor, MI).
Transgenic mice
AD-Tg mice (B6.Cg-Tg (AβPPswe, PSEN1dE9) 85Dbo/J, stock no. 005864, Jackson Laboratory, Bar Harbor, ME) were maintained as double hemizygotes by crossing with WT individuals on a C57BL/6J background strain at the Louisiana Tech University animal facility. This Tg mouse has proven to be a valuable model system to study the pathological alterations in AD [15–19]. B6.Cg-Tg begins to develop amyloid plaques at 6-7 months of age [20–23]. As a model of AD, these Tg mice display many features that are known to occur early in the pathogenesis of AD such as increased oxidative stress, Aβ alterations and loss of function through the overexpression of both mutated forms of the human AβPP and PSEN1 [24–27].
In order to understand the early and progressive glutathione changes in AD development and progression, three stages of disease progression of the AD transgenic mice were used: long before (1 month, n = 5), immediately before (5 months, n = 5), and after (11 months, n = 5), the appearance of amyloid pathology and cognitive impairment. Age-matched WT mice were used as controls. A total of 30 mice (5 pairs Tg and WT at the three stages) were used in this study. All procedures for handling of mice were approved by the Institutional Animal Care and Use Committee. Since aged mice at 11 months old are either unavailable or too expensive to be purchased, we bred and performed genotyping studies for each animal.
Genotyping using melting curves and melting peak
Real time quantitative polymerase chain reaction (qPCR) and high resolution melting (HRM) curve analysis were used for genotyping the AD-Tg mice. The primer sets for the AβPP transgenic gene were: forward 5′ -GAC TGA CCA CTC GAC CAG GTT CTG-3′ and reverse 5′ -CTT GTA AGT TGG ATT CTC ATA TCCG-3′ ). Primer sets for the PSEN1 mutant gene were: forward 5′ -AAT AGA GAA CGG CAG GAG CA-3′ and reverse 5′ -GCC ATG AGG GCA CTA ATCAT-3′ [28]. Mouse tail snips were obtained and DNA was extracted in 25 mM NaOH/0.2 mM EDTA at 98°C for 1 h. The extracted DNA samples were mixed with 40 mM Tris-HCl (pH 5.5) and centrifuged at 4,000 for 3 min. The sequence of AβPP gene was amplified by qPCR and then analyzed by melting curve analysis with a thermal cycler coupled with a fluorometer (LC 32 Scanner, Idaho Technology, Utah).
To amplify the AβPP gene, LightScanner master mix, which incorporates a Taq polymerase, dNTPs, magnesium chloride and LCGreen plus dye, was used. Briefly, 1 μl of 15 ng/μl DNA was incubated with 3 μl DI water, 1 μl 2 μM AβPP forward primer, 1 μl 2 μM AβPP reverse primer and 4 μl 2.5 × LightScanner master mix for 5 min at room temperature. A total of 35 cycles of 30 s at 94°C, 1 min at 50.5°C, and 30 s at 72°C was performed for PCR amplification. Immediately after amplification, DNA melting curves was acquired by measuring the fluorescence of LCGreen dye during a linear temperature transition from 65°C to 90°C at 0.1°C/s. Fluorescence data were converted into melting peaks by the LighScanner 32 software to plot the negative derivative of measured fluorescence with respect to temperature versus temperature (−dF/dT versus T).
Brain homogenate and blood preparation
Blood samples and brain tissue were isolated from five pairs of AD-Tg/WT mice at each stage. The mice were anesthetized by intraperitoneal injection of sodium pentobarbital (60 mg/kg) and the animals were perfused transcardially with ice-cold saline. The brains were rapidly removed and dissected on ice to harvest the three brain regions cerebrum, cerebellum, and hippocampus. After weighing, brain samples were rinsed with ice cold PBS and used immediately for GSH determinations [29].
Brain tissues were homogenized in ice-old 0.1 M phosphate buffer. Proteins in samples of tissue homogenates were precipitated in 5% TCA at 4°C for 15 min, and centrifuged at 10,000 × g for 10 min. The acid supernatants were removed for HPLC analysis of glutathione (GSH and GSSG), while the protein pel-lets were retained for measurements of Pr-SSG by the Ellman's colorimetric assay [30].
Protein concentration measurement
BCA assay kit was used to measure the protein concentration according to manufacturer's protocol. The absorbance of the protein samples at 562 nm was measured by the NanoDrop 2000/2000c Spectrophotometer.
Measurement of glutathione GSH and GSSG content
The levels of GSH and GSSG in brain homogenates and blood samples of AD-Tg/WT mice at 3 stages were measured using HPLC [31] after TCA precipitation. Acid-soluble GSH and GSSG were derivatized as follows. GSH was first reacted with 80 mM iodoacetic acid, a thiol alkylating agent to form the S-carboxymethyl derivatives of free thiols [32]. Then 6% FDNB was added to react with free amine groups to from 2,4-dinitrophenyl derivatives [33]. The chromatograph of GSH and GSSG derivatives was performed on a 250 mm×4.6 mm Alltech Lichrosorb NH2 10-μm column using a Shimadu HPLC system. GSH and GSSG contents were expressed as nanomole per milligram protein, which allowed the calculation of the glutathione redox ratio (GSH/GSSG).
Mixed-disulfide (Pr-SSG) determination
Pr-SSG was determined using a modified Ellman's assay. After TCA precipitation and centrifugation at 10,000×g for 5 min, the protein pellets were obtained and then dissolved in 1X PBS solution with 5% SDS at pH 8 [34]. After protein pellets completely dissolved, the samples were split into two sets. Set I was pre-treated with 40 μl immobilized TCEP gel to reduce all disulfides in Pr-SSG to protein thiols (Pr-SH) at 37°C for 30 min with occasional shaking. Set I (containing reduced Pr-SH and native Pr-SH) and Set II (containing only native Pr-SH) were incubated at room temperature for 15 min with 70 μl phosphate buffer (1.5 mM KH2PO4, 6.36 mM K2HPO4, 1.57 mM EDTA) containing 3.95 mM DTNB. Total Pr-SH (Set I) and native Pr-SH (Set II) were determined spectrophotometrically at 412 nm [35]. The concentration of disulfides in Pr-SSG (nmol disulfides/mg of protein) was expressed as a half of the thiols determined from difference between Set II and Set I [36]. It is noteworthy that the quantity of mixed-disulfide is overestimated because other cysteine modifications such as s-nitrosylation and s-sulfenation also occurs and are reduced by TCEP in sample preparation from Set I group. However, this overestimation is minimal and negligible since mixed-disulfide (Pr-SSG) is much more predominant with nearly 1000 fold higher expression than endogenously low abundant nitrosylated proteins (1–200 picomole/mg protein) [37–39].
Determination of enzymatic activity
GR and glutathione peroxidase (GPx) activities (unit in nmol/min/ml) were determined using commercial GR and GPx assay kits from Cayman Chemical Company. The brain tissues from three pairs of mice at each three stages (1, 5, and 24 months old) were analyzed and the sample preparations were made according to the manufacturer's protocol. Here, much older mice (24 months old instead of 11 month old) were used due to animal availability.
Data statistical analysis
Statistical analysis between groups was done by oneway ANOVA. A value of p < 0.05 was accepted as significant. All values are expressed as mean ± SEM; n = 5 for each group.
RESULTS
Genotyping using melting curve analysis
Melting analysis of the PCR products generated with DNA from Tg showed a decrease in the fluorescence of the double stranded DNA LCGreen dye (data not shown). When the melting curves were converted to melting peaks by plotting (−dF/dT versus T), a melting peak was observed with apparent Tm of 86.26 ± 0.6°C, which is the Tm specific for AβPP gene. Since no AβPP transgenic genes existed in WT individuals, so no AβPP gene was amplified and gave rise to a flat melting curve with no fluorescence intensity. Also no single melting peak was observed in the converted −dF/dT versus T plot. Hence, this assay could easily distinguish AD Tg mice from WT individuals.
Brain weight
The wet weight of all mouse brain samples of each anatomic position (cerebrum, cerebellum, and hippocampus) in AD-Tg/WT mice at 3 age stages were measured before tissue homogenization. Overall mean brain weights were 0.52 ± 0.02 and 0.51 ± 0.02 g; 0.50 ± 0.01 and 0.56 ± 0.01 g; and 0.49 ± 0.03 and 0.41 ± 0.01 g for Tg and WT mice at 1, 5, and 11 months, respectively. One-way ANOVA for total brain weights of wild type mice showed a significant age effect (p < 0.005). Compared to the 5-month-old mice, total brain weight of WT mice lost 7.64% at 11 months as indicated in Fig. 1. Moreover, total mouse brain weight exhibited genotype difference between Tg and WT for 5- and 11-month-old mice (p < 0.001); higher brain weight was observed in WT at 5 months, whereas increased brain weight was shown in the Tg mice at 11 months. Also, at 5 months, WT had significantly lower cerebrum weight than its Tg counterpart (p = 0.03).
Fig. 1.
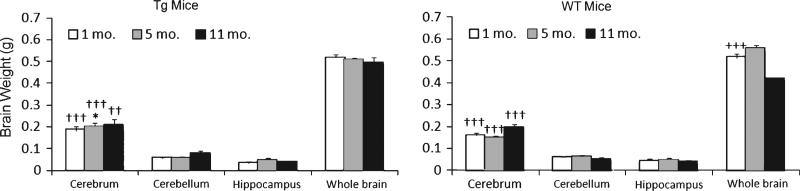
Comparison of wet brain weight in hippocampus, cerebellum,and cerebrum, total weight of AD-Tg/WT mice at 3 age stages. Data are presented as means ± SEM for 30 animals. Age effect: 1 month versus 5 months versus 11 months (+++p < 0.001). Genotype effect: Tg versus WT (*p < 0.050). Tissue effect: hippocampus versus cerebrum versus cerebellum (††p < 0.01, †††p < 0.001).
Tissue glutathione status in specific brain regions
Age effect on GSH, GSSG, and GSH/GSSG ratio
HPLC was used to measure the level of GSH and GSSG in three anatomic positions of brain tissue of AD-Tg/WT mice at 1, 5, and 11 months. The GSH/GSSG ratio was calculated from these quantitative measurements. The results are shown in Fig. 2. GSH content in cerebrum of AD-Tg mice at 1 month was the highest, and the levels decreased 17% and 40% at 5 and 11 months, respectively (p = 0.03). On the contrary, age-matched WT mice had significant increases in GSH amounts in cerebellum with age; 42% and 78% increases at 5 months and 11 months, respectively, compared to 1-month-old mice (p = 0.03).
Fig. 2.

GSH and GSSG levels and GSH/GSSG ratio in 1-, 5-, and 11-month-old Tg and WT specific brain regions, viz., hippocampus, cerebellum, and cerebrum. Both (A) GSH and (B) GSSG levels were determined by reverse-phase HPLC following derivatization of samples with FDNB as described in Methods; and (C) calculated GSH/GSSG ratio. GSH and GSSG are expressed as nmol/mg proteins and presented as means SEM (n = 5/group). Age effect: 1 month versus 5 months versus 11 months (+p < 0.05, ++p < 0.01). Genotype effect: Tg versus WT (*p < 0.05).±Tissue effect: hippocampus versus cerebrum versus cerebellum (†p < 0.05, ††p < 0.01, †††p < 0.001).
As shown in Fig. 2B, there was a significant decrease (45%) in GSSG production in hippocampus of 5-month-old Tg mice compared to the 1-month-old young mice (p = 0.01). However, a 69% increase in GSSG levels from 5-month-old mice to 11-month-old mice (p = 0.01) was observed. Similarly, in Tg cerebrum, a significant decrease of GSSG from 0.29 to 0.09 nmol/mg protein was observed from 1-month to 5-month old, followed by an increase to 0.12 nmol/mg protein at 11 months old (p = 0.009). In particular, there was a decline of 46%, 45%, and 39% of the GSH/GSSG ratio in cerebrum, cerebellum, and hippocampus, respectively in aged transgenic animals at 11-months old compared with the 5-month-old mice.
Additionally, the aging effect on GSSG was observed in WT mice. Specifically, one-way ANOVA for GSSG level of WT type showed a 63% and 56% significant increase from 5-month-old to 11-month-old mice in cerebrum (p = 0.02) and in cerebellum (p < 0.01), respectively.
Genotype effect on GSH, GSSG, and GSH/GSSG ratio
The results in Fig. 2 further revealed significant genotype differences in the GSH redox status between Tg and WT mice. The Tg cerebrum exhibited a GSH value of 0.38 nmol/mg of protein, which is 20% less than its WT counterpart (p = 0.03). Also, GSH content was increased by 64% in 11-month-old WT mouse cerebellum than the Tg counterpart (p = 0.04). Genotypic differences in GSSG levels were evident in 1-month (p = 0.02) and 5-month-old mice (p = 0.03) cerebrum. Specifically, significant GSSG increases of 90% and 44% in Tg and WT were observed at these two stages.
Specific brain regional effect on GSH, GSSG, and GSH/GSSG ratio
In terms of brain regions, a significant difference in GSH content was observed for AD-Tg mice at 1 month. In young mice, the highest baseline level of GSH was seen in the cerebellum and the lower values in the hippocampus and cerebrum. This trend generally continued in aged mice. Regarding GSSG variation in different brain regions, cerebrum exhibited decreases of 59% and 62% than cerebellum for 5-month-old Tg (p = 0.004) and at 11 months (p < 0.001), respectively. For WT, significant decreases of 62% and 61% in GSSG in cerebrum than in cerebellum were observed at 5 months (p = 0.01) and at 11 months (p < 0.001), respectively.
Blood glutathione status
One-way ANOVA for blood GSH level in Tg mice (Table 1) showed a significant increase of 1.6 fold in 11-month-old compared with 1-month-old mice (p < 0.005). Moreover, significant age effect was observed in GSSG levels between 1-month and 11-month olds, with an increase of 37% with aging (p < 0.005). Blood GSH level in Tg mice at 1 month is 96% less than its WT counterpart (p = 0.05). It is notable that both GSH and GSSG levels in blood were significantly higher than in brain tissues regardless of genotype. For example, basal GSH level in the blood of 11-month-old Tg, 8.39 nmol/mg protein (Table 1), was 20-fold higher than that in the hippocampus (0.47 nmol/mg protein) at the same age group (Fig. 2A).
Table 1.
Blood glutathione status
| Blood | Tg |
WT |
||||
|---|---|---|---|---|---|---|
| 1 month (n = 5) | 5 month (n = 5) | 11 month (n = 5) | 1 month (n = 5) | 5 month (n = 5) | 11 month (n = 5) | |
| GSH | 3.19 ± 1.17++* | 8.27 ± 0.65 | 8.39 ± 1.07 | 6.24 ± 0.75 | 8.61 ± 0.85 | 9.08 ± 1.71 |
| GSSG | 7.01 ± 1.90++* | 15.99 ± 1.36 | 18.25 ± 2.35 | 12.40 ± 0.49 | 16.21 ± 2.55 | 18.75 ± 7.95 |
| GSH/GSSG | 0.45 ± 0.14 | 0.52 ± 0.03 | 0.46 ± 0.03 | 0.50 ± 0.04 | 0.53 ± 0.07 | 0.48 ± 0.04 |
GSH and GSSG levels are expressed in μmol/ml and presented as means ± SEM with the number of mice per group indicated in parenthesis.
Age effect: 1 month versus 5 months versus 11 months (p < 0.01).
Genotype effect: Tg versus WT (p < 0.05).
Mixed-disulfide status
Age effect
Next, we examined protein glutathione levels. Significant age differences were found in Pr-SSG contents at all 3 age stages in Tg-cerebrum (p = 0.03), Tg-cerebellum (p = 0.04), and Tg-blood (p = 0.04) with increases of Pr-SSG levels from 1-month to 11-month-old mice (Fig. 3). Also, 5-month-old animals exhibited significant decreases of 1.5- and 5.4- and 4.8-fold in Pr-SSG levels in these brain regions and blood, respectively when compared with 1-month old. Similar to what was observed in GSSG fluctuations with aging in Tg mice (see Fig. 2B), we observed a dip in GSSG levels at 5 months rather than a steady increase in Pr-SSG with aging.
Fig. 3.

Levels of mixed-disulfides (Pr-SSG, glutathionylated proteins) in specific brain regions in 1-, 5-, and 11-month-old Tg and WT mice. Data are expressed as nmol/mg proteins and presented as means ± SEM. Age effect: 1 month versus 5 months versus 11 months (+p < 0.05). Genotype effect: Tg versus WT (*p < 0.05, **p < 0.01). Tissue effect: hippocampus versus cerebrum versus cerebellum (†p < 0.05, ††p < 0.01).
Genotype effect
No Pr-SSG was detected in 1-month-old WT mice brain tissues except the hippocampus, whereas high Pr-SSG levels were found in Tg brain tissues at this early stage. As shown in Fig. 3, the levels of Pr-SSG in Tg-cerebrum were 1.6- and 8-fold higher than its WT counterparts at 5 months (p = 0.006) and 11 months (p = 0.01), respectively. Additionally, the cerebellum showed a significant genotype effect at 1 month (p = 0.03) and 11 months (p = 0.04).
Specific brain regional effect
No significant tissue effect was seen in the different Tg brain regions, but differences between hippocampus and other brain regions were observed in WT mice at 1 month (p = 0.005) and at 11 months (p = 0.04). As compared to WT-cerebrum and cerebellum, the hippocampus was the only region that started to show the detectable levels of Pr-SSG at 1 month. At 11 months, hippocampal Pr-SSG in WT was 27% higher than cerebellum. These findings support the notion that increased formation of Pr-SSG contributes to the specific vulnerability of the hippocampal zone of the AD brain.
Enzymatic activity
Because of the observed changes in glutahione redox (Figs. 2 and 3), we also examined the two key enzymes of the glutathione redox cycle: GPx converts GSH to GSSG in the presence of hydroperoxides, GR catalyzes the conversion of GSSG to GSH with a cofactor, NADPH. Statistical analysis of GR and GPx activities was done by one-way ANOVA shown in Fig. 4. The results indicate no age or genotyping difference in GR activity. Also, no genotyping effect was observed in GPx. However, GPx activity shows significant increase in aging for both AD-Tg (p < 0.001) and WT mice (p = 0.01). In specific, comparing the two age stages (1-month versus 24-months), GPx activity increased from 24.7 to 43.5 nmol/min/ml in AD-Tg and from 26.1 to 43.5 nmol/min/ml in WT brain. The relative higher increase in GPx activity compared to GR activity suggests that glutathione redox cycling might be compromised in the old mouse brain.
Fig. 4.

Activities of GR and GPx in AD-Tg/WT mouse brain at 1, 5, and 24 months. Data are expressed as nmol/min/ml and presented as means ± SEM. Age effect: 1 month versus 5 months versus 24 months (+p < 0.05, ++p < 0.01).
DISCUSSION
The aims of the present study were to quantify tissue glutathione (GSH and GSSG) and glutathionylated proteins (mixed-disulfides, Pr-SSG) levels in brain and blood at three ages (1, 5, and 11 months) in a Tg mouse model of AD and compared these levels to those found in WT littermates. In addition, tissue differences in glutathione levels were investigated in the hippocampus, cerebrum, and cerebellum regions of Tg and WT brains.
As indicated in Fig. 1, the absolute brain weight in 5-month-old WT mice was 12% higher than their AD counterparts. Interestingly, the 11-month Tg mice demonstrated a significant (20%) increase in brain weight as compared to WT animals at the same age. Also, one-way ANOVA analysis showed that the total protein of AD-Tg brains significantly increases from 2.5 (at 5 months) to 3.4 mg/ml (11 months) with aging. It is conceivable that the blood brain barrier is compromised in aged Tg mice, which would contribute to increased fluid filtration, perhaps even serum protein from vessel lumen to the brain. This suggestion is supported by previous autopsy findings that an enhanced expression of aquaporin 4, the protein channels involved in water transport, leads to edema formation in AD [40]. This interesting observation suggests an association of AD with brain inflammation, a subject of future investigation in our laboratory using this AD mouse model.
Age effect on GSH, GSSG, and mixed-disulfides
In this work, we tried to address the hypothesis that oxidative stress, specifically the formation of GSSG and glutathionylated proteins, is an early event prior to amyloid plaque manifestation in AD progression. Our current use of 1-month-old mice that have not developed amyloid pathologies revealed that substantial increase in protein-thiol oxidation (Pr-SSG formation) occurred in the absence of neuropathological markers, thus supporting the view that an early loss of cerebral glutathione redox balance precedes disease manifestation. Additional support comes from previous studies demonstrating that the aging process is associated with generation of ROS and disturbance of glutathione homeostasis in the brain [35, 41]. The 11-month-old aged mice, long after Aβ generation, represented a suitable model for AD progression. Our results demonstrated significant age-related reduction of tissue GSH levels in the cerebrum and associated decreases in the GSH/GSSG ratio in all brain regions from 5 months (right before Aβ deposition) to 11 months, a stage when Aβ deposits are abundant. This age-related decline in brain GSH level and the GSH/GSSG ratio is consistent with reduced GSH synthesis, as evidenced by a decrease in γ-glutamylcysteine ligase, the rate-limiting enzyme in GSH synthesis during aging [42]. Surprisingly, the brain GSSG levels in 5-month-old mice were lower than 1-month olds, suggesting that the 5-month-old brain may be more resistant to oxidative stress. The “dip-down” at 5 months was observed for both GSSG and Pr-SSG levels with a corresponding increase in the GSH/GSSG ratio in all brain regions. Thus, it appears that the transgenes induce a stress response to compensate for its expression and this leads to early increase in S-glutathionylation, but the animals reach equilibrium, probably due to the large excess capacity at the middle age. Then the response repeats during plaque deposition at the later stage.
The study of GSH redox state in blood not only serves as an index of oxidative stress status, but also offers a comparison between age-related differences in GSH redox status between the brain and blood. Interestingly, Pr-SSG was not detectable in blood at 1 month, regardless of genotype; however, Pr-SSG levels were significantly elevated in 5- and 11-month olds, respectively. The summation of the total thiol pool revealed that approximately 80–90% of blood thiols are in the form of oxidized disulfides of which 40–50% are protein bound. Furthermore, the concentrations of GSH plus GSSG in blood were 2-to-3 fold higher than those in brain tissues. It is notable that the level of GSH was increased 1.6 fold in blood from 1 to 5 months in Tg mice. While the significance of this increase is unresolved, typically higher blood GSH could act to scavenge superoxide and hydroxyl radical.
The dramatic increase in Pr-SSG in blood at 5 months coupled to the dip in GSSG and Pr-SSG in the brain (Fig. 3) suggests an interesting scenario, namely, that an increase in brain-to-blood export of GSSG at an age right before Aβ manifestation. The consequent increase in systemic oxidative stress would be consistent with increased formation of glutathionylated proteins (Pr-SSG) in the blood. It is not clear whether this mixed-disulfide increase is primarily due to GSSG export from brain or perhaps collectively from some other tissues such as liver. Although these hypothetic scenarios require further investigation and validation, it is confirmed by previous findings that aging enhanced a cell's ability to export GSSG as a mechanism to maintain cellular redox homeostasis [43, 44]. Some of the proteins responsible for GSSG export have been identified; reportedly, the multidrug resistant protein 1 (Mrp1) mediates GSSG efflux and maintains GSH homeostasis. Mrp1 is expressed in brain tissues, and has been implicated in GSSG export in primary cultures of rat astrocytes [45] and mouse astrocytes [46]. Mrps function as organic anion export pumps and accept glutathione S-conjugates as substrates [47–49]. Altogether, these results support the contention that oxidative stress occurs before amyloid plaque deposition in AD brain, an early event in AD progression [50–52]. Our current study suggests that intracellular brain GSH/GSSG status is differentially regulated during AD progression, and that the rate of GSH synthesis and/or GSSG export are likely to play important roles in cellular GSH redox homeostasis. Our main goal of this study is to characterize glutathione redox status in details; and these observations will further facilitate future studies into why these changes occur. Particularly, we will investigate whether these changes in glutathione redox status are closely related to the change in γ-glutamylcysteine (for GSH synthesis) or MRP-1 (for GSH and GSSG export). Additionally, we will examine whether the change in GSH/GSSG is attributed from apoptosis induced by amyloid aggregation.
Genotype effect on GSH, GSSG, and mixed-disulfides
The level of GSH in cerebrum and cerebellum of 11-month-old Tg mice were decreased as compared to WT littermates, while GSSG was elevated in 1- and 5-month-old Tg animals. Moreover, the data in Fig. 3 demonstrates the existence of significant mixed disulfides, suggesting that oxidative modification of protein thiols was evident in various brain regions, most dramatically in Tg mice. For example, at 11 months, glutathionylated proteins (Pr-SSG) were substantially elevated in the three regions of the brain and blood in Tg animals as compared to the WT counterpart. Even at 1 month, baseline Pr-SSG in Tg animals was higher than the WT counterpart, which is consistent with an elevated basal oxidative state in Tg mice at an early stage before evidence of Aβ generation. Also, it is noteworthy that the content of protein-bound glutathione was variable, from 15 to 24 nmol/mg in the different brain regions of 11-month-old Tg animals and represented a major percentage of total glutathione (range of free GSH was between 0.1 and 0.8 nmol/mg). Previous studies demonstrated a wide range in the GSH/GSSG ratio in the brain, from 2 to 200, under conditions of oxidative stress, disease, or aging [53–55]. In our study, the GSH/GSSG ratio ranged from 2 to 7; the ratio in all brain regions in aged Tg mice (11-month olds) were significantly lower than their WT counterpart. This is consistent with a relatively more oxidized basal intra-cellular environment and suggests that the Tg brain would be selectively vulnerable to ROS damage.
Specific brain region effect on GSH, GSSG, and mixed-disulfides
The three brain tissues of hippocampus, cerebrum, and cerebellum were examined to evaluate whether regional differences exist in cellular GSH redox status and whether elevation in GSSG and Pr-SSG formation was associated with regional vulnerability during AD progression. Notably, the basal level of Pr-SSG was high in the hippocampus, even in the age-matched WT mice, suggesting that, regardless of genotype, the hippocampus is likely to be a vulnerable region of the brain to oxidative stress. Significantly, AD is associated with hippocampal damage and loss of cognitive functions of the brain. Thus the finding of altered tissue redox status before the onset of amyloid plaque formation underscores the importance of evaluating redox changes at early stage AD progression for early detection.
GSH is present in millimolar (mM) concentrations in the brain [6]. However, previous reports of GSH abundance among various brain regions were inconsistent [55–57]. Studies by Zhu [55] and Liu [56] showed that GSH levels were similar in all brain regions, including cortex, cerebellum, and hippocampus in Sprague-Dawley and Fisher 344 rats, respectively. In other studies, Abbott and colleagues reported that in 4-month-old mice, the levels of GSH varied in different anatomic regions of the brain with the cortex exhibiting the highest value followed by cerebellum and hippocampus [57, 58]. However, our results indicate cerebellum in both AD-Tg and wild type mice have the highest GSH level among all the brain regions examined, regardless of age difference (Fig. 2). Interestingly, the cerebellum is the region of the brain that is most resistant to age-associated AD pathology. The discrepancy between the studies of Zhu and Liu [55–57] and those of Abbott et al. [57, 58] and our current work could be due to species differences (rat versus mice) as well as differences in animal strains, housing, environmental, and dietary factors. Although there were many GSH/GSSG studies using AD mouse model [59–61], we have performed the systematical measurements in differentiating the ROS induced GSH/GSSG and Pr-SSG alternations using three aspects: age, genotypes, and brain regions.
In summary, the present study has characterized the age-dependent status of glutathione and mixed-disulfide in specific regions of the brain and blood of a transgenic mouse model of AD, which provided the ground work for future investigation into the relationship between GSH and Aβ regulation, as well as into the mechanism of GSH redox control in AD brain. The results will have important implication for age-dependent and regional selective pathobiology of AD progression.
To our knowledge, this is the first time such a study was undertaken and these observations can serve as a supporting platform for future investigation. For example, two opposite regimes, glutathione stimulator (N-acetyl-L-cysteine) and inhibitor (diamine) can be employed to further pinpoint whether alteration of GSH/GSSG ratio can accelerate or decelerate amyloid plaque onset. Another interesting example will involve studying how the fluctuation in GSH correlate with the change in NOX (NADPH oxidase 1/2), NOS (nitric oxide synthesis), and mitochondrial function. Altogether, an understanding of regional and age differences in GSH and mixed-disulfide redox status will provide important insights into differential antioxidant capacity and oxidative susceptibility in the specific regions of AD brain.
CONCLUSIONS
The data from this study demonstrated that altered GSH redox balance in specific brain regions is ageand genotype-linked in the transgenic model of AD (B6.Cg). Collectively, the data show that GSH redox imbalance and subsequent S-glutathionylation of proteins are early events, and provides a time line for when these redox changes occur during AD progression. These results will underpin investigations into the mechanism of AD-associated oxidative disruption of brain GSH homeostasis; this information will be useful in future study of longitudinal changes in oxidative stress and cognitive behavior in AD in this Tg mouse model.
ACKNOWLEDGMENTS
This study was supported by the National Institutes of Health and the National Center for Research Resources Grant P20RR016456 (JF) and NIH grant #DK44510 (TYA).
Footnotes
Authors’ disclosures available online http://www.jalz.com/disclosures/view.php?id=1028.
REFERENCES
- 1.Chong MS, Lim WS, Sahadevan S. Biomarkers in pre-clinical Alzheimer's disease. Curr Opin Investig Drugs. 2006;7:600–607. [PubMed] [Google Scholar]
- 2.de Leon MJ, DeSanti S, Zinkowski R, Mehta PD, Pratico D, Segal S, Clark C, Kerkman D, DeBernardis J, Li J, Lair L, Reisberg B, Tsui W, Rusinek H. MRI and CSF studies in the early diagnosis of Alzheimer's disease. J Intern Med. 2004;256:205–223. doi: 10.1111/j.1365-2796.2004.01381.x. [DOI] [PubMed] [Google Scholar]
- 3.Chauhan V, Chauhan A. Oxidative stress in Alzheimer's disease. Pathophysiology. 2006;13:195–208. doi: 10.1016/j.pathophys.2006.05.004. [DOI] [PubMed] [Google Scholar]
- 4.Coyle JT, Puttfarcken P. Oxidative stress, glutamate, and neurodegenerative disorders. Science. 1993;262:689–695. doi: 10.1126/science.7901908. [DOI] [PubMed] [Google Scholar]
- 5.Aoyama K, Watabe M, Nakaki T. Regulation of neuronal glutathione synthesis. J Pharmacol Sci. 2008;108:227–238. doi: 10.1254/jphs.08r01cr. [DOI] [PubMed] [Google Scholar]
- 6.Dringen R. Glutathione metabolism and oxidative stress in neurodegeneration. Eur J Biochem. 2000;267:4903. doi: 10.1046/j.1432-1327.2000.01651.x. [DOI] [PubMed] [Google Scholar]
- 7.Martin I, Grotewiel MS. Oxidative damage and age-related functional declines. Mech Ageing Dev. 2006;127:411–423. doi: 10.1016/j.mad.2006.01.008. [DOI] [PubMed] [Google Scholar]
- 8.Gate KM, Lartaud I, Giummelly P, Legrand R, Pompella A, Leroy P. Accurate measurement of reduced glutathione in gamma-glutamyltransferase-rich brain microvessel fractions. Brain Res. 1369:95–102. doi: 10.1016/j.brainres.2010.10.100. [DOI] [PubMed] [Google Scholar]
- 9.Tchantchou F, Graves M, Rogers E, Ortiz D, Shea TB. N-acteyl cysteine alleviates oxidative damage to central nervous system of ApoE-deficient mice following folate and vitamin E-deficiency. J Alzheimers Dis. 2005;7:135–138. doi: 10.3233/jad-2005-7206. discussion 173-180. [DOI] [PubMed] [Google Scholar]
- 10.Meister A, Anderson ME. Glutathione. Annu Rev Biochem. 1983;52:711–760. doi: 10.1146/annurev.bi.52.070183.003431. [DOI] [PubMed] [Google Scholar]
- 11.Kleinman WA, Komninou D, Leutzinger Y, Colosimo S, Cox J, Lang CA, Richie JP., Jr Protein glutathiolation in human blood. Biochem Pharmacol. 2003;65:741–746. doi: 10.1016/s0006-2952(02)01560-5. [DOI] [PubMed] [Google Scholar]
- 12.Cotgreave IA, Gerdes RG. Recent trends in glutathione biochemistry–glutathione-protein interactions: A molecular link between oxidative stress and cell proliferation? Biochem Biophys Res Commun. 1998;242:1–9. doi: 10.1006/bbrc.1997.7812. [DOI] [PubMed] [Google Scholar]
- 13.Pirmohamed M, Williams D, Tingle MD, Barry M, Khoo SH, O'Mahony C, Wilkins EG, Breckenridge AM, Park BK. Intracellular glutathione in the peripheral blood cells of HIV-infected patients: Failure to show a deficiency. AIDS. 1996;10:501–507. doi: 10.1097/00002030-199605000-00008. [DOI] [PubMed] [Google Scholar]
- 14.Jones DP, Carlson JL, Samiec PS, Sternberg P, Jr, Mody VC, Jr, Reed RL, Brown LA. Glutathione measurement in human plasma. Evaluation of sample collection, storage and derivatization conditions for analysis of dansyl derivatives by HPLC. Clin Chim Acta. 1998;275:175–184. doi: 10.1016/s0009-8981(98)00089-8. [DOI] [PubMed] [Google Scholar]
- 15.Liskowsky W, Schliebs R. Muscarinic acetylcholine receptor inhibition in transgenic Alzheimer-like Tg2576 mice by scopolamine favours the amyloidogenic route of processing of amyloid precursor protein. Int J Dev Neurosci. 2006;24:149–156. doi: 10.1016/j.ijdevneu.2005.11.010. [DOI] [PubMed] [Google Scholar]
- 16.Mehlhorn G, Hollborn M, Schliebs R. Induction of cytokines in glial cells surrounding cortical beta-amyloid plaques in transgenic Tg2576 mice with Alzheimer pathology. Int J Dev Neurosci. 2000;18:423–431. doi: 10.1016/s0736-5748(00)00012-5. [DOI] [PubMed] [Google Scholar]
- 17.Musaro A, Rosenthal N. Transgenic mouse models of muscle aging. Exp Gerontol. 1999;34:147–156. doi: 10.1016/s0531-5565(98)00079-5. [DOI] [PubMed] [Google Scholar]
- 18.Parachikova A, Nichol KE, Cotman CW. Short-term exercise in aged Tg2576 mice alters neuroinflammation and improves cognition. Neurobiol Dis. 2008;30:121–129. doi: 10.1016/j.nbd.2007.12.008. [DOI] [PMC free article] [PubMed] [Google Scholar]
- 19.Wirths O, Weis J, Kayed R, Saido TC, Bayer TA. Age-dependent axonal degeneration in an Alzheimer mouse model. Neurobiol Aging. 2007;28:1689–1699. doi: 10.1016/j.neurobiolaging.2006.07.021. [DOI] [PubMed] [Google Scholar]
- 20.Goto Y, Niidome T, Hongo H, Akaike A, Kihara T, Sugimoto H. Impaired muscarinic regulation of excitatory synaptic transmission in the APPswe/PS1dE9 mouse model of Alzheimer's disease. Eur J Pharmacol. 2008;583:84–91. doi: 10.1016/j.ejphar.2008.01.030. [DOI] [PubMed] [Google Scholar]
- 21.Choi SH, Leight SN, Lee VM, Li T, Wong PC, Johnson JA, Saraiva MJ, Sisodia SS. Accelerated Abeta deposition in APPswe/PS1deltaE9 mice with hemizygous deletions of TTR (transthyretin). J Neurosci. 2007;27:7006–7010. doi: 10.1523/JNEUROSCI.1919-07.2007. [DOI] [PMC free article] [PubMed] [Google Scholar]
- 22.Borchelt DR, Davis J, Fischer M, Lee MK, Slunt HH, Ratovitsky T, Regard J, Copeland NG, Jenkins NA, Sisodia SS, Price DL. A vector for expressing foreign genes in the brains and hearts of transgenic mice. Genet Anal. 1996;13:159–163. doi: 10.1016/s1050-3862(96)00167-2. [DOI] [PubMed] [Google Scholar]
- 23.Borchelt DR, Ratovitski T, van Lare J, Lee MK, Gonzales V, Jenkins NA, Copeland NG, Price DL, Sisodia SS. Accelerated amyloid deposition in the brains of transgenic mice coexpressing mutant presenilin 1 and amyloid precursor proteins. Neuron. 1997;19:939–945. doi: 10.1016/s0896-6273(00)80974-5. [DOI] [PubMed] [Google Scholar]
- 24.Garcia-Alloza M, Borrelli LA, Hyman BT, Bacskai BJ. Antioxidants have a rapid and long-lasting effect on neuritic abnormalities in APP:PS1 mice. Neurobiol Aging. 2010;31:2058–2068. doi: 10.1016/j.neurobiolaging.2008.11.006. [DOI] [PMC free article] [PubMed] [Google Scholar]
- 25.Zhu M, Gu F, Shi J, Hu J, Hu Y, Zhao Z. Increased oxidative stress and astrogliosis responses in conditional double-knockout mice of Alzheimer-like presenilin-1 and presenilin-2. Free Radic Biol Med. 2008;45:1493–1499. doi: 10.1016/j.freeradbiomed.2008.08.027. [DOI] [PubMed] [Google Scholar]
- 26.Gu F, Zhu M, Shi J, Hu Y, Zhao Z. Enhanced oxidative stress is an early event during development of Alzheimer-like pathologies in presenilin conditional knock-out mice. Neurosci Lett. 2008;440:44–48. doi: 10.1016/j.neulet.2008.05.050. [DOI] [PubMed] [Google Scholar]
- 27.Sompol P, Ittarat W, Tangpong J, Chen Y, Doubinskaia I, Batinic-Haberle I, Abdul HM, Butterfield DA, St Clair DK. A neuronal model of Alzheimer's disease: An insight into the mechanisms of oxidative stress-mediated mitochondrial injury. Neuroscience. 2008;153:120–130. doi: 10.1016/j.neuroscience.2008.01.044. [DOI] [PMC free article] [PubMed] [Google Scholar]
- 28.Zhang Q, Zhang X, Chen J, Miao Y, Sun A. Role of caspase-3 in tau truncation at D421 is restricted in transgenic mouse models for tauopathies. J Neurochem. 2009;109:476–484. doi: 10.1111/j.1471-4159.2009.05959.x. [DOI] [PubMed] [Google Scholar]
- 29.Monostori P, Wittmann G, Karg E, Turi S. Determination of glutathione and glutathione disulfide in biological samples: An in-depth review. J Chromatogr B Analyt Technol Biomed Life Sci. 2009;877:3331–3346. doi: 10.1016/j.jchromb.2009.06.016. [DOI] [PubMed] [Google Scholar]
- 30.Muscari C, Pappagallo M, Ferrari D, Giordano E, Capanni C, Caldarera CM, Guarnieri C. Simultaneous detection of reduced and oxidized glutathione in tissues and mitochondria by capillary electrophoresis. J Chromatogr B Biomed Sci Appl. 1998;707:301–307. doi: 10.1016/s0378-4347(97)00595-1. [DOI] [PubMed] [Google Scholar]
- 31.Circu ML, Moyer MP, Harrison L, Aw TY. Contribution of glutathione status to oxidant-induced mitochondrial DNA damage in colonic epithelial cells. Free Radic Biol Med. 2009;47:1190–1198. doi: 10.1016/j.freeradbiomed.2009.07.032. [DOI] [PMC free article] [PubMed] [Google Scholar]
- 32.Hansen RE, Winther JR. An introduction to methods for analyzing thiols and disulfides: Reactions, reagents, and practical considerations. Anal Biochem. 2009;394:147–158. doi: 10.1016/j.ab.2009.07.051. [DOI] [PubMed] [Google Scholar]
- 33.Okouchi M, Okayama N, Aw TY. Hyperglycemia potentiates carbonyl stress-induced apoptosis in naive PC-12 cells: Relationship to cellular redox and activator protease factor-1 expression. Curr Neurovasc Res. 2005;2:375–386. doi: 10.2174/156720205774962665. [DOI] [PubMed] [Google Scholar]
- 34.Circu ML, Rodriguez C, Maloney R, Moyer MP, Aw TY. Contribution of mitochondrial GSH transport to matrix GSH status and colonic epithelial cell apoptosis. Free Radic Biol Med. 2008;44:768–778. doi: 10.1016/j.freeradbiomed.2007.09.011. [DOI] [PMC free article] [PubMed] [Google Scholar]
- 35.Klatt P, Lamas S. Regulation of protein function by S-glutathiolation in response to oxidative and nitrosative stress. Eur J Biochem. 2000;267:4928–4944. doi: 10.1046/j.1432-1327.2000.01601.x. [DOI] [PubMed] [Google Scholar]
- 36.Hansen RE, Qstergaard H, Norgaard P, Winther JR. Quantification of protein thiols and dithiols in the picomolar range using sodium borohydride and 4,4′-dithiodipyridine. Anal Biochem. 2007;363:77–82. doi: 10.1016/j.ab.2007.01.002. [DOI] [PubMed] [Google Scholar]
- 37.Gow AJ, Chen Q, Hess DT, Day BJ, Ischiropoulos H, Stamler JS. Basal and stimulated protein S-nitrosylation in multiple cell types and tissues. J Biol Chem. 2002;277:9637–9640. doi: 10.1074/jbc.C100746200. [DOI] [PubMed] [Google Scholar]
- 38.Zhang Y, Hogg N. Formation and stability of S-nitrosothiols in RAW 264.7 cells. Am J Physiol Lung Cell Mol Physiol. 2004;287:L467–L474. doi: 10.1152/ajplung.00350.2003. [DOI] [PubMed] [Google Scholar]
- 39.Martinez-Ruiz A, Lamas S. Detection and identification of S-nitrosylated proteins in endothelial cells. Methods Enzymol. 2005;396:131–139. doi: 10.1016/S0076-6879(05)96013-8. [DOI] [PubMed] [Google Scholar]
- 40.Moftakhar P, Lynch MD, Pomakian JL, Vinters HV. Aquaporin expression in the brains of patients with or without cerebral amyloid angiopathy. J Neuropathol Exp Neurol. 69:1201–1209. doi: 10.1097/NEN.0b013e3181fd252c. [DOI] [PMC free article] [PubMed] [Google Scholar]
- 41.Rebrin I, Kamzalov S, Sohal RS. Effects of age and caloric restriction on glutathione redox state in mice. Free Radic Biol Med. 2003;35:626–635. doi: 10.1016/s0891-5849(03)00388-5. [DOI] [PMC free article] [PubMed] [Google Scholar]
- 42.Liu R, Choi J. Age-associated decline in gamma-glutamylcysteine synthetase gene expression in rats. Free Radic Biol Med. 2000;28:566–574. doi: 10.1016/s0891-5849(99)00269-5. [DOI] [PubMed] [Google Scholar]
- 43.Leichtweis S, Leeuwenburgh C, Bejma J, Ji LL. Aged rat hearts are not more susceptible to ischemia-reperfusion injury in vivo: Role of glutathione. Mech Ageing Dev. 2001;122:503–518. doi: 10.1016/s0047-6374(00)00253-0. [DOI] [PubMed] [Google Scholar]
- 44.Sies H, Graf P. Hepatic thiol and glutathione efflux under the influence of vasopressin, phenylephrine and adrenaline. Biochem J. 1985;226:545–549. doi: 10.1042/bj2260545. [DOI] [PMC free article] [PubMed] [Google Scholar]
- 45.Minich T, Riemer J, Schulz JB, Wielinga P, Wijnholds J, Dringen R. The multidrug resistance protein 1 (Mrp1), but not Mrp5, mediates export of glutathione and glutathione disulfide from brain astrocytes. J Neurochem. 2006;97:373–384. doi: 10.1111/j.1471-4159.2006.03737.x. [DOI] [PubMed] [Google Scholar]
- 46.Ronaldson PT, Bendayan R. HIV-1 viral envelope glycoprotein gp120 produces oxidative stress and regulates the functional expression of multidrug resistance protein-1 (Mrp1) in glial cells. J Neurochem. 2008;106:1298–1313. doi: 10.1111/j.1471-4159.2008.05479.x. [DOI] [PubMed] [Google Scholar]
- 47.Borst P, Evers R, Kool M, Wijnholds J. A family of drug transporters: The multidrug resistance-associated proteins. J Natl Cancer Inst. 2000;92:1295–1302. doi: 10.1093/jnci/92.16.1295. [DOI] [PubMed] [Google Scholar]
- 48.Deeley RG, Westlake C, Cole SP. Transmembrane transport of endo- and xenobiotics by mammalian ATP-binding cassette multidrug resistance proteins. Physiol Rev. 2006;86:849–899. doi: 10.1152/physrev.00035.2005. [DOI] [PubMed] [Google Scholar]
- 49.Ilias A, Urban Z, Seidl TL, Le Saux O, Sinko E, Boyd CD, Sarkadi B, Varadi A. Loss of ATP-dependent transport activity in pseudoxanthoma elasticum-associated mutants of human ABCC6 (MRP6). J Biol Chem. 2002;277:16860–16867. doi: 10.1074/jbc.M110918200. [DOI] [PubMed] [Google Scholar]
- 50.Aliev G, Smith MA, Seyidov D, Neal ML, Lamb BT, Nunomura A, Gasimov EK, Vinters HV, Perry G, LaManna JC, Friedland RP. The role of oxidative stress in the pathophysiology of cerebrovascular lesions in Alzheimer's disease. Brain Pathol. 2002;12:21–35. doi: 10.1111/j.1750-3639.2002.tb00419.x. [DOI] [PMC free article] [PubMed] [Google Scholar]
- 51.Perry G, Nunomura A, Hirai K, Takeda A, Aliev G, Smith MA. Oxidative damage in Alzheimer's disease: The metabolic dimension. Int J Dev Neurosci. 2000;18:417–421. doi: 10.1016/s0736-5748(00)00006-x. [DOI] [PubMed] [Google Scholar]
- 52.Smith MA, Perry G, Pryor WA. Causes and consequences of oxidative stress in Alzheimer's disease. Free Radic Biol Med. 2002;32:1049. doi: 10.1016/s0891-5849(02)00793-1. [DOI] [PubMed] [Google Scholar]
- 53.Samuele A, Mangiagalli A, Armentero MT, Fancellu R, Bazzini E, Vairetti M, Ferrigno A, Richelmi P, Nappi G, Blandini F. Oxidative stress and pro-apoptotic conditions in a rodent model of Wilson's disease. Biochim Biophys Acta. 2005;1741:325–330. doi: 10.1016/j.bbadis.2005.06.004. [DOI] [PubMed] [Google Scholar]
- 54.Lipton JW, Gyawali S, Borys ED, Koprich JB, Ptaszny M, McGuire SO. Prenatal cocaine administration increases glutathione and alpha-tocopherol oxidation in fetal rat brain. Brain Res Dev Brain Res. 2003;147:77–84. doi: 10.1016/j.devbrainres.2003.08.006. [DOI] [PubMed] [Google Scholar]
- 55.Zhu Y, Carvey PM, Ling Z. Age-related changes in glutathione and glutathione-related enzymes in rat brain. Brain Res. 2006;1090:35–44. doi: 10.1016/j.brainres.2006.03.063. [DOI] [PMC free article] [PubMed] [Google Scholar]
- 56.Liu RM. Down-regulation of gamma-glutamylcysteine synthetase regulatory subunit gene expression in rat brain tissue during aging. J Neurosci Res. 2002;68:344–351. doi: 10.1002/jnr.10217. [DOI] [PubMed] [Google Scholar]
- 57.Abbott LC, Nejad HH, Bottje WG, Hassan AS. Glutathione levels in specific brain regions of genetically epileptic (tg/tg) mice. Brain Res Bull. 1990;25:629–631. doi: 10.1016/0361-9230(90)90124-i. [DOI] [PubMed] [Google Scholar]
- 58.Kang Y, Viswanath V, Jha N, Qiao X, Mo JQ, Andersen JK. Brain gamma-glutamyl cysteine synthetase (GCS) mRNA expression patterns correlate with regional-specific enzyme activities and glutathione levels. J Neurosci Res. 1999;58:436–441. [PubMed] [Google Scholar]
- 59.Garcia T, Esparza JL, Nogues MR, Romeu M, Domingo JL, Gomez M. Oxidative stress status and RNA expression in hippocampus of an animal model of Alzheimer's disease after chronic exposure to aluminum. Hippocampus. 2010;20:218–225. doi: 10.1002/hipo.20612. [DOI] [PubMed] [Google Scholar]
- 60.Resende RR, Alves AS, Britto LR, Ulrich H. Role of acetylcholine receptors in proliferation and differentiation of P19 embryonal carcinoma cells. Exp Cell Res. 2008;314:1429–1443. doi: 10.1016/j.yexcr.2008.01.003. [DOI] [PubMed] [Google Scholar]
- 61.Ames BN, Liu J. Delaying the mitochondrial decay of aging with acetylcarnitine. Ann N Y Acad Sci. 2004;1033:108–116. doi: 10.1196/annals.1320.010. [DOI] [PubMed] [Google Scholar]