

Abstract
Epithelial-to-mesenchymal transition (EMT) has been associated with poor treatment outcomes in various malignancies and is inversely associated with miRNA-145 expression. Therefore, we hypothesized that SNAI2 (Slug) may mediate 5FU chemotherapy resistance through inhibition of miR-145 in colorectal cancer (CRC) and thus, represents a novel therapeutic target to enhance current CRC treatment strategies. Compared to parental DLD1 colon cancer cells, 5FU-resistant (5FUr) DLD1 cells demonstrated features of EMT, including >2-fold enhanced invasion (p<0.001) and migration, suppressed E-Cadherin expression, and 2-fold increased SNAI2 expression. DLD1 and HCT116 cells with stable expression of SNAI2 (DLD1/SNAI2; HCT116/SNAI2) also demonstrated EMT features such as the decreased E-Cadherin, as well as significantly decreased miR-145 expression, as compared to control empty vector cells. Based on a miR-145 luciferase promoter assay, we demonstrated that SNAI2 repressed activity of the miR-145 promoter in the DLD1 and HCT116 cells. In addition, the ectopic expressing SNAI2 cell lines demonstrated decreased 5FU sensitivity and conversely, miR-145 replacement significantly enhanced 5FU sensitivity. In the parental SW620 colon cancer cell line with high SNAI2 and low miR-145 levels, inhibition of SNAI2 directly with short hairpin sequence for SNAI2 and miR-145 replacement therapy both decreased Vimentin expression and increased in vitro 5FU sensitivity. In pre-treatment rectal cancer patient biopsy samples, low miR-145 expression levels correlated with poor response to neoadjuvant 5FU based chemoradiation. These results suggested that the SNAI2:miR-145 pathway may represent a novel clinical therapeutic target in CRC and may serve as a response predictor to chemoradiation therapy.
Keywords: colon cancer, chemotherapy, E-Cadherin, SNAI2, 5FU, miR-145
Introduction
5-Fluorouracil (5FU) based neoadjuvant chemoradiation therapy has become standard care for patients with advanced rectal cancer, resulting in decreased local recurrence rates, improved tolerance of prescribed therapy, improved organ preservation, and fewer treatment-related complications (1). However, with current preoperative treatment strategies, complete pathologic response only is observed in approximately 20% of cases with ∼40% of the tumors demonstrating no pathologic response (2). Molecular mechanisms resulting in therapeutic resistance in colorectal cancer (CRC) are poorly understood. Therefore, investigating molecular pathways associated with chemoradiation resistance should provide insight into tumor cell survival mechanisms and identify novel targets to improve CRC response to therapy.
Epithelial-to-mesenchymal transition (EMT)-associated phenotypes, including enhanced motility and invasion, have been well characterized in cancer cells (3-5). Recently, mediators of EMT also have been associated with enhanced cellular survival (6,7). Similarly, an inverse relationship between the tumor suppressor microRNA 145 (miR-145) and EMT has been described in breast cancer cells (8,9). Although loss of E-Cadherin has been linked with chemotherapy resistance in CRC, only recently have EMT pathways been identified as mediators of colon cancer chemotherapy resistance (10). In addition, miR-145 also has been linked with 5FU chemotherapy sensitivity in gastric cancer (11). Therefore, we hypothesized that the EMT transcriptional mediator SNAI2 may mediate 5FU resistance through inhibition of miR-145 expression in CRC and, thus, constitutes a novel axis that can be targeted to reverse chemoresistance.
Extending this concept further, expression of EMT-associated genes has been associated with cancer stem cell-like phenotypes in multiple organ systems including colon cancer (10,12,13). The stem cell concept is centered on a hierarchical theory for cancer development suggesting that only specific undifferentiated cancer cells, the tumor-initiating cells, have the ability to self-renew, propagate, and differentiate leading to cancer growth and progression (14). Cancer stem cells (CSC) have demonstrated resistance to therapy and are predictive of poor patient prognosis (12,15,16). Recently, investigators demonstrated that ectopic expression of SNAI1 in CRC cell lines resulted in tumor-initiating properties and increased tumor growth (10). Therefore, therapeutically blocking EMT mediated pathways may also serve to target the tumor initiating cancer cells improving the benefit of conventional anti-neoplastic therapies.
Materials and Methods
Cell Lines and Culture Conditions
Human colon cancer cell lines (DLD1, HCT116, LS174T, HT29 and SW620) were obtained from American Type Culture Collection (ATCC), cultured according to ATCC recommendations, and maintained at 37°C with 5% CO2. Stocks were immediately generated and stored in liquid nitrogen. Cells were only cultured up to 25 passages before being replaced from low passage stocks. Mycoplasma-negative cultures were ensured by PCR testing prior to the investigations (Stratagene, #302108). Cells were monitored throughout the course of these studies and demonstrated consistent morphology and doubling time. 5FU resistant DLD1 colon cancer cell lines were kindly provided by Dr. Bingliang Fang (University of Texas, MD Anderson Cancer Center, Houston, TX) and maintained in 50 μM 5FU confirming 5FU resistance (17). 5FU resistant DLD1 cells were not otherwise authenticated.
SNAI2 Stable Cell Lines
For the generation of DLD1 and HCT116 cells overexpressing SNAI2 (DLD1/SNAI2, HCT/SNAI2), a SNAI2 or empty pCMV-3Tag-1 (kanamycin resistant) vector was transfected into cells using Lipofectamine 2000 according to the manufacturer's recommendations (Invitrogen, Carlsbad, CA) (18). Stable transfected pools of cells were selected in medium containing G418 (400 μg/ml; Invitrogen). SNAI2 was amplified from genomic DNA using SNAI2-specific primers as previously reported (18).
Reagents
5FU was purchased from the pharmacy at the Medical University of South Carolina. The following antibodies were used for immunofluorescence (IF) staining: mouse anti-E-Cadherin antibody (Zymed Laboratories, Carlsbad, CA); goat anti-rabbit horseradish peroxidase-conjugated, horse anti-mouse antibodies and Draq 5 dye (Cell Signaling Technology, Inc.,Danvers, MA); and Alexa Fluor488-conjugated antibodies specific for rabbit and mouse IgG (Molecular Probes, Inc., Eugene, OR). The following antibodies were used for Western blot analyses: E-Cadherin (BD Biosciences), Snai2, Vimentin, Klf4, Sox2, Myc and Nanog (Cell Signaling), Actin (Sigma-Aldrich), and GAPDH (Santa Cruz).
Western Blot Analysis
Cells were suspended in radioimmunoprecipitation assay (RIPA) protein lysis buffer (pH 7.4), containing 20mM sodium phosphate, 150mM sodium chloride, 1% Triton X-100, 5mM EDTA, 5mM phenylmethylsulfonyl fluoride, 1% aprotinin, 1μg/ml leupeptin, and 500μM Na3VO4. Protein concentration was quantified using Bio-Rad protein assay (Bio-Rad Laboratories, Hercules, CA). Twenty μg (or 100μg for CSC transcription factor western blots) of total protein was resolved with SDS-PAGE (10% polyacrylamide gel), and transferred to a polyvinylidene difluoride membrane. Immunoblotting was performed with enhanced chemiluminescence (GE Healthcare, Piscataway, NJ). Blots were probed with commercially available antibodies. All membranes were stripped by incubating in Restore PLUS Western blot stripping buffer (Thermo Scientific, Rockford, IL) for 15 min at room temperature and reprobed with actin or GAPDH antibody for loading control.
Reverse Transcription-PCR
Total RNA from cultured cells was extracted using the RNeasy Plus Mini kit (Qiagen, Valencia, CA). Total RNA (0.8μg) was reverse transcribed in a 20μL reaction using iScript (Bio-Rad, Hercules, CA). Real-Time PCR was performed with 5μl of a 1/16 dilution cDNA for cell line samples using the UPL mono-color probes in the Roche LightCycler 480 machine (Roche Diagnostics, Basel, Switzerland). The conditions for all genes were pre-incubation at 95°C for 10 min, followed by 55 cycles of denaturation at 95°C for 15 sec and amplification/extension at 60°C for 30 sec; after cycle completion, cooling was held for 30 sec at 40°C. Triplicate reactions were run for each cDNA sample. Data were normalized to GAPDH and confirmed with biological replicate samples. Sequences for gene-specific primers and probe numbers are provided in Table 1.
Table 1. SNAI2- and Gene-Specific Primers.
| Primer Name | Forward Sequence (5′ – 3′) | Reverse Sequence (5′ – 3′) | UPL probe # | Product/Amplicon (bp) |
|---|---|---|---|---|
| SNAI2 cDNA | gcgcggatccccgcgctccttcctggtc | gcgcgaattctcagtgtgctacacagcagc | N/A | 815 |
| SNAI2 | tggttgcttcaaggacacat | gttgcagtgagggcaagaa | 7 | 66 |
| E-Cadherin | cccgggacaacgtttattac | gctggctcaagtcaaagtcc | 35 | 72 |
| Snail | gctgcaggactctaatccaga | atctccggaggtgggatg | 11 | 84 |
| Zeb1 | gggaggagcagtgaaagaga | tttcttgcccttcctttctg | 3 | 70 |
| Gapdh | agccacatcgctcagacac | gcccaatacgaccaaatcc | 60 | 66 |
| Vimentin | aaagtgtggctgccaagaac | agcctcagagaggtcagcaa | 16 | 74 |
| Nanog | cactggctgaatccttcctc | aaccagaacacgtggtttcc | 52 | 77 |
| Myc | caccagcagcgactctga | gatccagactctgaccttttgc | 34 | 102 |
MicroRNA Analysis
RNA was extracted as described above using the RNeasyPlus Mini Kit from Qiagen (Valencia, CA). Total RNA (100ng) was reverse transcribed using miR-145 or RNU6B specific primers and the Applied Biosystems reverse transcription kit per the manufacturer's instructions. Real time PCR (qPCR) was performed with 1ul of reverse transcribed cDNA using the TaqMan Assay from Applied Biosystems as per the manufacturer's instructions on the Roche LightCycler 480 (Nutley, NJ). Data were normalized to RNU6B as described above.
Transwell Migration and Invasion Assay
Cells were seeded into the upper chamber of a Transwell insert pre-coated with 5μg/mL fibronectin for migration or a BD Matrigel invasion chamber for invasion in serum-free medium at a density of 50,000 cells per well (24-well insert; 8μm pore size, BD Biosciences, San Jose, CA). A medium containing 10% fetal bovine serum (FBS) was placed in the lower chamber to act as a chemoattractant, and cells were further incubated for the indicated time points. Non-migratory cells were removed from the upper chamber. The migratory cells remaining on the lower surface of the insert were stained using Diff-Quick dye (Dade Behring, Inc, Newark, DE). Cells were quantified as the average number of cells found in five random microscope fields in three independent inserts.
Morphologic and Immunofluorescence Analysis
Cells were seeded and grown as monolayers onto sterile, confocal glass coverslip culture dishes (35mm; MatTek Corp., Ashland, MA), coated with 5μg/mL fibronectin, and allowed to attach overnight. Cells then were fixed for 10 min with 3.7% formaldehyde, washed three times with 1× phosphate-buffered saline (PBS), permeabilized with 0.1% Triton X-100, and blocked in 2% bovine serum albumin (BSA) in 1× PBS for 1h at room temperature. E-Cadherin primary antibody was incubated overnight at 4°C at a 1:100 dilution in 1× PBS containing 2% BSA. Overnight incubation was followed by 3 ×10 min washes in 1× PBS, followed by incubation in corresponding Alexa Fluor 488 secondary antibody for 2h in the dark at room temperature. DRAQ5 was used for nuclear counterstaining. Slides were examined under a confocal laser-scanning microscope (Zeiss LSM 510 META) with a Plan Apo Chromat ×63 oil objective lens (N.A. 1.4), and images were captured using LSM 510 META software version 3.2.
Cytotoxicity/SRB Assay
Cells (3 ×10³) were seeded in 96-well plates and treated as described below. For cytotoxicity studies, cells were incubated for 96h with 5FU at concentrations ranging from 5μM to 3000μM or vehicle alone. Following the treatment, cells were fixed at 4°C with 1% trichloroacetic acid (TCA) followed with staining at room temperature for 30 min in 0.4% (w/v) sulforhodamine B (SRB) dissolved in 1% acetic acid. After 4 washes with 1% acetic acid, the protein-bound dye was extracted with 10mM unbuffered Tris base (19). The plates were read at 560 nm. The half maximal inhibitory concentration (IC50) values were calculated by nonlinear regression analysis using GraphPad Prism version 5.0 software (GraphPad Software, Inc., San Diego, CA, USA).
Cell Viability/Trypan Blue Assay
In the experiments assessing the impact of miR-145 on chemotherapy sensitivity, cells (1 × 10⁵) were initially seeded in 12-well plates. After 24h incubation, cells were transfected with miR-145 and scrambled control plasmid DNA, using X-tremeGENE HP DNA transfection reagent (Roche, Basel, Switzerland). At 24h post transfection, cells were incubated with 5FU or vehicle alone. At 72 h post 5FU treatment, cells were trypsinized, stained with trypan blue, and counted using a hemocytometer.
Sphere-forming Assay
The ability to form spheres in 96-well ultra-low-attachment plate was evaluated as described previously (10). The culture medium consisted of Dulbecco's modified Eagle's medium (DMEM)/F12 supplemented with 1× B27 (Life Technologies), 20 ng/mL epidermal growth factor, and 20 ng/mL fibroblast growth factor-basic (Invitrogen) and penicillin–streptomycin. After 7 days of incubation, the total number of spheres greater than 50 μm in diameter was quantified by counting under light microscopy.
Luciferase Promoter Assay
The luciferase reporter plasmid containing the putative 1.4 kb miR-145 promoter in pGL3 basic vector (Promega, Madison, WI, USA) was generously provided by Dr. Yin-Yuan Mo (University of Mississippi) (20). Luciferase assays were carried out in DLD/SNAI2, HCT/SNAI2, and empty vector stably transfected cells. Cells were transfected with miR-145 promoter and Renilla luciferase plasmids in 12-well plates. The cells were lysed for luciferase assay 48 h after transfection. Luciferase assays were performed using dual luciferase assay kit (Promega) according to the manufacturer's protocol.
Patients
We identified 15 patients with T3-T4 and/or N1 primary rectal cancers treated with neo-adjuvant chemoradiation therapy from the Hollings Cancer Center (HCC) tumor registry after obtaining institutional IRB approval. From the medical records, we obtained patient demographics, staging procedures, and treatment strategies. Treatment response was evaluated and graded by pathology as standard procedure. Tumor regression grading was used to quantitate response to therapy (21).
Tissue Samples and Pathologic Evaluation
Pretreatment rectal cancer biopsies were obtained from the Hollings Cancer Center biorepository. For optimal tissue sampling, our gastro-intestinal pathologist examined the available paraffin-embedded tumor blocks and evaluated specimens for viable tumor and necrosis. Thick 10μm sections were obtained from the identified tumor sections with the most representative viable tumor. An additional H&E-stained slide was obtained adjacent to the analyzed section and examined by our pathologist to confirm the presence of adequate tumor tissue for analysis. RNA was extracted from the patient tumor samples by Trizol (Invitrogen, Carlsbad, CA). RNA was processed for miR-145 and RNU6B as described above.
Statistical Analysis
Statistical analyses were performed using the Student's t-test for paired data. P<0.05 was considered significant. The patient data were analyzed using Graph Pad Prism Software.
Results
5FU resistant DLD1 colon cancer cell line display EMT related phenotypes and enhanced migration and invasion
The 5FU resistant DLD1 (5FUr DLD1) cells demonstrated a >100-fold increase in 5FU resistance as compared with parental DLD1 cells (Figure 1A). Phase-contrast microscopy revealed a marked altered cellular morphology in the 5FUr DLD1 cells with spindle shape, pseudopodia, and intercellular space/scattering, suggesting the loss of cell-cell adhesions in the 5FUr DLD1 cells as compared with parental DLD1 cells (Figure 1B). These changes were suggestive of an EMT-like phenotype and implied that the resistant cells had transitioned to a mesenchymal state. Based on these observations, we performed chemokinetic migration and invasion assays with Boyden transwell migration chambers using 10% FBS as a chemoattractant. At 10h after plating, the 5FUr DLD1 cells demonstrated significantly greater cellular migration as compared with parental DLD1 cells (Figure 1C, 1.7-fold; p=0.013). Similarly, the 5FUr DLD1 cells also demonstrated increased invasion at 24 (4.2-fold) and 48h (3.4-fold) after plating relative to the parental DLD1 cells (Figure 1D, p<0.001). Over this same time period, there was no difference in cell proliferation between the parental and 5FUr DLD1 cells (data not shown).
Figure 1. 5FU resistant DLD1 colorectal cancer cells have properties consistent with EMT.
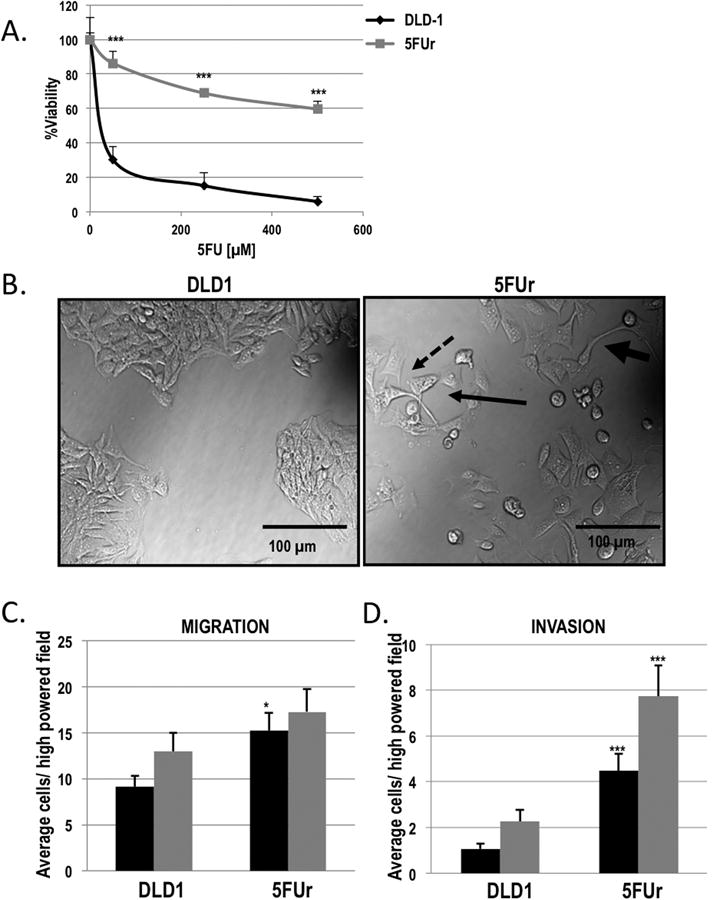
A) 5FU resistant (5FUr DLD1; grey square) and parental DLD1 (black diamond) were treated with increasing concentrations of 5FU for 96 h and cell viability was assessed by SRB staining and reported as percent viability. ***P<0.001 vs DLD1. B) Representative bright-field confocal images of 5FUr DLD1 cells as compared to the parental DLD1 cell line, demonstrating increased spindle shape (fat arrow), pseudopodia (dashed arrow), and intercellular space/scattering (thin arrow) in the 5FUr DLD1 cells. C) Quantification of chemotactic migration of 5FUr DLD1 and parental DLD1 cells. Columns, average number of cells migrating per high-powered field measured after 10 h (black bars) and 24 h (grey bars). *P<0.05 vs DLD1. D) Quantification of chemotactic invasion of 5FUr DLD1 and parental DLD1 cells. Columns, average number of cells invading per high-powered field measured after 24 h (black bars) and 48 h (grey bars), ***P<0.001 vs DLD1.
Altered expression of EMT markers in 5FU resistant DLD1 cells
Decreased E-Cadherin expression and loss of cell surface membrane localized E-Cadherin are fundamental changes observed with EMT (3,4,22). Based on the morphological changes observed in the 5FUr DLD1 cells, we hypothesized that E-Cadherin expression would be reduced in the 5FU resistant cells. Western blot analysis indicated that the 5FUr DLD1 cells expressed reduced E-Cadherin protein relative to parental DLD1 cells (Figure 2A). Immunofluorescence revealed that 5FUr DLD1 cells had both decreased E-Cadherin expression and loss of cell surface membrane bound E-Cadherin as compared to parental DLD1 cells (Figure 2B). The EMT alterations observed in the 5FUr DLD1 colon cancer cells are consistent with prior investigations in pancreatic cancer cells and other colon cancer cells with acquired 5FU chemotherapy resistance, demonstrating loss of an epithelial cell phenotype and a gene expression pattern more consistent with mesenchymal cells (23,24).
Figure 2. 5FU resistant DLD1 colorectal cancer cells have molecular changes consistent with EMT.
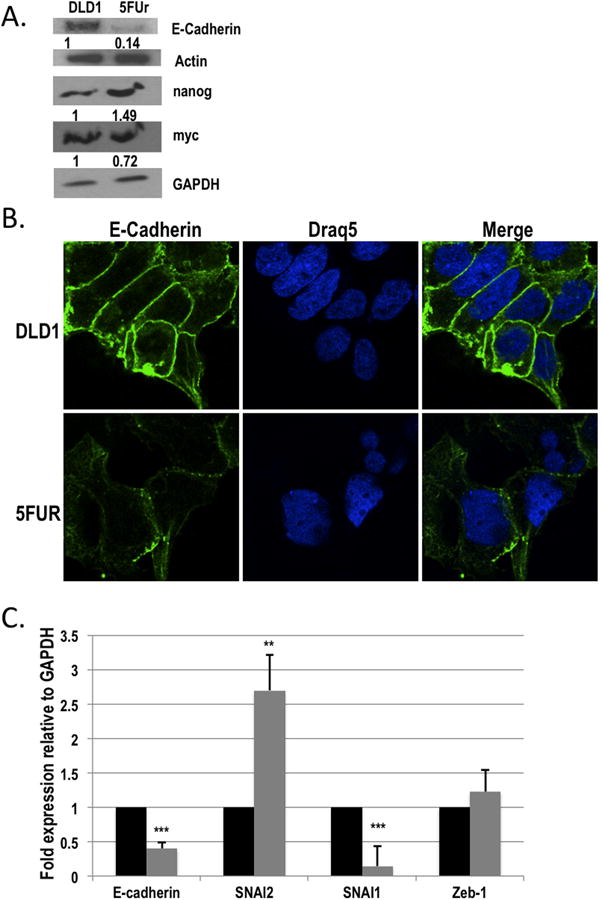
A) Western blot analysis of E-Cadherin, nanog and myc in 5FUr DLD1 as compared with parental DLD1 cells. Actin and GAPDH were used as loading controls. B) Representative images of immunofluorescence staining for E-Cadherin staining at ×100 objective power (left panels). DRAQ5 was used as a nuclear stain (middle panels). The merged images are shown in the right panels. C) Quantitative real time PCR (qPCR) analysis of E-Cadherin, SNAI2, SNAI1 and Zeb-1 mRNA expression in the 5FUr DLD1 cells (grey bars) as compared to parental DLD1 cells (black bars). Expression was normalized to GAPDH. **P<0.01, ***P<0.001 vs DLD1.
Pathways leading to EMT are regulated by a family of transcriptional factors including SNAI1, Zeb1, and SNAI2, which directly inhibit E-Cadherin transcription (3,4). To explore further the molecular mechanism driving the changes in 5FUr DLD1 cells, we investigated the expression of E-Cadherin, SNAI1, SNAI2, and Zeb1 by qPCR (Figure 2C). Confirming the reduced E-cadherin protein expression demonstrated in the 5FUr DLD1 cells, E-Cadherin mRNA was significantly reduced by ∼60% in 5FUr DLD1 cells as compared with the parental cells (Figure 2C). Zeb1 expression was not significantly different from the parental cells, and SNAI1 expression was reduced (p<0.001). However, the 5FUr DLD1 cells demonstrated a 2.7-fold increase in SNAI2 expression relative to the parental cells (p<0.01), suggesting a possible molecular mechanism contributing to the observed changes in E-Cadherin expression in 5FU resistant cells.
5FU sensitivity correlates with expression of EMT markers and miR-145
To determine whether the EMT status of CRC cell lines is related to the response to 5FU treatment, we performed western blot analysis for E-Cadherin, Vimentin, and Snai2 in a panel of CRC cell lines (Figure 3A). We observed reduced levels of E-Cadherin protein and an increase in both Vimentin and Snai2 protein (and RNA) expression in the SW620 cell line as compared to the other CRC cell lines (Figure 3A and B) (25). The increased levels of Snai2 and Vimentin combined with the decrease in E-Cadherin in the SW620 cell line correlated with increased resistance to 5FU treatment as compared to the other cell lines tested (Figure 3C), suggesting that EMT features are associated with resistance to 5FU chemotherapy in CRC cells.
Figure 3. Colorectal cancer cell lines exhibiting EMT markers are resistant to 5FU.
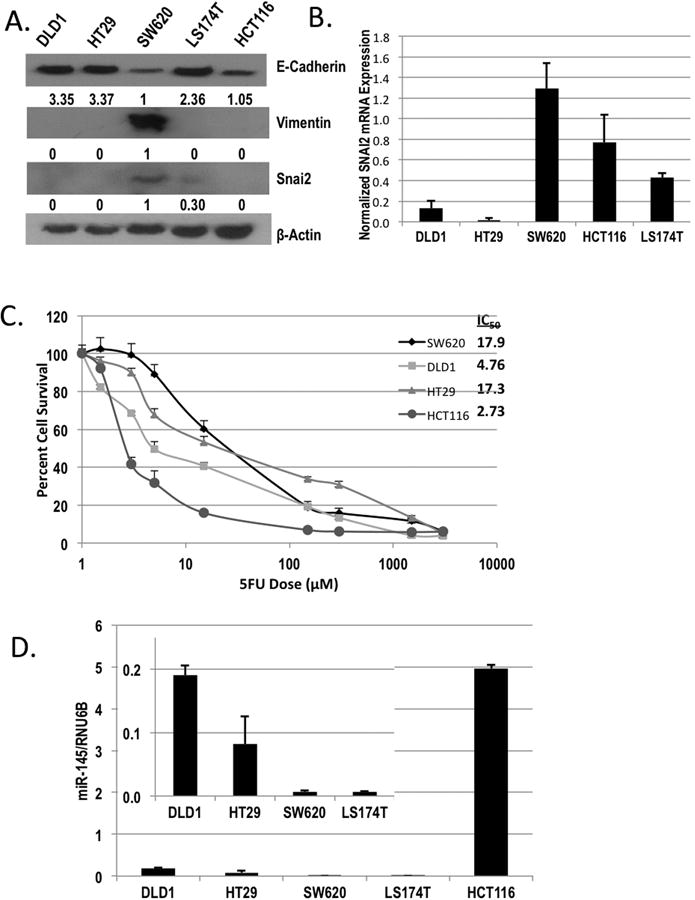
(A) Western blot analysis of E-Cadherin, Vimentin, and Snai2 expression in DLD1, HT29, SW620, LS174T, and HCT116 colorectal cancer cell lines. Actin was used as a loading control. B) qPCR analysis of SNAI2 in DLD1, HT29, SW620, LS174T, and HCT116 cells normalized to GAPDH. C) HCT116 (grey circle), SW620 (dark grey diamond), HT29 (grey triangles), and DLD1 (light grey squares) were treated with increasing concentrations of 5FU for 96 h, and cell viability was assessed by SRB staining and reported as percent cell survival. Respective IC50 values are reported in the upper right panel. D) qPCR analysis of miR-145 in DLD1, HT29, SW620, LS174T, and HCT116 cells normalized to RNU6B.
miRNAs have been shown to play a pivotal role in CRC, and miR-145 has been previously linked with 5FU sensitivity and inversely correlated with EMT (8,9,11). Therefore, we measured levels of miR-145 expression in our panel of CRC cell lines to assess the relationship between SNAI2, miR-145 and 5FU chemosensitivity. We observed that miR-145 levels were significantly reduced in the SW620 (5FU resistant) cells that demonstrated high SNAI2 expression as compared to DLD1 and HCT116 cell lines (Figure 3D), suggesting miR-145 as a mediator of 5FU sensitivity in these cells. The HCT116 cell line was the most 5FU sensitive cell line assessed and expressed the highest level of miR-145, further supporting the correlation of miR-145 expression and 5FU sensitivity.
SNAI2 impairs response to 5FU chemotherapy and induces tumor-initiating cell properties
Based on the association of EMT with 5FU resistance and our observation of increased SNAI2 expression in the 5FUr DLD1 cells, we investigated SNAI2 as a direct mediator of CRC chemotherapy (5FU) sensitivity. Previously, our research group established that the SNAI2 overexpressing DLD1 (DLD1/SNAI2) cells demonstrated molecular changes and phenotype consistent with enhanced EMT (18). In addition, we established a SNAI2 overexpressing HCT116 (HCT/SNAI2) cell line to similarly assess 5FU sensitivity. To confirm SNAI2 over-expression, we demonstrated that SNAI2 expression was increased at the protein (Figure 4A and B) in both SNAI2 over-expressing cell lines. In addition, we demonstrated that E-Cadherin protein expression is reduced in the ectopic SNAI2 expressing cells as compared with the empty vector control cells (Figure 4A and B). We assessed 5FU chemotherapy sensitivity using the SRB cytotoxicity assay after 96h of 5FU treatment. The estimated IC50 for the empty DLD1 cells was 4.3μM as compared with 339.7μM for the DLD1/SNAI2 cells (Figure 4C), providing further support for the notion that increased expression of SNAI2 contributes to 5FU resistance in CRC cells. Similarly, the HCT/SNAI2 cells demonstrated resistance to 5FU cytotoxicity (Figure 4D).
Figure 4. SNAI2 impairs response to 5FU chemotherapy and induces tumor-initiating cell properties.
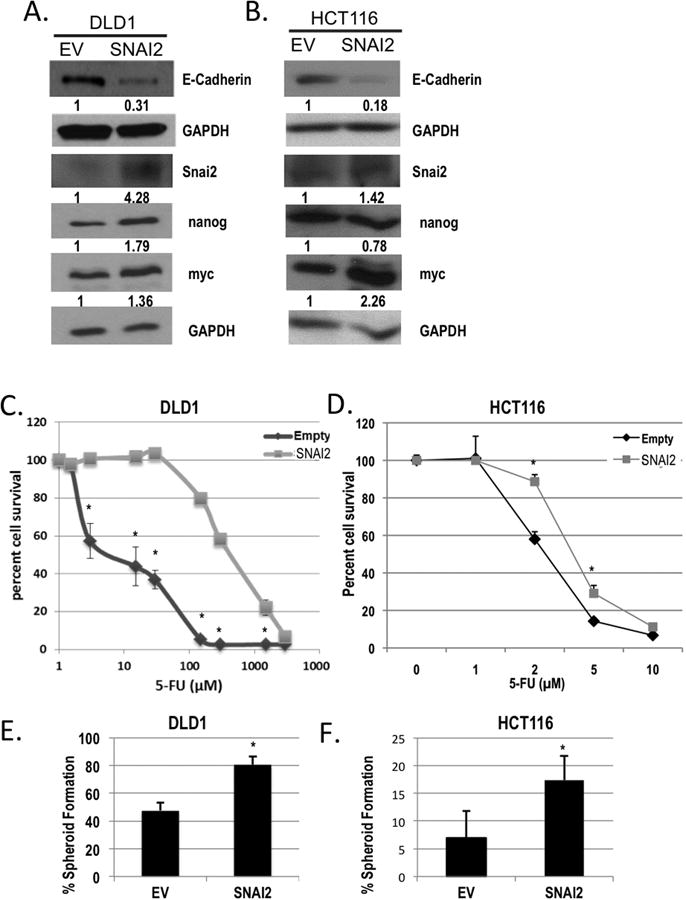
Western blot analysis of E-Cadherin, Snai2, nanog, and myc in A) DLD1/SNAI2, and B) HCT116/SNAI2 as compared with empty vector (EV) control cells. GAPDH was used as a loading control. C and D) 5FU chemosensitivity was assessed using the SRB cytotoxicity assay after 96 h of 5FU treatment in the ectopic expressing SNAI2 (SNAI2; light grey squares) as compared with empty vector (Empty; dark grey diamonds) colorectal cancer cell lines. *P<0.05 vs respective empty controls. E and F) Limited dilution spheroid formation was assessed in the DLD1 and HCT116 SNAI2 expressing and empty vector (EV) cells *P<0.05.
Recent investigations have highlighted an association between EMT alterations and induced cancer stem cell-like (CSC) properties (10,13). Furthermore, reports have demonstrated that this CSC-like cell population, also termed tumor initiating cells, is resistant to therapy (15,16,26). We investigated the ability of SNAI2 to increase CSC-like properties as a potential mechanism contributing to chemotherapy resistance. Prior studies have demonstrated the ability of tumor initiating cells to establish clonal spheroid formation in low adherence conditions without serum (27). Compared with empty vector control cells, DLD/SNAI2 and HCT116/SNAI2 cells increased spheroid formation, suggesting that SNAI2 enhances the tumor initiating cell population (17.4±4.3% vs. 6.9±4.8% in HCT116/SNAI2 vs. EV, P<0.05; 80.5±6.2% vs. 47.5±5.7% in DLD1/SNAI2 vs. EV, P<0.05; Figure 4E and F).
SNAI2 represses miR-145 promoter activity and miR-145 expression in CRC cells
Based on the inverse correlation between the expression of miR-145 and SNAI2 in the parental CRC panel of cell lines and the previous reports demonstrating an association between miR-145 expression and 5FU sensitivity (Figure 3A and D) (11), we decided to investigate SNAI2 mediated negative regulation of miR-145 as a potential mechanism associated with 5FU resistance. Expression of SNAI2 mRNA was confirmed in the two SNAI2 over-expressing cell lines (Figure 5A and B). The DLD1/SNAI2 cell demonstrated a significant decrease (64%) in miR-145 expression when compared with the empty vector control cells (Figure 5C). Similarly, miR-145 expression was reduced in the HCT/SNAI2 cell pools (HCT/SNAI2(1) and HCT/SNAI2(2)) by 72 and 55%, respectively, when compared with the empty vector control cells (Figure 5D). In the HCT116/SNAI2 cell pools, the relative reduction in miR-145 expression correlated with degree of ectopic SNAI2 expression in the two HCT/SNAI2 cell pools that were assessed, supporting evidence of a molecular repression of miR-145 by SNAI2 (Figure 5B and D). All other experiments involving the HCT/SNAI2 cells were performed only with the highest SNAI2 expressing cell pool (HCT/SNAI2(1)).
Figure 5. SNAI2 represses miR-145 promoter activity and miR-145 expression in CRC cells.
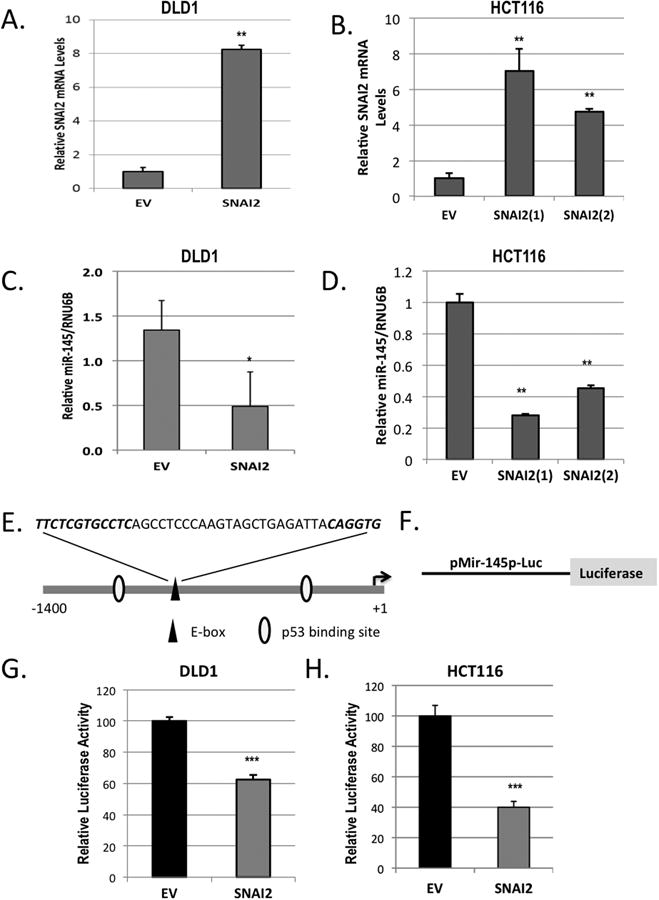
A and B) qPCR analysis of SNAI2 expression in the ectopic expressing SNAI2 and empty vector (EV) DLD1 (A) and HCT116 (B) cell lines normalized to GAPDH. C and D) qPCR analysis of miR-145 expression in the ectopic expressing SNAI2 and empty vector (EV) DLD1 (C) and HCT116 (D) cell lines normalized to RNU6B. E) Schematic representation of the potential transcription factor binding sites within the putative miR-145 promoter and pre-miR-145 start site (arrow). F) Schematic representation of pMir-145p-Luc reporter plasmid containing 1.4 kb putative miR-145 promoter. G and H) Luciferase activity of DLD1 and HCT116 cells ectopically expressing SNAI2 or the empty vector (EV) control transiently transfected with the pMir-145p-Luc reporter construct and Renilla vector. Firefly luciferase is normalized to Renilla. **P<0.01, ***P<0.001 vs respective EV controls. *, P<0.05
In the miR-145 promoter region, we identified the SNAI2 consensus binding site core sequence CA(C/G)(C/G)TG with the upstream CT rich region (Figure 5E)(3,4). To determine whether SNAI2 represses the miR-145 promoter, we transfected the ectopic SNAI2 expressing CRC cell lines with the luciferase reporter plasmid containing the putative miR-145 promoter (Figure 5F)(28). In both the DLD/SNAI2 and HCT/SNAI2 cell lines, miR-145 promoter activity was suppressed (by 38 and 60% respectively) when compared with empty vector transfected controls (Figure 5G and H).
Prior reports have demonstrated that miR-145 directly targets critical stem cell transcription factors (29-31). We decided to further explore the inverse relationship between SNAI2 and miR-145 by investigating the expression of established miR-145 target stem cell transcription factors including nanog, myc, Klf4, Sox2 and Oct4 (29-31). Initially, we examined expression in the CRC cell panel and observed that of the factors examined, nanog and myc seemed to be more highly expressed in the aggressive SW620 (high SNAI2 expression) cell line when compared to the other cell lines (Supplemental Figure 1). We also observed an increase in nanog in the 5FUr DLD1 when compared to the parental DLD1 cells (Figure 2C) and in the DLD1/SNAI2 cells when compared to the empty vector controls (Figure 4A). In the HCT116/SNAI2 cells, myc was significantly increased as compared to control cells (Figure 4B). The findings of both increased spheroid formation and expression of CSC transcription factors in the ectopic SNAI2 expressing cell lines supports the correlation between SNAI2 expression and increased tumor initiating population.
Inhibition of SNAI2 restores miR-145 expression and sensitivity to 5FU
We assessed the impact of SNAI2 silencing on miR-145 expression and 5FU sensitivity using short hairpin directed towards SNAI2 (shSNAI2) in the SW620 cell line (Figure 6A). As opposed to the ectopic expression of SNAI2, SNAI2 inhibition resulted in a ∼1.5 fold increased miR-145 expression (Figure 6B). In addition, we observed by western blot that the inhibition of SNAI2 decreased Vimentin (Figure 6C). As opposed to the increase in CSC transcription factors observed with ectopic SNAI2 expression, SW620 cells transfected with shSNAI2 demonstrated decreased expression of nanog and myc (Figure 6C). Along with the observed molecular changes with shSNAI2, we demonstrated an increased sensitivity to 5FU in the SW620 cells with inhibition of SNAI2, when compared to the scrambled control (Figure 6D).
Figure 6. SNAI2 inhibition restores sensitivity to 5FU and augments CSC transcription factor expression.
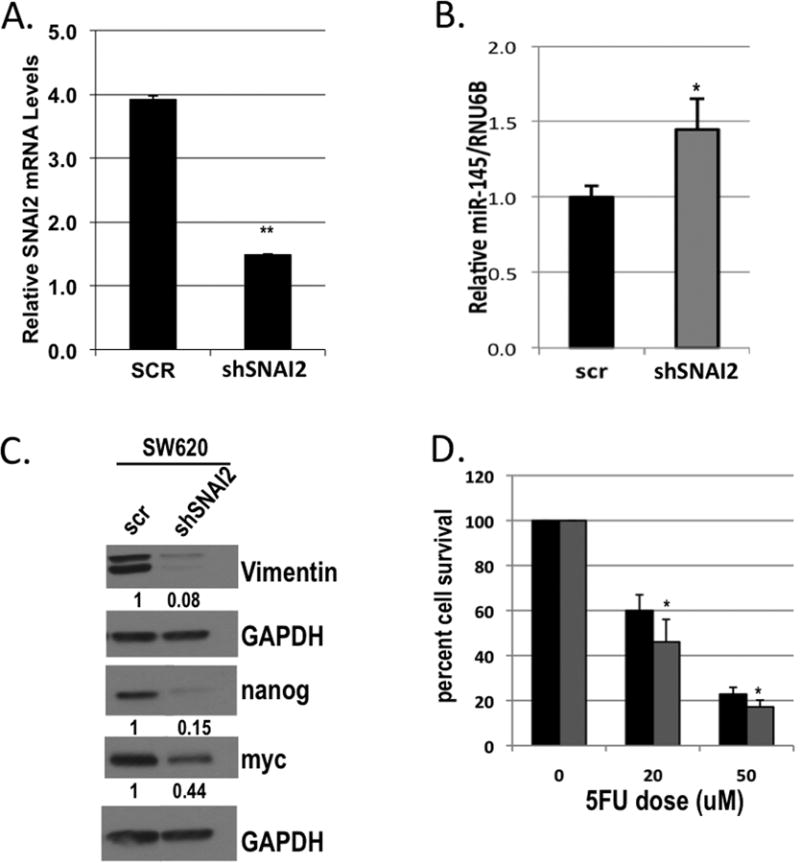
A) qPCR analysis of SNAI2 in SW620 cells stably infected with short hairpin to SNAI2 (shSNAI2) or scrambled (scr) control lentivirus normalized to GAPDH. B) qPCR analysis of miR-145 expression in SW620 cells infected with short hairpin to SNAI2 (shSNAI2) or scrambled (scr) control lentivirus normalized to RNU6B. C) Western blot analysis of Vimentin, nanog, and myc in SW620 cells stably infected with short hairpin to SNAI2 (shSNAI2) or scrambled (scr) control lentivirus. GAPDH was used as a loading control. D) Cytotoxicity assay of SW620 cells stably infected with short hairpin to SNAI2 (grey bars) or scrambled control (black bars) lentivirus, either untreated (0) or treated with 20 or 50μM 5FU. *P<0.05, **P<0.01 vs respective scr controls.
miR-145 expression restores sensitivity to 5FU and augments CSC transcription factor expression
miRNAs are currently very attractive as novel therapeutics and are being actively pursued in clinical development; therefore, we sought to determine whether miR-145 could reverse the effects of SNAI2 expression. To assess whether the SNAI2:miR-145 axis is functional in our cell model and to determine whether expression of miR-145 can diminish the SNAI2-mediated resistance to 5FU chemotherapy, we transiently overexpressed miR-145 in our DLD1/SNAI2 cells using a miR-145 expression plasmid (Figure 7A). In a cell viability assay, we observed an increased sensitivity to 5FU in the DLD1/SNAI2 cells transfected with miR-145, as compared with scrambled control DLD1/SNAI2 cells treated with 5FU (Figure 7B). Compared with the scrambled control transfected DLD1/SNAI2 cells, miR-145 transfection enhanced 5FU cytotoxicity as demonstrated by an additional 26.4% reduction in cell viability. In addition, we observed that transfection of miR-145 alone, in the absence of 5FU treatment, resulted in significantly decreased DLD/SNAI2 cell survival (Figure 7B). This is similar to that observed by other groups who showed that miR-145 reduced cellular proliferation and tumor growth (32).
Figure 7. miR-145 expression restores sensitivity to 5FU and augments CSC transcription factor expression.
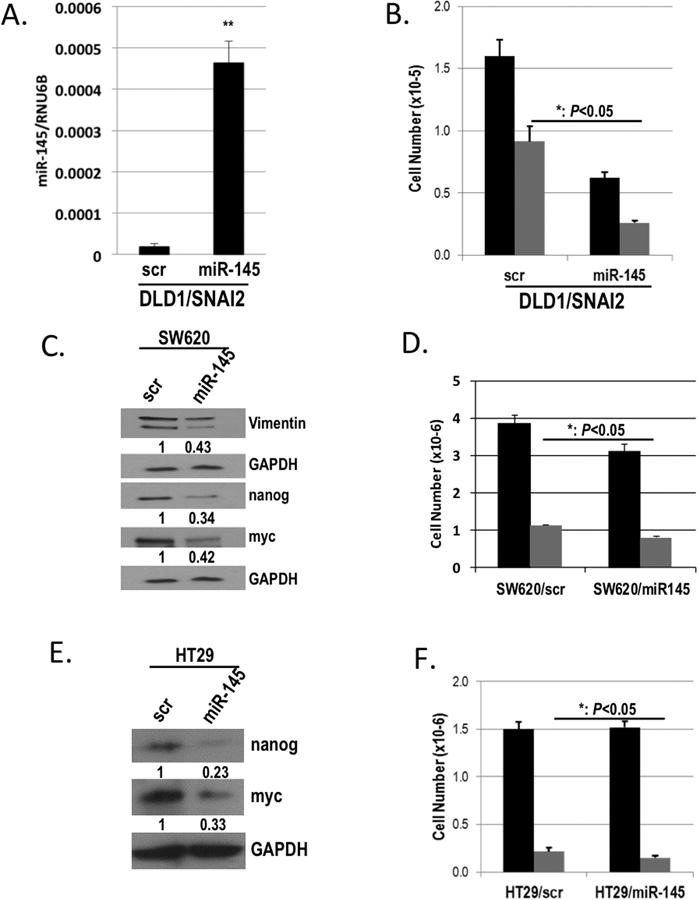
A) qPCR analysis of miR-145 expression in DLD1/SNAI2 cells transiently transfected with miR-145 or scrambled (scr) control plasmid normalized to RNU6B. B) Cytotoxicity assay of DLD1/SNAI2 cells transiently transfected with miR-145 or scrambled (scr) control plasmid, either untreated (black bars) or treated with 50μM 5FU (grey bars). C & E) Western blot analysis of Vimentin, nanog, and myc in SW620 (C) and of nanog and myc in the HT29 (E) cells transiently transfected with miR-145 or scrambled (scr) control. GAPDH was used as a loading control. D & F) Cell viability assay of SW620 (D) and HT29 (F) cells transiently transfected with miR-145 or scrambled (scr) control, either untreated (black bars) or treated with 50μM 5FU (grey bars). *P<0.05, **P<0.01, **P<0.01 vs respective scr controls.
In the 5FU resistant parental SW620 cells with high SNAI2 expression, transient transfection of miR-145 (Supplemental Figure 2A) resulted in a decrease in Vimentin protein and SNAI2 mRNA expression (Figure 7C and Supplemental Figure 2B). Furthermore, similar to SNAI2 inhibition, miR-145 down-regulated expression of the stem cell transcription factors including nanog and myc in the SW620 cells (Figure 7C and Supplemental Figure 2B). Importantly, the expression of miR-145 in SW620 resulted in an increase in sensitivity to 5FU when compared to scrambled control cells (Figure 7D), similar to the effect observed in the miR-145 transfected DLD/SNAI2 cells (Figure 7B).
Given the relative 5FU resistance observed in the HT29 cells, we elected to assess the impact of miR-145 restoration in this cell line (Supplemental Figure 2C). Similar to the molecular changes observed in the SW620 cells, miR-145 restoration resulted in a ∼75 and ∼65% reduction in nanog and myc respectively (Figure 7E). miR-145 restoration also increased HT29 5FU sensitivity as demonstrated by an additional 32% reduction in cell viability. (Figure 7F). These findings suggest a similar molecular and functional downstream effect of miR-145 restoration even in the absence of SNAI2 expression.
miR-145 expression predicts response to chemoradiation in human CRC tumor samples
Stage 2 and 3 rectal cancer patients are routinely treated with neoadjuvant 5FU based chemoradiation to downstage tumors prior to surgery. Tumor regression grading as an assessment of treatment response is an effective surrogate marker of long-term survival and recently was demonstrated as an effective benchmark for oncologic outcomes in this subset of patients (2,21,33). To assess whether miR-145 would serve as a biomarker of response in these patients, we extracted RNA from 15 pre-treatment rectal cancer biopsy specimens. Using pathologic tumor regression grade, we compared tumors demonstrating greater than 50% response (Grades 3 and 4) with tumors demonstrating less than 50% response (Grades 1 and 2). We observed significantly higher levels of miR-145 in patients who responded well to treatment, as compared to patients who demonstrated a poor response to therapy (Figure 8A). Together, these data support the existence of a SNAI2:miR-145 axis as a mechanism of therapeutic response in colorectal cancer patients (Figure 8B) and provide a strong rationale for the development of a miR-145 targeted therapeutic.
Figure 8. miR-145 expression predicts response to chemoradiation in human CRC tumor samples.
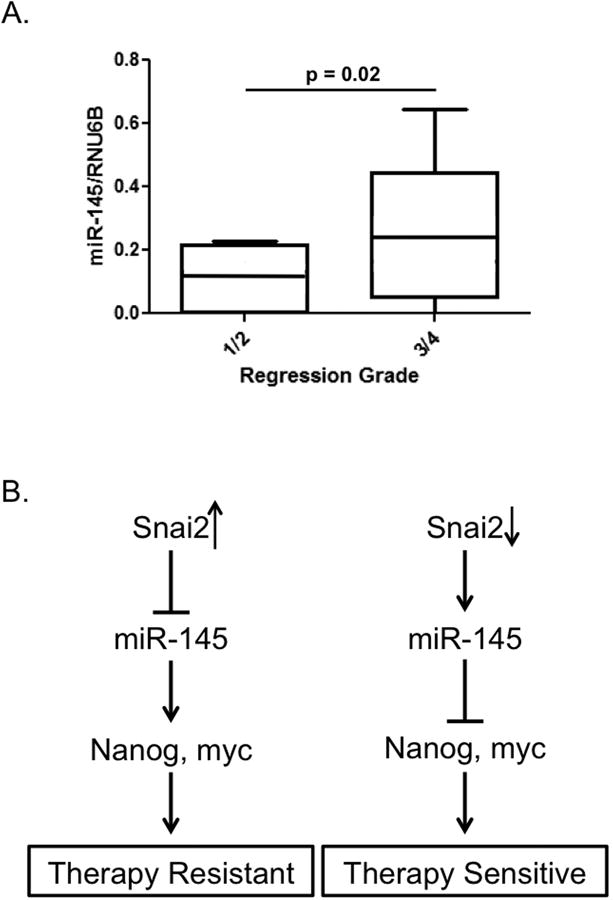
A) qPCR analysis of pre-treatment tumor sample miR-145 expression based on pathologic tumor regression grading in 15 Stage 2 and 3 rectal cancer patients who received neoadjuvant 5FU based chemoradiation. B) Model of proposed mechanism of SNAI2 mediated 5FU therapy resistance/sensitivity in colorectal cancer cells/patients.
Discussion
Growing evidence has linked EMT with cancer stem-cell properties, enhanced cancer cell survival, and resistance to conventional anti-neoplastic therapies (6,10,13,15). Although elevated expression of E-Cadherin transcriptional mediators has been linked with chemotherapy resistance in CRC, only recently have EMT pathways been characterized as mediators of colon cancer chemotherapy resistance (10,34). EMT pathways make attractive therapeutic molecular targets that have the potential to enhance current anti-neoplastic strategies and potentially target the tumor initiating cells. However, the clinical effectiveness of targeting EMT pathways and transcription factors remains challenging. Defining the molecular mediators driving the therapeutic resistance associated with expression of EMT and CSC transcription factors may identify novel therapeutic targets.
Prior reports have demonstrated an inverse relationship between miR-145 expression and EMT (8,9,29,35), and in this report, we demonstrate a novel SNAI2:miR-145 axis that mediates cancer cell survival associated with 5FU chemotherapy response in CRC cancer. Previously miR-145 has not been described as a direct target of SNAI2. Our group demonstrated that SNAI2 repressed miR-145 promoter activity and, thereby, inhibited miR-145 expression. Ectopic expression of SNAI2 also significantly enhanced resistance to 5FU. Conversely, SNAI2 inhibition or miR-145 replacement rescued sensitivity to 5FU in SNAI2 expressing cancer cells. We further demonstrated that miR-145 expression is associated with neoadjuvant 5FU based chemoradiation response in rectal cancer patients, highlighting the clinical relevance of our findings. Collectively, our data highlight the potential of miR145 replacement as a novel molecular-targeted strategy to enhance current CRC therapy.
Associated with the impact on therapeutic response, the SNAI2:miR-145 axis also influenced tumor initiating cell properties and expression of critical stemness transcription factors, including nanog and myc. Nanog has proven to be central in maintaining both embryonic and cancer stem cell abilities, suggesting that nanog may serve as a key gatekeeper to maintaining pluripotency (36-40). Recently, investigators have reported a strong association with EMT-associated gene expression and cancer stem cells (12,13,41). Interestingly, as opposed to SNAI2, which inhibited miR-145 and upregulated nanog and myc, miR-145 replacement suppressed expression of both nanog and myc. The ability of the SNAI2:miR-145 axis to augment expression of stemness factors highlights a possible novel mechanism of action for SNAI2 and a further therapeutic rationale for miR-145 replacement therapy. Future studies will address the impact of the SNAI2:miR-145 axis on CSCs and the functional properties associated with them.
The clinical implications of our findings suggest that our treatments may result in the development of more aggressive cancer cells, perhaps even generating cancer stem cells as suggested by the development of EMT and the expression of nanog in the chronically treated 5FU CRC cells. In a recent report supporting the association between cancer stem cells and resistance to therapy, a chemoresistant population of CRC cells expressed cancer stem cell markers and phenotype (42). As well, the presence of cancer stem cells in human tumor specimens has correlated with a poor prognosis across many organ systems (12,43,44). The close relationship between expression of EMT-associated genes, repression of the tumor suppressor miR-145, and cancer stem cells may further fuel the motivation to develop EMT molecular targets.
Conclusions
In summary, the dynamic process of EMT serves to enhance tumor progression by increasing cellular mobility and invasion and improving cellular survival. SNAI2 mediated pathways may represent a novel clinical therapeutic target in CRC, as well as serve as a molecular predictor of response to chemoradiation therapy in CRC. In the future, identifying tumors with elevated EMT markers also may help dictate appropriate therapy. This is particularly applicable to neoadjuvant therapy for advanced rectal cancer patients where individualized treatment strategies based on molecular markers may enhance current practices and outcomes.
Supplementary Material
Acknowledgments
Supported by: National Institutes of Health, 5R 1K08CA142904 (E.R. Camp), Hollings Cancer Center Translational Research Award (E.R. Camp) and American Cancer Society: Institutional Research Grant (E.R. Camp)
Footnotes
Conflict of Interest statement: no conflicts to disclose
References
- 1.Sauer R, Becker H, Hohenberger W, Rodel C, Wittekind C, Fietkau R, et al. Preoperative versus postoperative chemoradiotherapy for rectal cancer. N Engl J Med. 2004;351(17):1731–40. doi: 10.1056/NEJMoa040694. [DOI] [PubMed] [Google Scholar]
- 2.Park IJ, You YN, Agarwal A, Skibber JM, Rodriguez-Bigas MA, Eng C, et al. Neoadjuvant treatment response as an early response indicator for patients with rectal cancer. J Clin Oncol. 2012;30(15):1770–6. doi: 10.1200/JCO.2011.39.7901. [DOI] [PMC free article] [PubMed] [Google Scholar]
- 3.Batlle E, Sancho E, Franci C, Dominguez D, Monfar M, Baulida J, et al. The transcription factor snail is a repressor of E-cadherin gene expression in epithelial tumour cells. Nat Cell Biol. 2000;2(2):84–9. doi: 10.1038/35000034. [DOI] [PubMed] [Google Scholar]
- 4.Cano A, Perez-Moreno MA, Rodrigo I, Locascio A, Blanco MJ, del Barrio MG, et al. The transcription factor snail controls epithelial-mesenchymal transitions by repressing E-cadherin expression. Nat Cell Biol. 2000;2(2):76–83. doi: 10.1038/35000025. [DOI] [PubMed] [Google Scholar]
- 5.Thiery JP. Epithelial-mesenchymal transitions in tumour progression. Nat Rev Cancer. 2002;2(6):442–54. doi: 10.1038/nrc822. [DOI] [PubMed] [Google Scholar]
- 6.Vega S, Morales AV, Ocana OH, Valdes F, Fabregat I, Nieto MA. Snail blocks the cell cycle and confers resistance to cell death. Genes Dev. 2004;18(10):1131–43. doi: 10.1101/gad.294104. [DOI] [PMC free article] [PubMed] [Google Scholar]
- 7.Kajita M, McClinic KN, Wade PA. Aberrant expression of the transcription factors snail and slug alters the response to genotoxic stress. Mol Cell Biol. 2004;24(17):7559–66. doi: 10.1128/MCB.24.17.7559-7566.2004. [DOI] [PMC free article] [PubMed] [Google Scholar]
- 8.Hu J, Guo H, Li H, Liu Y, Liu J, Chen L, et al. MiR-145 regulates epithelial to mesenchymal transition of breast cancer cells by targeting Oct4. PLoS One. 2012;7(9):e45965. doi: 10.1371/journal.pone.0045965. [DOI] [PMC free article] [PubMed] [Google Scholar] [Retracted]
- 9.Gotte M, Mohr C, Koo CY, Stock C, Vaske AK, Viola M, et al. miR-145-dependent targeting of junctional adhesion molecule A and modulation of fascin expression are associated with reduced breast cancer cell motility and invasiveness. Oncogene. 2010;29(50):6569–80. doi: 10.1038/onc.2010.386. [DOI] [PubMed] [Google Scholar]
- 10.Fan F, Samuel S, Evans KW, Lu J, Xia L, Zhou Y, et al. Overexpression of snail induces epithelial-mesenchymal transition and a cancer stem cell-like phenotype in human colorectal cancer cells. Cancer Med. 2012;1(1):5–16. doi: 10.1002/cam4.4. [DOI] [PMC free article] [PubMed] [Google Scholar]
- 11.Takagi T, Iio A, Nakagawa Y, Naoe T, Tanigawa N, Akao Y. Decreased expression of microRNA-143 and -145 in human gastric cancers. Oncology. 2009;77(1):12–21. doi: 10.1159/000218166. [DOI] [PubMed] [Google Scholar]
- 12.Polyak K, Weinberg RA. Transitions between epithelial and mesenchymal states: acquisition of malignant and stem cell traits. Nat Rev Cancer. 2009;9(4):265–73. doi: 10.1038/nrc2620. [DOI] [PubMed] [Google Scholar]
- 13.Mani SA, Guo W, Liao MJ, Eaton EN, Ayyanan A, Zhou AY, et al. The epithelial-mesenchymal transition generates cells with properties of stem cells. Cell. 2008;133(4):704–15. doi: 10.1016/j.cell.2008.03.027. [DOI] [PMC free article] [PubMed] [Google Scholar]
- 14.Puglisi MA, Sgambato A, Saulnier N, Rafanelli F, Barba M, Boninsegna A, et al. Isolation and characterization of CD133+ cell population within human primary and metastatic colon cancer. Eur Rev Med Pharmacol Sci. 2009;13(Suppl 1):55–62. [PubMed] [Google Scholar]
- 15.Dallas NA, Xia L, Fan F, Gray MJ, Gaur P, van Buren G, 2nd, et al. Chemoresistant colorectal cancer cells, the cancer stem cell phenotype, and increased sensitivity to insulin-like growth factor-I receptor inhibition. Cancer Res. 2009;69(5):1951–7. doi: 10.1158/0008-5472.CAN-08-2023. [DOI] [PMC free article] [PubMed] [Google Scholar]
- 16.Li X, Lewis MT, Huang J, Gutierrez C, Osborne CK, Wu MF, et al. Intrinsic resistance of tumorigenic breast cancer cells to chemotherapy. J Natl Cancer Inst. 2008;100(9):672–9. doi: 10.1093/jnci/djn123. [DOI] [PubMed] [Google Scholar]
- 17.Zhu H, Guo W, Zhang L, Davis JJ, Teraishi F, Wu S, et al. Bcl-XL small interfering RNA suppresses the proliferation of 5-fluorouracil-resistant human colon cancer cells. Mol Cancer Ther. 2005;4(3):451–6. doi: 10.1158/1535-7163.MCT-04-0162. [DOI] [PubMed] [Google Scholar]
- 18.Camp ER, Findlay VJ, Vaena SG, Walsh J, Lewin DN, Turner DP, et al. Slug Expression Enhances Tumor Formation in a Noninvasive Rectal Cancer Model. J Surg Res. 2011 doi: 10.1016/j.jss.2011.02.012. [DOI] [PMC free article] [PubMed] [Google Scholar]
- 19.Skehan P, Storeng R, Scudiero D, Monks A, McMahon J, Vistica D, et al. New colorimetric cytotoxicity assay for anticancer-drug screening. J Natl Cancer Inst. 1990;82(13):1107–12. doi: 10.1093/jnci/82.13.1107. [DOI] [PubMed] [Google Scholar]
- 20.Sachdeva M, Liu Q, Cao J, Lu Z, Mo YY. Negative regulation of miR-145 by C/EBP-beta through the Akt pathway in cancer cells. Nucleic Acids Res. 2012;40(14):6683–92. doi: 10.1093/nar/gks324. [DOI] [PMC free article] [PubMed] [Google Scholar]
- 21.Rodel C, Martus P, Papadoupolos T, Fuzesi L, Klimpfinger M, Fietkau R, et al. Prognostic significance of tumor regression after preoperative chemoradiotherapy for rectal cancer. J Clin Oncol. 2005;23(34):8688–96. doi: 10.1200/JCO.2005.02.1329. [DOI] [PubMed] [Google Scholar]
- 22.Frixen UH, Behrens J, Sachs M, Eberle G, Voss B, Warda A, et al. E-cadherin-mediated cell-cell adhesion prevents invasiveness of human carcinoma cells. J Cell Biol. 1991;113(1):173–85. doi: 10.1083/jcb.113.1.173. [DOI] [PMC free article] [PubMed] [Google Scholar]
- 23.Arumugam T, Ramachandran V, Fournier KF, Wang H, Marquis L, Abbruzzese JL, et al. Epithelial to mesenchymal transition contributes to drug resistance in pancreatic cancer. Cancer Res. 2009;69(14):5820–8. doi: 10.1158/0008-5472.CAN-08-2819. [DOI] [PMC free article] [PubMed] [Google Scholar]
- 24.Tentes IK, Schmidt WM, Krupitza G, Steger GG, Mikulits W, Kortsaris A, et al. Long-term persistence of acquired resistance to 5-fluorouracil in the colon cancer cell line SW620. Exp Cell Res. 2010;316(19):3172–81. doi: 10.1016/j.yexcr.2010.09.003. [DOI] [PubMed] [Google Scholar]
- 25.Findlay VJ, Moretz RE, Wang C, Vaena SG, Bandurraga SG, Ashenafi M, et al. Slug expression inhibits calcitriol-mediated sensitivity to radiation in colorectal cancer. Mol Carcinog. 2013 doi: 10.1002/mc.22054. [DOI] [PMC free article] [PubMed] [Google Scholar]
- 26.Polyak K, Weinberg RA. Transitions between epithelial and mesenchymal states: acquisition of malignant and stem cell traits. Nat Rev Cancer. 2009;9(4):265–73. doi: 10.1038/nrc2620. [DOI] [PubMed] [Google Scholar]
- 27.Kanwar SS, Yu Y, Nautiyal J, Patel BB, Majumdar AP. The Wnt/beta-catenin pathway regulates growth and maintenance of colonospheres. Mol Cancer. 2010;9:212. doi: 10.1186/1476-4598-9-212. [DOI] [PMC free article] [PubMed] [Google Scholar]
- 28.Sachdeva M, Zhu S, Wu F, Wu H, Walia V, Kumar S, et al. p53 represses c-Myc through induction of the tumor suppressor miR-145. Proc Natl Acad Sci U S A. 2009;106(9):3207–12. doi: 10.1073/pnas.0808042106. [DOI] [PMC free article] [PubMed] [Google Scholar]
- 29.Huang S, Guo W, Tang Y, Ren D, Zou X, Peng X. miR-143 and miR-145 inhibit stem cell characteristics of PC-3 prostate cancer cells. Oncol Rep. 2012;28(5):1831–7. doi: 10.3892/or.2012.2015. [DOI] [PubMed] [Google Scholar]
- 30.Chen Z, Zeng H, Guo Y, Liu P, Pan H, Deng A, et al. miRNA-145 inhibits non-small cell lung cancer cell proliferation by targeting c-Myc. J Exp Clin Cancer Res. 2010;29:151. doi: 10.1186/1756-9966-29-151. [DOI] [PMC free article] [PubMed] [Google Scholar]
- 31.Xu N, Papagiannakopoulos T, Pan G, Thomson JA, Kosik KS. MicroRNA-145 regulates OCT4, SOX2, and KLF4 and represses pluripotency in human embryonic stem cells. Cell. 2009;137(4):647–58. doi: 10.1016/j.cell.2009.02.038. [DOI] [PubMed] [Google Scholar]
- 32.Pagliuca A, Valvo C, Fabrizi E, di Martino S, Biffoni M, Runci D, et al. Analysis of the combined action of miR-143 and miR-145 on oncogenic pathways in colorectal cancer cells reveals a coordinate program of gene repression. Oncogene. 2012 doi: 10.1038/onc.2012.495. [DOI] [PubMed] [Google Scholar]
- 33.Bouzourene H, Bosman FT, Seelentag W, Matter M, Coucke P. Importance of tumor regression assessment in predicting the outcome in patients with locally advanced rectal carcinoma who are treated with preoperative radiotherapy. Cancer. 2002;94(4):1121–30. [PubMed] [Google Scholar]
- 34.Yang AD, Fan F, Camp ER, van Buren G, Liu W, Somcio R, et al. Chronic oxaliplatin resistance induces epithelial-to-mesenchymal transition in colorectal cancer cell lines. Clin Cancer Res. 2006;12(14 Pt 1):4147–53. doi: 10.1158/1078-0432.CCR-06-0038. [DOI] [PubMed] [Google Scholar]
- 35.Sachdeva M, Mo YY. MicroRNA-145 suppresses cell invasion and metastasis by directly targeting mucin 1. Cancer Res. 2010;70(1):378–87. doi: 10.1158/0008-5472.CAN-09-2021. [DOI] [PMC free article] [PubMed] [Google Scholar]
- 36.Silva J, Chambers I, Pollard S, Smith A. Nanog promotes transfer of pluripotency after cell fusion. Nature. 2006;441(7096):997–1001. doi: 10.1038/nature04914. [DOI] [PubMed] [Google Scholar]
- 37.Yates A, Chambers I. The homeodomain protein Nanog and pluripotency in mouse embryonic stem cells. Biochem Soc Trans. 2005;33(Pt 6):1518–21. doi: 10.1042/BST0331518. [DOI] [PubMed] [Google Scholar]
- 38.Chambers I, Colby D, Robertson M, Nichols J, Lee S, Tweedie S, et al. Functional expression cloning of Nanog, a pluripotency sustaining factor in embryonic stem cells. Cell. 2003;113(5):643–55. doi: 10.1016/s0092-8674(03)00392-1. [DOI] [PubMed] [Google Scholar]
- 39.Hart AH, Hartley L, Ibrahim M, Robb L. Identification, cloning and expression analysis of the pluripotency promoting Nanog genes in mouse and human. Dev Dyn. 2004;230(1):187–98. doi: 10.1002/dvdy.20034. [DOI] [PubMed] [Google Scholar]
- 40.Ibrahim EE, Babaei-Jadidi R, Saadeddin A, Spencer-Dene B, Hossaini S, Abuzinadah M, et al. Embryonic NANOG activity defines colorectal cancer stem cells and modulates through AP1- and TCF-dependent mechanisms. Stem Cells. 2012;30(10):2076–87. doi: 10.1002/stem.1182. [DOI] [PubMed] [Google Scholar]
- 41.Sarkar FH, Li Y, Wang Z, Kong D. Pancreatic cancer stem cells and EMT in drug resistance and metastasis. Minerva Chir. 2009;64(5):489–500. [PMC free article] [PubMed] [Google Scholar]
- 42.Dallas NA, Xia L, Fan F, Gray MJ, Gaur P, van Buren G, 2nd, et al. Chemoresistant colorectal cancer cells, the cancer stem cell phenotype, and increased sensitivity to insulin-like growth factor-I receptor inhibition. Cancer Res. 2009;69(5):1951–7. doi: 10.1158/0008-5472.CAN-08-2023. [DOI] [PMC free article] [PubMed] [Google Scholar]
- 43.Ben-Porath I, Thomson MW, Carey VJ, Ge R, Bell GW, Regev A, et al. An embryonic stem cell-like gene expression signature in poorly differentiated aggressive human tumors. Nat Genet. 2008;40(5):499–507. doi: 10.1038/ng.127. [DOI] [PMC free article] [PubMed] [Google Scholar]
- 44.Marotta LL, Polyak K. Cancer stem cells: a model in the making. Curr Opin Genet Dev. 2009;19(1):44–50. doi: 10.1016/j.gde.2008.12.003. [DOI] [PubMed] [Google Scholar]
Associated Data
This section collects any data citations, data availability statements, or supplementary materials included in this article.