

Abstract
Leptin, a peptide hormone from adipose tissue and key player in weight regulation, has been suggested to be involved in sleep and cognition and to exert antidepressant-like effects, presumably via its action on the HPA-axis and hippocampal function. This led us to investigate whether genetic variants in the leptin gene, the level of leptin mRNA-expression and leptin serum concentrations are associated with response to antidepressant treatment. Our sample consisted of inpatients from the Munich Antidepressant Response Signature (MARS) project with weekly Hamilton Depression ratings, divided into two subsamples. In the exploratory sample (n=251) 17 single nucleotide polymorphisms (SNPs) covering the leptin gene region were genotyped. We found significant associations of several SNPs with impaired antidepressant treatment outcome and impaired cognitive performance after correction for multiple testing. The SNP (rs10487506) showing the highest association with treatment response (p=3.9 × 10⁻⁵) was analyzed in the replication sample (n=358) and the association could be verified (p=0.021) with response to tricyclic antidepressants. In an additional meta-analysis combining results from the MARS study with data from the Genome-based Therapeutic Drugs for Depression (GENDEP) and the Sequenced Treatment Alternatives to Relieve Depression (STAR*D) studies, nominal associations of several polymorphisms in the upstream vicinity of rs10487506 with treatment outcome were detected (p=0.001). In addition, we determined leptin mRNA expression in lymphocytes and leptin serum levels in subsamples of the MARS study. Unfavorable treatment outcome was accompanied with decreased leptin mRNA and leptin serum levels. Our results suggest an involvement of leptin in antidepressant action and cognitive function in depression with genetic polymorphisms in the leptin gene, decreased leptin gene expression and leptin deficiency in serum being risk factors for resistance to antidepressant therapy in depressed patients.
Keywords: Depression, Leptin, Treatment response, Gene expression, Pharmacogenetics
1. Introduction
The discovery of the protein leptin (Zhang et al., 1994), secreted from adipose tissue to signal the amount of peripheral fat stores to the brain (Schwartz et al., 2000), was a breakthrough for understanding the central regulation of energy metabolism. The human leptin gene (MIM 164160) is located on chromosome 7q31.3 spanning over 15 kb and encodes a 167-amino-acid secreted protein. Deficiency of leptin or its receptor (LEPR) have been described as monogenic causes of severe obesity and pituitary dysfunction (Schwartz et al., 2000; Zhang et al., 1994).
Major depressive disorder (MDD) is characterized by symptoms of depressed mood and anhedonia, but also vegetative symptoms like appetite loss, weight loss, sleep disturbances, and cognitive impairment in different domains (Cohen et al., 2001; Zihl et al., 1998). Consistent with these findings smaller hippocampal volumes have been reported in patients with MDD (Sheline et al., 1996). Impaired hypothalamic glucocorticoid signaling and a dysregulated hypothalamus-pituitary-adrenocortical (HPA) axis are further well established findings in MDD (de Kloet et al., 2005). Recent genome wide association studies regarding antidepressant treatment outcome failed to identify genome wide significant results but confirmed a complex genetic contribution (Garriock et al., 2010; Ising et al., 2009; Uher et al., 2010). Candidate gene studies investigating the outcome following antidepressant treatment have shown associations with specific genotypes (Horstmann and Binder, 2009) in genes involved in HPA-axis or serotonergic system.
Several clinical and epidemiological studies described a comorbidity between MDD and obesity (Luppino et al., 2010), but previous studies on MDD reported inconsistent results concerning plasma leptin levels (Deuschle et al., 1996; Kraus et al., 2002). Associations of leptin levels in the course of antidepressant treatment (Dryden et al., 1999; Kraus et al., 2002) suggest a link between antidepressant action, resolution of psychopathology and regulation of leptin.
Besides its effects upon appetite and weight, leptin influences numerous other central nervous system (CNS) functions like sleep and cognition and has been shown to influence HPA-axis regulation (Flier, 1998; Heiman et al., 1997; Sinton et al., 1999). As systemic and hippocampal administration of leptin in rodents significantly reduced depression-like behavior and influenced hippocampal gene expression, leptin has been suggested to exert antidepressant-like effects (Lu, 2007; Lu et al., 2006).
Pursuing our findings of an impaired response to antidepressants and differentially regulated HPA-axis in overweight and obese patients with MDD (Kloiber et al., 2007), we investigated a possible association of DNA polymorphisms in the leptin gene with the causality of MDD and with response to antidepressant treatment. Recent findings in the large Genome-based Therapeutic Drugs for Depression (GENDEP) study showing an association of a SNP (rs10487506) in the leptin gene and response to tricyclic antidepressants (Uher et al., 2010) encouraged us to substantiate our investigations by additionally analyzing leptin mRNA expression in lymphocytes and leptin serum levels in patients with MDD and in the course of antidepressant treatment. We also tested SNPs in the leptin gene region in a meta-analysis including data from GENDEP and the Sequenced Treatment Alternatives to Relieve Depression (STAR*D) study.
2. Experimental procedures
2.1. Subjects
2.1.1. Exploration sample
338 inpatients participated in the Munich Antidepressant Response Signature (MARS) Project (Binder et al., 2004) from 2000 until 2006. Patients presented with a single or recurrent unipolar depressive episode (85.2%) or a depressive episode in bipolar disorder (14.8%). The details of the study were explained and written informed consent was obtained. Patients were diagnosed by trained psychiatrists according to the DSM-IV criteria (APA, 1994). Depressive disorders due to a medical or neurological condition as well as alcohol or substance dependence were exclusion criteria. 346 control individuals randomly selected from a Munich-based community sample (Kohli et al., 2011) and screened for the absence of anxiety and affective disorders using the Composite International Diagnostic Screener (Wittchen et al., 1999) were recruited. All included individuals were Europeans of Caucasian descent. The study was approved by the ethics committee of the Medical Faculty at Ludwig Maximilian University in Munich, Germany. Age and gender distributions showed no significant differences between patients and controls (age: 48.05 ± 15.1, 46.82 ± 15.6, p=0.31; gender: 38.4%, 41.5% males, p=0.46).
Severity of psychopathology was assessed by trained raters using the 21-item Hamilton Depression (HAMD) Rating Scale (Overall and Rhoades, 1982) within 5 days after admission. Patients with a HAMD score lower than 14 were excluded (n=49) and 38 patients could not be included in the pharmacogenetic part of our study due to limited capacity of raters. In the remaining 251 patients psychopathology ratings were conducted weekly until week 6 and afterwards every two weeks until discharge. All individuals were treated with antidepressant drugs according to the doctor’s choice. Dosages of antidepressants were weekly monitored by evaluations of plasma concentrations. 67% of all patients received antidepressant monotherapy for more than 4 weeks, 16% received a mood stabilizer and 17% received an antipsychotic drug in addition to the antidepressant medication. 40% were additionally treated with benzodiazepines during the first days after admission. Body weight and height were measured at admission and BMI was calculated (BMI=weight/(height)2 [kg/m2]). Weight changes during hospitalization were followed by weekly weight measures.
Detailed demographic and clinical characteristics of patients and controls are shown in Supplementary Tables 1 and 2.
2.1.2. Replication sample
Patients of the replication sample were enrolled in the MARS study from 2006 until 2009. After applying the identical quality control and exclusion criteria, 358 patients entered the analysis.
2.1.3. Combined sample
For analysis of treatment response in the combined sample we merged patients from exploration and replication sample (n=609).
2.2. DNA preparation
40 ml of blood were collected in EDTA containing tubes and DNA from fresh blood was extracted using Puregene DNA-extraction kit (Gentra Systems Inc., Minneapolis, MN, USA).
2.3. SNP selection, genotyping and quality control
2.3.1. Exploration sample
17 SNPs in the leptin gene region were selected from dbSNP using Human Reference Sequence NCBI build 36.1/hg18 (http://www.ncbi.nlm.nih.gov/projects/SNP/, http://genome.ucsc.edu/). SNPs were selected from 15 kb 5′ to 6 kb 3′ of the leptin gene with an average distance of 2.5 kb. All listed exonic SNPs were genotyped (Table 1). Genotyping was performed with MALDI-TOF mass-spectrometer (MassArray® system), assays were designed using the Spectrodesigner software and genotype calls were done using the SpectroTyper software (Sequenom™; CA, USA). All primer sequences are available upon request. We replicated genotyping of one SNP, rs11761556, using Sentrix® Human-1 Genotyping beadchips (Illu mina, CA, USA) with a concordance of 100% between the two methods. Genotyping of all SNPs was successful in 98% of cases and controls. 11 of the 17 SNPs were polymorphic (Table 1).
Table 1.
Single nucleotide polymorphisms (SNPs) sorted by position, location and function according to hg18/dbSNP build 130; alleles (minor/major allele), minor allele frequency (MAF) in patients and controls. Nominal p-values of HWE testing in patients and controls.
| SNP-ID | SNP-No | Pos chr7 | Location/function | Alleles min/maj | MAF | HWE(pat) | HWE(con) |
|---|---|---|---|---|---|---|---|
| rs10487505 | 1 | 127647399 | 5′ of LEP | C/G | 0.48 | 0.45 | 1.00 |
| rs4731423 | 2 | 127662569 | 5′ of LEP, promoter, CpG | G/A | 0.45 | 0.22 | 0.58 |
| rs10487506 | 3 | 127665391 | 5′ of LEP, promoter, CpG | A/G | 0.44 | 0.22 | 0.82 |
| rs2167270 | 4 | 127668585 | Exon 1, 5′ UTR, CpG-island | A/G | 0.37 | 0.56 | 0.16 |
| rs2278814 | 5 | 127668783 | Intron 1 | A/G | 0.00 | NA | NA |
| rs2278815 | 6 | 127669087 | Intron 1, CpG | G/A | 0.45 | 0.22 | 0.58 |
| rs4731426 | 7 | 127669306 | Intron 1, CpG | G/C | 0.45 | 0.23 | 0.66 |
| rs12706832 | 8 | 127674375 | Intron 1 | A/G | 0.45 | 0.06 | 1.00 |
| rs11763517 | 9 | 127677298 | Intron 1 | T/C | 0.49 | 0.51 | 0.91 |
| rs13306517 | 10 | 127679382 | Exon 2, coding, synonymous | G/A | 0.00 | NA | NA |
| rs1800583 | 11 | 127679451 | Exon 2, coding, synonymous | G/A | 0.00 | NA | NA |
| rs3828942 | 12 | 127681541 | Intron 2 | A/G | 0.43 | 0.08 | 0.66 |
| rs17151919 | 13 | 127681828 | Exon 3, coding, Val94Met | A/G | 0.00 | NA | NA |
| rs28954113 | 14 | 127681857 | Exon 3, coding, synonymous | T/C | 0.00 | NA | NA |
| rs1800564 | 15 | 127681876 | Exon 3, coding, Val110Met | G/A | 0.00 | NA | NA |
| rs11761556 | 16 | 127684305 | Exon 3, 3′ UTR | C/A | 0.45 | 0.06 | 0.91 |
| rs4731429 | 17 | 127690775 | 3′ of LEP | A/G | 0.46 | 0.006 | 0.33 |
2.3.2. Replication sample
Genotyping was performed using Sentrix Human-1 (100k) and Human-Hap300 (317k) Genotyping BeadChips (Illumina, CA, USA) as previously described by Kohli et al. (2011), containing the SNPs rs10487506, rs10249476, rs11763517, rs2060715, rs2122627, rs4731429, rs7796202, rs7796202 in the leptin gene region. All SNPs were successfully genotyped in 98% of cases and controls. 7 of these 8 SNPs were polymorphic, none of the SNPs showed significant deviation from Hardy–Weinberg equilibrium (HWE).
2.4. Cognitive performance
Cognitive performance was examined in a subgroup of the exploration sample. Additional inclusion criteria (age<60 years, sufficient German language abilities, no history of head trauma or electroconvulsive therapy) were applied. Verbal short-term memory was assessed in 163 patients using the digit span forward of the revised German version of the Wechsler Memory Scale (WMS-R) (Wechsler, 2000). Selective attention was assessed with the Stroop Color Naming Interference Test, German version (Bäumler, 1985), in 118 patients. The time for naming print colors under interference condition (interference score) was used as test score. Tests for cognitive performance were not applied in the replication sample.
2.5. Hardy–Weinberg equilibrium (HWE), linkage dysequilibrium (LD) and haplotype analysis
SNPs were tested for genotyping quality using the exact test for deviation from HWE (Wigginton et al., 2005) (Table 1).
LD was analyzed by D′ and r2 measures (Hill and Robertson, 1968). Visualization of LD measures and haplotype analysis was performed using version 3.2 of HAPLOVIEW (http://www.broad.mit.edu/mpg/haploview). Blocks were defined according to the confidence interval method (Gabriel et al., 2002).
Pairwise LD measures (D′ and r2) in controls were calculated, revealing two LD blocks within the leptin gene region according to the D′ based method (Supplementary Figure 1).
LD block 1 comprised SNPs rs4731423, rs10487506, rs2167270, rs2278815, rs4731426, rs12706832, and spanned the promoter region, the 5′ UTR, exon 1 and intron 1 of the gene. LD block 2 comprised intron 2, exon 3 and the 3′ UTR (rs3828942, rs11761556, rs4731429).
2.6. Leptin radioimmunoassay
Fasting venous blood samples were drawn between 8 and 10 a.m. within 5 days after admission and 5 days prior to discharge in 83 patients with MDD. After centrifugation serum was frozen at −20 °C. Leptin concentrations were measured using a commercial radioimmunoassay (Linco Research, MO, USA).
2.7. Gene expression
In 24 male patients (MARS study) leptin mRNA expression was analyzed at admission, after 2 and after 5 weeks. We selected 12 remitters (HAMD<10 after 5 weeks of antidepressant treatment; mean: 4.8±2.2 SD) and 12 non-responders (HAMD improvement<25% after 5 weeks compared to admission; mean: 18.9±4.3 SD) matched for age and baseline HAMD. The mean age of remitters and non-responders was 44.3±12.3 (SD) and 45.5±15.2 (SD) years (p=0.84), respectively. Mean HAMD score at admission was 29.3±6.7 (SD) and 28.3±5.6 (SD) (p=0.72), respectively. Remitting and non-responding patients did not differ with respect to psychotropic or other medication at the time of blood draw (Wilcoxon paired test; data available on request).
Whole blood was drawn from fasting patients between 8 and 9 a.m. into PAXgene RNA Blood tubes (Qiagen, Hilden, Germany) and isolated using PAXgene Blood RNA Kits (Qiagen, Hilden, Germany) according to the instructions of the manufacturer. RNA was quantified by UV absorption using the Nanophotometer (Implen, Munich, Germany) and quality was determined on the Agilent Bioanalyzer with a RIN cut-off >5 (Agilent, Santa Clara, CA, USA). 200 ng of total RNA was reverse transcribed to cDNA and subsequently biotin labeled using the Ambion TotalPrep Amplification Kit (Ambion, Austin, TX, USA). 750 ng of cDNA was hybridized to Illumina HT-12 v3.0 arrays (Illumina, San Diego, CA, USA) and incubated overnight according to the manufacturer’s protocol. Arrays were washed, stained with Cy3 labeled streptavidin, dried and scanned on the Illumina BeadScan confocal laser scanner (BeadStation 500G; Illumina, CA, USA) according to the manufacturer’s protocol. The generated fluorescence intensity data were extracted using the Illumina Beadstudio program and loaded into R for downstream statistical analysis. The data were transformed and normalized using the variance stabilizing normalization (VSN). T-statistics were applied contrasting the normalized expression levels for the LEP gene transcript (probe ID ILMN_2207505 position 127684749-27684798/hg18 on the plus strand of chromosome 7q32) of remitters and non-responders at week 0, 2 and 5. The second LEP gene transcript detected by the chip (ILMN_2207504) could not be analyzed due to low average expression levels.
2.8. Statistical analysis
2.8.1. Exploration sample
Treatment response was evaluated with different variables: time until partial response (reduction of HAMD score≥25 percent), time until response (reduction of HAMD score≥50 percent), achievement of remission (HAMD score<10 in week 4 to 8), number of treatment attempts during the current depressive episode, and the course of psychopathology between admission and week 6 by calculating orthogonal polynomial components depicting level, linear, quadratic and cubic trends. BMI at admission and BMI change during six weeks of psychopharmacological therapy, age at onset, leptin levels and cognitive test results were analyzed (Supplementary Table 3). All variables were corrected for age, gender and BMI by calculation of standardized residuals in a multiple regression analysis. Outcome in cognitive assessments was additionally corrected for years of education, while change in BMI was corrected for relative number of medications with weight changing side effect following the suggestions by Zimmermann et al. (2003). Analysis of Variance (ANOVA) with phenotype residuals as dependent and genotype as independent variable were applied. Case–control association was analyzed using Fisher’s exact test. Achievement of remission was analyzed using chi-squared test (2-sided). Three genetic models were applied: (1) genotypic, (2) dominant for the first allele, and (3) dominant for the second allele.
2.8.2. Correction for multiple testing
To correct for multiple testing in the exploration sample the Westfall and Young (1993) permutation method with 100,000 permutation runs was applied to take advantage of the dependence structure between SNPs, phenotypes and models. Because we investigated a specific set of SNPs belonging to a single gene we additionally used the Fisher-Product-Method (Fisher, 1932) to obtain a multivariate association score across all SNPs. Genetic association analyses and correction for multiple testing were performed using the WG Permer software (http://www.wg-permer.org/).
Additional analyses were performed with SPSS Version 17.0 and with an association analysis program provided by Institute of Human Genetics, Helmholtz Center Munich, Germany (http://ihg.gsf.de/cgi-bin/hw/hwa1.pl).
2.8.3. Replication sample/combined sample
Association analyses of rs10487506 (recessive model for the A allele) with the criterion remission in week 4 to 8 was performed in the replication and the combined sample using chi-squared test (2-sided). Analyses were conducted with the programs described above.
2.8.4. Power calculations
Power calculations were performed using the Genetic Power Calculator (Purcell et al., 2003) (http://pngu.mgh.harvard.edu/~purcell/gpc). Assuming a remission rate in MDD patients of 0.448 (estimated from the MARS data), the size of our exploration sample is sufficient to detect association effects for the selected tagging SNP markers of at least 1.65 OR with a statistical power of 80% and a maximal experiment-wise alpha error of 5%, even under the conservative assumption of complete independence of the SNPs (adjusted alpha error=0.05/11 SNPs=0.0045).
2.9. Meta-analysis GENDEP, STAR*D, and MARS
Recently, a meta-analysis of three large genome-wide pharmacogenetic studies (MARS, GENDEP und STAR*D) has been performed. For study details we would like to refer to the respective previous publications: GENDEP (Uher et al., 2010), STAR*D (Garriock et al., 2010), MARS (Ising et al., 2009). 2256 patients (GENDEP: n=672, STAR*D: n=980, MARS: n=604) were included in the analysis. The number of individuals was lower compared to the previous reports, as additional common inclusion criteria were applied: Caucasian ethnicity, unipolar depression, baseline HAMD-17 of 14 or higher. Imputation of additional SNPs was performed on the basis of HapMap Phase 3 CEU data (www.hapmap.org). Association results from this meta-analysis for 70 SNPs located in the leptin gene region (chr7:127718560-127618816, hg18) with remission after 12 weeks of treatment were used. Statistical analysis was performed using PLINK (http://pngu.mgh.harvard.edu/~purcell/plink/) and METAL (http://www.sph.umich.edu/csg/abecasis/metal/).
For an overview of all samples and subsamples used for the different analyses please see Supplementary Table 5.
3. Results
3.1. Treatment response
3.1.1. Exploration sample
We detected nominally significant associations with treatment response in 10 SNPs (Supplementary Table 3). Associations with 7 SNPs (rs4731423, rs10487506, rs2278815, rs4731426, rs12706832, rs11763517, and rs3828942) remained significant after correction for multiple testing for the number of SNPs (Supplementary Table 3). The strongest association after correction for multiple testing for the number of SNPs, all phenotypes and genetic models, (p(nominal)=3.9 × 10⁻⁵) was detected for rs10487506 under a recessive mode of inheritance. Patients carrying the AA genotype of rs10487506 showed a prolonged response to antidepressant treatment and a significantly lower proportion of AA carriers achieved remission (Table 2). The analysis of orthogonal polynomial components revealed a significant difference in the level of HAMD score development during six weeks of treatment (zero order polynomial; Supplementary Table 3 and Supplementary Figure 2A). Rs10487506 is mapping 3.2 kb 5′ of the transcription start site of the leptin gene in LD block 1.
Tab 2.
Exploration, replication, and combined sample: associations of leptin SNPs with treatment response (all patients, monotherapy groups) and cognitive performance. Means, SD- (every second column when available), and nominal p-values are depicted.
| Exploration sample | |||||||||
| All patients (n=251) | |||||||||
| rs10487506 genotype | AA (n=55) | AG (n=113) | GG (n=83) | F3,248 | p-Value | ||||
| Time until partial response | Weeks | 3.90 | 2.65 | 2.56 | 1.83 | 2.59 | 2.11 | 17.12 | 0.000039 |
| Time until response | Weeks | 6.09 | 3.96 | 4.72 | 2.64 | 4.47 | 3.14 | 7.20 | 0.0065 |
| Remission | % | 23.4 | 50.4 | 50.6 | 0.00040 | ||||
| Treatment attempts | n | 3.00 | 2.74 | 2.73 | 2.31 | 2.00 | 1.36 | 3.93 | 0.049 |
| SSRI (n=72) | |||||||||
| rs10487506 genotype | AA (n=13) | AG (n=32) | GG (n=27) | F3,69 | p-Value | ||||
| Time until partial response | Weeks | 3.98 | 3.02 | 2.15 | 0.98 | 2.84 | 2.53 | 4.15 | 0.067 |
| Time until response | Weeks | 5.00 | 3.84 | 4.64 | 2.87 | 4.23 | 2.69 | 0.18 | 0.84 |
| Remission | % | 30.8 | 53.1 | 55.6 | 0.13 | ||||
| Treatment attempts | n | 2.20 | 1.64 | 2.74 | 3.09 | 1.85 | 0.90 | 0.06 | 0.69 |
| Tricyclic antidepressants (n=31) | |||||||||
| rs10487506 genotype | AA (n=6) | AG (n=15) | GG (n=10) | F3,28 | p-Value | ||||
| Time until partial response | Weeks | 4.53 | 2.36 | 2.94 | 1.85 | 3.08 | 2.47 | 3.66 | 0.081 |
| Time until response | Weeks | NAn | NAn | 4.17 | 3.01 | 5.60 | 4.51 | NAn | NAn |
| Remission | % | 0.0 | 46.7 | 50.0 | 0.030 | ||||
| Treatment attempts | n | 5.33 | 5.13 | 3.70 | 2.83 | 2.13 | 1.81 | 0.41 | 0.88 |
| Mirtazapine (n=64) | |||||||||
| rs10487506 genotype | AA (n=11) | AG (n=30) | GG (n=23) | F3,61 | p-Value | ||||
| Time until partial response | Weeks | 4.54 | 3.19 | 3.17 | 2.42 | 2.13 | 1.68 | 4.65 | 0.025 |
| Time until response | Weeks | 8.16 | 3.38 | 4.53 | 2.38 | 3.65 | 2.30 | 19.69 | 0.000014 |
| Remission | % | 9.1 | 56.7 | 56.5 | 0.0041 | ||||
| Treatment attempts | n | 2.42 | 1.31 | 2.57 | 1.95 | 2.06 | 1.26 | 0.01 | 0.98 |
| Cognitive performance | |||||||||
| rs4731423 genotype | AA (n=53) | AG (n=73) | GG (n=37) | F4,159 | p-Value | ||||
| Memory test (score) | 6.48 | 0.27 | 7.53 | 0.23 | 7.64 | 0.35 | 12.58 | 0.0040 | |
| rs3828942 genotype | AA (n=43) | AG (n=52) | GG (n=23) | F4,114 | p-Value | ||||
| STROOP test (interference score) | 101.52 | 5.21 | 85.27 | 4.13 | 86.55 | 4.58 | 6.99 | 0.0045 | |
| Replication sample | |||||||||
| All patients (n=358) | |||||||||
| rs10487506 genotype | AA (n=79) | AG (n=171) | GG (n=108) | p-Value | |||||
| Remission | % | 50.6 | 55.6 | 58.3 | 0.34 | ||||
| SSRI (n=54) | |||||||||
| rs10487506 genotype | AA (n=16) | AG (n=26) | GG (n=12) | p-Value | |||||
| Remission | % | 56.3 | 61.5 | 66.7 | 0.63 | ||||
| Tricyclic antidepressants (n=65) | |||||||||
| rs10487506 genotype | AA (n=21) | AG (n=26) | GG (n=18) | p-Value | |||||
| Remission | % | 38.1 | 61.5 | 77.8 | 0.021 | ||||
| Mirtazapine (n=74) | |||||||||
| rs10487506 genotype | AA (n=18) | AG (n=37) | GG (n=19) | p-Value | |||||
| Remission | % | 55.6 | 45.9 | 52.6 | 0.59 | ||||
| Combined sample | |||||||||
| All patients (n=609) | |||||||||
| rs10487506 genotype | AA (n=134) | AG (n=283) | GG (n=192) | p-Value | |||||
| Remission | % | 39.6 | 53.5 | 55.0 | 0.0029 | ||||
| SSRI (n=126) | |||||||||
| rs10487506 genotype | AA (n=29) | AG (n=58) | GG (n=39) | p-Value | |||||
| Remission | % | 44.8 | 56.9 | 59.0 | 0.22 | ||||
| Tricyclic antidepressants (n=96) | |||||||||
| rs10487506 genotype | AA (n=27) | AG (n=41) | GG (n=28) | p-Value | |||||
| Remission | % | 29.6 | 56.1 | 67.9 | 0.0059 | ||||
| Mirtazapine (n=138) | |||||||||
| rs10487506 genotype | AA (n=29) | AG (n=67) | GG (n=42) | p-Value | |||||
| Remission | % | 37.9 | 50.7 | 54.8 | 0.17 | ||||
There were no patients in this genotype-subgroup, who achieved the response criterion.
The Fisher Product Method (FPM) revealed a highly significant p-value of 0.00018 for the combination of all tests (SNPs, treatment outcome and models). Combining correlated phenotype groups this test validated the significant association of genetic polymorphisms in the leptin gene with treatment outcome.
Neither neuroleptic co-medication nor inclusion of bipolar patients confounded these results (Supplementary Table 4 and Supplementary Figure 2B).
Because of the heterogeneity of antidepressant treatment in our sample, we analyzed patients receiving different antidepressant monotherapies separately (SSRIs, tricyclic antidepressants (TCAs), and mirtazapine). Patients carrying the AA genotype for rs10487506 showed significantly lower remission rates or impaired response in subgroups treated with TCAs and mirtazapine (Table 2 and Supplementary Figure 2C–E).
Haplotype analysis did not result in a stronger association with treatment outcome than single marker associations in both LD blocks as described above. The most frequent AAGACG haplotype (0.432) of LD block 1 showed the most significant association with treatment outcome (remission rates; p=0.0032), in LD block 2 haplotype AAG with a frequency of 0.429 displayed the most significant association with treatment response (p=0.0066) (Supplementary Figure 1).
3.1.2. Replication sample and combined sample
In the replication sample, remission rates were lower in AA carriers of rs10487506 but the statistical analysis was only significant in the subgroup of TCA treated patients (p(nominal)=0.021, Table 2). However, in the combined sample the impaired response in AA carriers of rs10487506 was significant for all patients (p(nominal)=0.0029) and the subgroup of patients treated with TCA monotherapy (p(nominal)=0.0059, Table 2, Figure 1).
Figure 1.
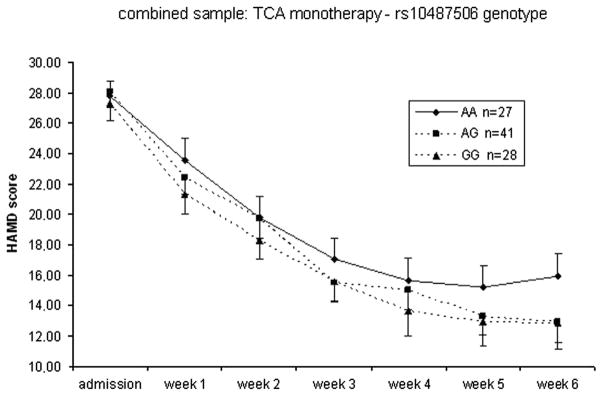
Response to treatment according to rs10487506 genotypes in all patients (combined sample) receiving tricyclic antidepressants (TCAs). Mean HAMD scores and standard errors of the mean at admission and weeks 1–6 are shown.
3.1.3. Meta-analysis GENDEP, STAR*D, and MARS
In the meta-analysis combining the pharmacogenetic samples GENDEP, STAR*D, and MARS we were not able to confirm an association of antidepressant treatment response and rs10487506, as the significant associations in MARS and GENDEP were detected for TCA treatment subgroups and differing risk genotypes in both studies. However, 14 kb to 21 kb further upstream of the promoter SNP rs10487506 we detected four SNPs, rs6979832 (p=0.003), rs2167289 (p=0.005), rs11764840 (p=0.001), and rs10954172 (p=0.001), to be nominally associated with remission after 12 weeks in the meta-analysis with consistent distribution of risk genotypes over the 3 studies. These SNPs were not in LD with rs10487506. Detailed results for these SNPs are provided in Supplementary Table 6.
3.2. Cognitive performance
The association of two SNPs and cognitive performance remained significant after correction for multiple testing for the number of SNPs. Patients with the AA genotype for SNP rs4731423 presented significantly lower verbal short-term memory performance at admission (Table 2). In the test for selective attention, patients carrying AA in rs3828942 showed a significantly lower performance reflected by a higher interference score (Table 2). By combining the correlated cognitive phenotype variables the FPM analysis showed significant association over all tested genetic polymorphisms in the leptin gene with cognitive performance (p=0.0017).
Analysis of LD between these markers associated with cognitive performance and rs10487506 using HAPLOVIEW resulted in r2 of 0.65 for rs4731423 and rs10487506 and r2 of 0.89 for rs3828942 and rs10487506.
3.3. Leptin serum levels
Leptin serum levels at admission were significantly lower in the non-remitter group (n=49, 13.00±9.37 μg/l) as compared to the remitter group (n=34, 15.57±16.05 μg/l), when corrected for age, gender and BMI (F4,79=8.96, p=0.0037), underscoring a possible functional role of leptin in response to antidepressants.
In concordance with previous studies (Fulda et al., 2010), leptin serum levels at admission displayed a strong positive correlation with BMI at admission (Correlation-Coefficient=0.72, p=3.62 ×10⁻¹⁴), a significant gender difference with higher leptin levels in women after correction for age and BMI (F3,80=43.74, p=4.05 × 10⁻⁹) and a significant correlation between changes in leptin levels and changes in BMI during treatment (Correlation-Coefficient=0.73, p=7.91 × 10⁻¹²). However, no significant genetic associations between SNPs and leptin serum levels could be detected.
3.4. Gene expression
We analyzed expression patterns in phenotypically discordant groups of remitters (n=12) and non-responders (n=12). Non-responders showed a significant decline in their mRNA expression levels during treatment (admission–week 5: p=0.010; week 2–week 5: p=0.021), whereas expression did not change significantly in remitters. In week 5 the comparison of both groups showed a non-significant numerical trend towards a higher leptin mRNA expression in remitters (Figure 2).
Figure 2.

Normalized leptin mRNA-expression levels in lymphocytes during antidepressant treatment (admission, week 2 and week 5). Mean mRNA-expression levels and standard errors of the mean are shown.
3.5. Putative functional relevance of the associated SNPs
The polymorphisms in the leptin gene reported herein (rs4731423, rs10487506, rs4731426, and rs12706832) are located in the suggested promoter region and 5′ region of the human leptin gene and all change CG-dinucleotides, which could serve as possible DNA methylation sites in controlling gene expression. Moreover, rs2167270 hits the classical CpG island (Gardinergarden and Frommer, 1987) of the leptin promoter in a phylogenetically highly conserved region.
However, RT-PCR analysis in 64 subjects (data not shown) as well as eQTL analysis from publicly available databases (GENEVAR) did not show an association of leptin SNPs with gene expression.
3.6. Case–control association, weight, and weight change
Our analyses showed no significant associations for disease susceptibility for MDD (Supplementary Table 3).
We detected significant associations between Body Mass Index (BMI) and rs4731429 as well as rs3828942 (Supplementary Table 3). The association with rs4731429 could not be verified in the replication sample and rs3828942 was not contained in the SNP set of the replication sample. No significant associations with BMI change from admission to week 6 could be detected.
4. Discussion
Our data suggest an association of polymorphisms in the leptin gene with resistance to antidepressant treatment, the failure to achieve remission, and disturbed cognitive function in depressed patients. Furthermore, we detected decreased leptin serum levels and reduced leptin mRNA expression in patients with impaired treatment response independent of their genotype configuration. These findings probably point towards a connection of leptin deficiency and impaired treatment response to antidepressants.
The genotype(rs10487506)–treatment response association was most pronounced in patients treated with TCA monotherapy. This finding is supported by a previous report from the GENDEP project (Uher et al., 2010), where patients treated with nortriptyline but not escitalopram showed an association of rs10487506 genotypes with treatment response. However, risk genotypes associated with impaired response in the GENDEP project did not show concordance with our findings, which does not support a functional role of rs10487506. Notwithstanding, both studies detected this genetic marker (rs10487506) for antidepressant treatment response in the promoter region of the leptin gene. Following the association of rs10487506 with TCA treatment outcome and the different risk genotype distribution among GENDEP (Uher et al., 2010) and MARS samples, an association of rs10487506 with overall treatment response could not be replicated in the meta-analysis of GENDEP, STAR*D and MARS data. Nonetheless, 4 SNPs upstream of rs10487506 showed nominally significant associations and consistent risk genotype distributions among all three studies in the meta-analysis, endorsing a possible genetic association in the 5′ region of the leptin gene with antidepressant treatment outcome. Although in a genome-wide context, the meta-analysis results would not withstand correction for multiple testing.
Leptin was found to exert pronounced effects on neuroendocrine systems such as the HPA-axis (Heiman et al., 1997; Lu, 2007) and according to a large number of studies, beneficial response to antidepressants has been suggested to be associated with a normalization of HPA-axis hyperactivity (de Kloet et al., 2005). This might involve a leptin-associated mechanism, as leptin is known to attenuate the HPA-axis at multiple levels (Heiman et al., 1997; Lu, 2007; Yu et al., 1997). In this context, the inhibiting influence of leptin on the HPA-axis as suggested in previous studies (Heiman et al., 1997; Himmerich et al., 2007) could explain an antidepressant-like effect of leptin.
We also observed significant associations of leptin SNPs with cognitive performance (memory and attention) in patients with MDD. The genotypes linked to impaired cognitive performance are in LD with the alleles associated with impaired response to antidepressants. This is in accordance with leptin’s numerous CNS functions (Flier, 1998) like modulating hippocampal synaptic plasticity and long-term potentiation (Shanley et al., 2001). Furthermore, leptin could be demonstrated to increase adult neurogenesis in the dentate gyrus (Garza et al., 2008). Additionally, leptin has been suggested to play an important role in pre-and neonatal brain development (Lu, 2007) supported by the finding that leptin receptors are widely expressed in many extra-hypothalamic regions of the brain including hippocampus, limbic structures, and brain stem (Hakansson et al., 1998). In recent studies in rodents, systemic and hippocampal administration of leptin significantly reduced depression-like behavior and influenced hippocampal gene expression showing an enhancement of c-fos mRNA expression (Lu et al., 2006). In addition, emerging evidence evolved for neurotrophic actions of antidepressants reversing neuronal atrophy and cell loss in depressed patients (Duman and Monteggia, 2006).
These observations are consistent with our functional findings regarding decreased leptin mRNA expression levels and decreased leptin serum levels in individuals with impaired treatment response. Associated SNPs changing the CpG constellation in the promoter region of the leptin gene may influence epigenetic modification and lead to impaired treatment response via decreased mRNA expression. Further evidence for a functional role of leptin in this context was reported (Esel et al., 2005) describing an increase in leptin serum levels during successful antidepressant treatment of depressed patients.
In contrast, epidemiological studies indicate an elevated occurrence of depression in obese individuals (Luppino et al., 2010). Although the elevation of weight is accompanied with increased leptin levels, these findings can be explained by the resistance of the leptin receptor in obese subjects, which might therefore be a common biological factor for the relationship of obesity and depression (Lu, 2007).
Our study followed an open label naturalistic design. Therefore, the results require replication in randomized studies. Also the results of the cognitive tests should be verified in a larger sample considering additional cognitive domains, e.g. attention and executive function. Although we were not able to functionally link risk genotypes to altered gene expression, functional experiments on tissue-specific gene-expression and methylation status in the leptin gene region are needed to further evaluate the hypothesis of epigenetic regulation of leptin gene expression.
Taken together, our results suggest that genetic polymorphisms in the leptin gene are involved in treatment resistance to antidepressant therapy and impaired cognition in depressed patients. Our results regarding leptin serum concentrations and mRNA expression levels point towards a connection between a decrease in the leptin system and impaired response to antidepressant treatment.
Identifying depressed patients at risk for therapy resistance and cognitive impairment using genetic variants and biological markers could possibly have direct clinical impact on individualized disease management and specific treatments. Elucidating the biological processes of leptin involved in this altered responsiveness and cognitive functioning could also provide insight into the action of antidepressant drugs apart from the widely discussed neurotransmitter systems.
Supplementary Material
Acknowledgments
Role of the funding source
The MARS-Study was funded by the Max Planck Society and in part by a research grant from the German Federal Ministry for Education and Research (BMBF) in the framework of the National Genome Research Network (NGFN2 and NGFN-Plus, FKZ 01GS0481) and by the BMBF Program “Molecular Diagnostics: Validation of Biomarkers for Diagnosis and Outcome in Major Depression” (01ES0811). The authors’ research on personalized medicine is supported by the Max Planck Excellence Foundation.
The STAR*D study was supported by funds from NIMH under contract N01 MH-90003 to the University of Texas Southwestern Medical Center at Dallas (A. John Rush, M.D., P.I.). Genotyping of STAR*D samples was funded by NIMH (R01 MH-072802; Steven P. Hamilton, M.D., Ph.D., P.I.).
The GENDEP project was supported by a European Commission Framework 6 grant (contract reference: LSHB-CT-2003-503428), the Biomedical Research Centre for Mental Health at the Institute of Psychiatry, King’s College London and South London, and the Maudsley National Health Service Foundation Trust (National Institute for Health Research, United Kingdom) and the Medical Research Council, United Kingdom (G0701420).
We thank S. Damast, S. Sauer, M. Ködel, M. Rex-Haffner, G. Ernst-Jansen, E. Kappelmann and B. Siegel for their excellent technical assistance.
Appendix A. Supplementary materials
Supplementary data associated with this article can be found in the online version at http://dx.doi.org/10.1016/j.euroneuro.2012.08.010.
Footnotes
Contributors
Stefan Kloiber has written the first draft of the manuscript. Stefan Kloiber, Stephan Ripke, Benno Pütz, Bertram Müller-Myhsok, Marcus Ising and Daria Salyakina undertook the statistical analysis and wrote parts of the manuscript. Martin A. Kohli, Manfred Uhr, and Thomas Bettecken carried out genotyping and bioinformatic analyses. Elisabeth Binder, Johannes Hennings, Torsten Klengel, and Benno Pütz performed gene expression experiments and statistical analysis of gene expression data. Simone Reppermund and Josef Zihl conducted the cognitive tests in patients. Stefan Kloiber, Tanja Bruckl, Tatjana Dose, Paul G. Unschuld and Susanne Lucae conducted the clinical studies. Manfred Uhr performed the analysis of leptin serum levels. Susanne Lucae, Elisabeth Binder, Marcus Ising, and Florian Holsboer designed the study.
Rudolf Uher and Peter McGuffin provided data from the GENDEP study for the meta-analysis, Roy Perlis and Steven P. Hamilton provided data from the STAR*D project for the meta-analysis. Stephan Ripke performed the meta-analysis.
All authors contributed to and have approved of the final manuscript.
Conflict of interest
Dr. Perlis has received consulting fees or served on scientific advisory boards for Genomind, Healthrageous, Pamlab, Proteus Biomedical, and RIDVentures. He receives royalties from Concordant Rater Systems (now a Medco subsidiary).
References
- APA. Diagnostic and Statistical Manual of Mental Disorders. 4. American Psychiatric Association; Washington DC: 1994. [Google Scholar]
- Bäumler G. Farbe-Wort-Interferenztest (FWIT) nach JR Stroop. Hogrefe, Göttingen; 1985. [Google Scholar]
- Binder EB, Salyakina D, Lichtner P, Wochnik GM, Ising M, Putz B, et al. Polymorphisms in FKBP5 are associated with increased recurrence of depressive episodes and rapid response to antidepressant treatment. Nat Genet. 2004;36:1319–1325. doi: 10.1038/ng1479. [DOI] [PubMed] [Google Scholar]
- Cohen R, Lohr I, Paul R, Boland R. Impairments of attention and effort among patients with major affective disorders. J Neuropsychiatr Clin Neurosci. 2001;13:385–395. doi: 10.1176/jnp.13.3.385. [DOI] [PubMed] [Google Scholar]
- Deuschle M, Blum WF, Englaro P, Schweiger U, Weber B, Pflaum CD, et al. Plasma leptin in depressed patients and healthy controls. Horm Metab Res. 1996;28:714–717. doi: 10.1055/s-2007-979885. [DOI] [PubMed] [Google Scholar]
- de Kloet ER, Joels M, Holsboer F. Stress and the brain: from adaptation to disease. Nat Rev Neurosci. 2005;6:463–475. doi: 10.1038/nrn1683. [DOI] [PubMed] [Google Scholar]
- Dryden S, Brown M, King P, Williams G. Decreased plasma leptin levels in lean and obese Zucker rats after treatment with the serotonin reuptake inhibitor fluoxetine. Horm Metab Res. 1999;31:363–366. doi: 10.1055/s-2007-978755. [DOI] [PubMed] [Google Scholar]
- Duman RS, Monteggia LM. A neurotrophic model for stress-related mood disorders. Biol Psychiatry. 2006;59:1116–1127. doi: 10.1016/j.biopsych.2006.02.013. [DOI] [PubMed] [Google Scholar]
- Esel E, Ozsoy S, Tutus A, Sofuoglu S, Kartalci S, Bayram F, et al. Effects of antidepressant treatment and of gender on serum leptin levels in patients with major depression. Prog Neuro-Psychopharmacol Biol Psychiatry. 2005;29:565–570. doi: 10.1016/j.pnpbp.2005.01.009. [DOI] [PubMed] [Google Scholar]
- Fisher RA. Statistical methods for research workers. Oliver and Boyd; London: 1932. [Google Scholar]
- Flier JS. What’s in a name? In search of leptin’s physiologic role. J Clin Endocrinol Metab. 1998;83:1407–1413. doi: 10.1210/jcem.83.5.4779. [DOI] [PubMed] [Google Scholar]
- Fulda S, Linseisen J, Wolfram G, Himmerich S, Gedrich K, Pollmacher T, et al. Leptin plasma levels in the general population: influence of age, gender, body weight and medical history. Protein Pept Lett. 2010;17:1436–1440. doi: 10.2174/0929866511009011436. [DOI] [PubMed] [Google Scholar]
- Gabriel SB, Schaffner SF, Nguyen H, Moore JM, Roy J, Blumenstiel B, et al. The structure of haplotype blocks in the human genome. Science. 2002;296:2225–2229. doi: 10.1126/science.1069424. [DOI] [PubMed] [Google Scholar]
- Gardinergarden M, Frommer M. CpG islands in vertebrate genomes. J Mol Biol. 1987;196:261–282. doi: 10.1016/0022-2836(87)90689-9. [DOI] [PubMed] [Google Scholar]
- Garriock HA, Kraft JB, Shyn SI, Peters EJ, Yokoyama JS, Jenkins GD, et al. A genomewide association study of citalopram response in major depressive disorder. Biol Psychiatry. 2010;67:133–138. doi: 10.1016/j.biopsych.2009.08.029. [DOI] [PMC free article] [PubMed] [Google Scholar]
- Garza JC, Guo M, Zhang W, Lu XY. Leptin increases adult hippocampal neurogenesis in vivo and in vitro. J Biol Chem. 2008;283:18238–18247. doi: 10.1074/jbc.M800053200. [DOI] [PMC free article] [PubMed] [Google Scholar]
- Hakansson ML, Brown H, Ghilardi N, Skoda RC, Meister B. Leptin receptor immunoreactivity in chemically defined target neurons of the hypothalamus. J Neurosci. 1998;18:559–572. doi: 10.1523/JNEUROSCI.18-01-00559.1998. [DOI] [PMC free article] [PubMed] [Google Scholar]
- Heiman ML, Ahima RS, Craft LS, Schoner B, Stephens TW, Flier JS. Leptin inhibition of the hypothalamic-pituitary-adrenal axis in response to stress. Endocrinology. 1997;138:3859–3863. doi: 10.1210/endo.138.9.5366. [DOI] [PubMed] [Google Scholar]
- Hill WG, Robertson A. Linkage disequilibrium in finite populations. TAG Theor Appl Genet. 1968;38:226–231. doi: 10.1007/BF01245622. [DOI] [PubMed] [Google Scholar]
- Himmerich H, Zimmermann P, Ising M, Kloiber S, Lucae S, Künzel HE, et al. Changes in the hypothalamic-pituitary-adrenal axis and leptin levels during antidepressant treatment. Neuropsychobiology. 2007;55:28–35. doi: 10.1159/000103573. [DOI] [PubMed] [Google Scholar]
- Horstmann S, Binder EB. Pharmacogenomics of antidepressant drugs. Pharmacol Ther. 2009;124:57–73. doi: 10.1016/j.pharmthera.2009.06.007. [DOI] [PubMed] [Google Scholar]
- Ising M, Lucae S, Binder EB, Bettecken T, Uhr M, Ripke S, et al. A genomewide association study points to multiple loci that predict antidepressant drug treatment outcome in depression. Arch Gen Psychiatry. 2009;66:966–975. doi: 10.1001/archgenpsychiatry.2009.95. [DOI] [PMC free article] [PubMed] [Google Scholar]
- Kloiber S, Ising M, Reppermund S, Horstmann S, Dose T, Majer M, et al. Overweight and obesity affect treatment response in major depression. Biol Psychiatry. 2007;62:321–326. doi: 10.1016/j.biopsych.2006.10.001. [DOI] [PubMed] [Google Scholar]
- Kohli Martin A, Lucae S, Saemann Philipp G, Schmidt Mathias V, Demirkan A, Hek K, et al. The neuronal transporter gene SLC6A15 confers risk to major depression. Neuron. 2011;70:252–265. doi: 10.1016/j.neuron.2011.04.005. [DOI] [PMC free article] [PubMed] [Google Scholar]
- Kraus T, Haack M, Schuld A, Hinze-Selch D, Koethe D, Pollmacher T. Body weight, the tumor necrosis factor system, and leptin production during treatment with mirtazapine or venlafaxine. Pharmacopsychiatry. 2002;35:220–225. doi: 10.1055/s-2002-36390. [DOI] [PubMed] [Google Scholar]
- Lu XY. The leptin hypothesis of depression: a potential link between mood disorders and obesity? Curr Opin Pharmacol. 2007;7:648–652. doi: 10.1016/j.coph.2007.10.010. [DOI] [PMC free article] [PubMed] [Google Scholar]
- Lu XY, Kim CS, Frazer A, Zhang W. Leptin: a potential novel antidepressant. Proc Natl Acad Sci. 2006;103:1593–1598. doi: 10.1073/pnas.0508901103. [DOI] [PMC free article] [PubMed] [Google Scholar]
- Luppino FS, de Wit LM, Bouvy PF, Stijnen T, Cuijpers P, Penninx BWJH, et al. Overweight, obesity, and depression: a systematic review and meta-analysis of longitudinal studies. Arch Gen Psychiatry. 2010;67:220–229. doi: 10.1001/archgenpsychiatry.2010.2. [DOI] [PubMed] [Google Scholar]
- Overall JE, Rhoades HM. Use of the hamilton rating-scale for classification of depressive-disorders. Compr Psychiatry. 1982;23:370–376. doi: 10.1016/0010-440x(82)90087-6. [DOI] [PubMed] [Google Scholar]
- Purcell S, Cherny SS, Sham PC. Genetic power calculator: design of linkage and association genetic mapping studies of complex traits. Bioinformatics. 2003;19:149–150. doi: 10.1093/bioinformatics/19.1.149. [DOI] [PubMed] [Google Scholar]
- Schwartz MW, Woods SC, Porte D, Seeley RJ, Baskin DG. Central nervous system control of food intake. Nature. 2000;404:661–671. doi: 10.1038/35007534. [DOI] [PubMed] [Google Scholar]
- Shanley LJ, Irving AJ, Harvey J. Leptin enhances NMDA receptor function and modulates hippocampal synaptic plasticity. J Neurosci. 2001;21:186RC, 6. doi: 10.1523/JNEUROSCI.21-24-j0001.2001. [DOI] [PMC free article] [PubMed] [Google Scholar]
- Sheline YI, Wang PW, Gado MH, Csernansky JG, Vannier MW. Hippocampal atrophy in recurrent major depression. Proc Natl Acad Sci. 1996;93:3908–3913. doi: 10.1073/pnas.93.9.3908. [DOI] [PMC free article] [PubMed] [Google Scholar]
- Sinton CM, Fitch TE, Gershenfeld HK. The effects of leptin on REM sleep and slow wave deltain rats are reversed by food deprivation. J Sleep Res. 1999;8:197–203. doi: 10.1046/j.1365-2869.1999.00158.x. [DOI] [PubMed] [Google Scholar]
- Uher R, Perroud N, Ng MYM, Hauser J, Henigsberg N, Maier W, et al. Genome-wide pharmacogenetics of antidepressant response in the GENDEP project. Am J Psychiatry. 2010;167:555–564. doi: 10.1176/appi.ajp.2009.09070932. [DOI] [PubMed] [Google Scholar]
- Wechsler D. Wechsler Memory Test—German Adaptation. 2000. Revised Version. [Google Scholar]
- Westfall PH, Young S. Resampling-based multiple testing. Wiley; New York: 1993. [Google Scholar]
- Wigginton JE, Cutler DJ, Abecasis GR. A note on exact tests of Hardy–Weinberg equilibrium. Am J Hum Genet. 2005;76:887–893. doi: 10.1086/429864. [DOI] [PMC free article] [PubMed] [Google Scholar]
- Wittchen HU, Höfler M, Gander F. Screening for mental disorders: performance of the Composite International Diagnostic—Screener (CID-S) Methods Psychiatr Res. 1999:59–79. [Google Scholar]
- Yu WH, Kimura M, Walczewska A, Karanth S, McCann SM. Role of leptin in hypothalamic-pituitary function. Proc Natl Acad Sci USA. 1997;94:1023–1028. doi: 10.1073/pnas.94.3.1023. [DOI] [PMC free article] [PubMed] [Google Scholar]
- Zhang Y, Proenca R, Maffei M, Barone M, Leopold L, Friedman JM. Positional cloning of the mouse obese gene and its human homologue. Nature. 1994;372:425. doi: 10.1038/372425a0. [DOI] [PubMed] [Google Scholar]
- Zihl J, Gron G, Brunnauer A. Cognitive deficits in schizophrenia and affective disorders: evidence for a final common pathway disorder. Acta Psychiatr Scand. 1998;97:351–357. doi: 10.1111/j.1600-0447.1998.tb10014.x. [DOI] [PubMed] [Google Scholar]
- Zimmermann U, Kraus T, Himmerich H, Schuld A, Pollmacher T. Epidemiology, implications and mechanisms underlying drug-induced weight gain in psychiatric patients. J Psychiatr Res. 2003;37:193–220. doi: 10.1016/s0022-3956(03)00018-9. [DOI] [PubMed] [Google Scholar]
Associated Data
This section collects any data citations, data availability statements, or supplementary materials included in this article.