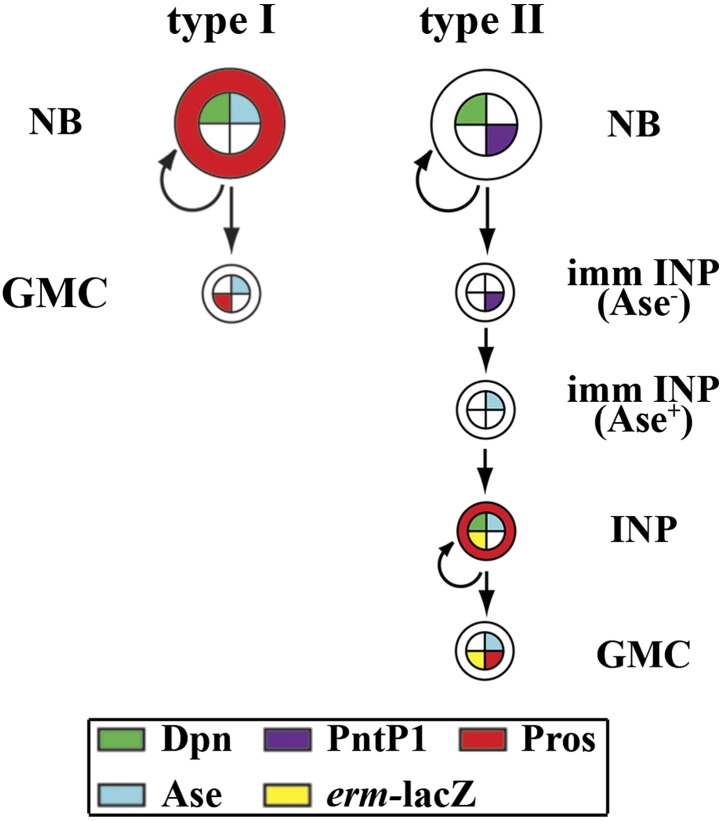
Figure 1. trx mutant type II neuroblasts display characteristics of a type I neuroblast.
Key for all figures: all clones are outlined in yellow. Wild-type type II neuroblasts or mutant type I neuroblasts (Dpn+Ase−Pros−; white arrow); Ase− immature INPs (Dpn−Ase−Pros−; white arrowhead); Ase+ immature INPs (Dpn−Ase+Pros−; yellow arrow); INPs (Dpn+Ase+erm-lacZ+Proscytoplasmic; yellow arrowhead); GMC generated by INPs (Ase+erm-lacZ+Prosnuclear; orange arrow); wild-type type I neuroblasts or mutant type II neuroblasts (Dpn+Ase+Proscytoplasmic; magenta arrow); GMC generated by wild-type type I neuroblasts or mutant type II neuroblasts (Ase+Pros+erm-lacZ−; magenta arrowhead). Single asterisks indicate a statistically significant (p-value <0.05) difference between the marked genotype and the control genotype in the same bar graph, as determined by the Student's t-test. n.s. indicates that the difference is statistically insignificant. NB: neuroblast. (A–D) trx mutant type II neuroblasts progressively acquire a type I neuroblast identity. (A–B) In the 72-hr GFP-marked clone, a wild-type type II neuroblast displays a Dpn+Ase− marker expression profile whereas a trx mutant type II neuroblast displays a Dpn+Ase+ expression profile. Scale bar, 10 μm. (C) Three-dimensionally reconstructed images of type II neuroblasts clones of the indicated genotypes. Scale bar, 10 μm. (D) The frequency of trx mutant type II neuroblasts displaying a type I neuroblast maker expression profile (PntP1−Ase+). N = 10 per time point. (E–H) trx mutant type II neuroblasts lose the ability to generate INPs. (E) The average number of INPs per staged type II neuroblast clone of the indicated genotype. N = 10 per time point. (F–G) In the 72-hr GFP-marked clones, a wild-type type II neuroblast is surrounded by INPs and their GMC progeny identified by erm-lacZ expression. In contrast, a trx mutant type II neuroblast is surrounded by GMCs that are directly derived from neuroblasts and lack erm-lacZ expression. Scale bar, 10 μm. (H) The average number of GMCs with or without erm-lacZ expression per type II neuroblast clone of the indicated genotypes.


