

Abstract
Odour perception depends closely on nutritional status, in animals as in humans. Insulin, the principal anorectic hormone, appears to be one of the major candidates for ensuring the link between olfactory abilities and nutritional status, by modifying processing in the olfactory bulb (OB), one of its main central targets. The present study investigates whether and how insulin can act in OB, by evaluating its action on the main output neurons activities, mitral cells (MCs), in acute rat OB slices. Insulin was found to act at two OB network levels: (1) on MCs, by increasing their excitability, probably by inhibiting two voltage-gated potassium (K+) channels; (2) on interneurons by modifying the GABAergic and on glutamatergic synaptic activity impinging on MCs, mainly reducing them. Insulin also altered the olfactory nerve (ON)-evoked excitatory postsynaptic currents in 60% of MCs. Insulin decreased or increased the ON-evoked responses in equal proportion and the direction of its effect depended on the initial neuron ON-evoked firing rate. Indeed, insulin tended to decrease the high and to increase the low ON-evoked firing rates, thereby reducing inter-MC response firing variability. Therefore, the effects of insulin on the evoked firing rates were not carried out indiscriminately in the MC population. By constructing a mathematical model, the impact of insulin complex effects on OB was assessed at the population activity level. The model shows that the reduction of variability across cells could affect MC detection and discrimination abilities, mainly by decreasing and, less frequently, increasing them, depending on odour quality. Thus, as previously proposed, this differential action of insulin on MCs across odours would allow this hormone to put the olfactory function under feeding signal control, given the discerning valence of an odour as a function of nutritional status.
Key points
Olfactory function is largely under metabolic influence.
Insulin, one of the major players between food intake and energy balance, is known to act at both central and peripheral levels.
The present study assesses the action of insulin in olfactory bulb slices by using patch-clamp recordings in young rats.
The results show that insulin can alter both spontaneous and olfactory nerve-induced firing activities in most of the main ouput neurons, this action being differentially exerted in two opposite directions.
A mathematical model demonstrates that insulin, by acting in this way, could impact odour detection and discrimination mechanisms. Such an impact could be hypothesized as being exerted according to pertinent ecological characteristics, such as the alimentary/ethological valence of odour.
Introduction
Olfaction is an integral part of feeding behaviour, the food detection and initial assessment of its palatability, throughout consumption (Yeomans, 2006). In turn, metabolic status modulates olfactory perception, and odour detection abilities were shown to increase with fasting and decrease with satiety (Aimé et al. 2007).
Several metabolic hormones link the olfactory capabilities and nutritional states (for a review, see Palouzier-Paulignan et al. 2012). For examples, orexin, a peptide triggering hunger, increases rat olfactory sensitivity (Julliard et al. 2007) and modulates the olfactory bulb (OB) main neuron's excitability (Hardy et al. 2005) while insulin, a peptide triggering satiation, reduces olfactory performance in humans (Ketterer et al. 2011; Brunner et al. 2013) and rats (Julliard et al. 2007; Aimé et al. 2012) and reduces the response of sensory neurons to odours when it is experimentally applied on the olfactory mucosa (Lacroix et al. 2008; Savigner et al. 2009).
The mechanisms by which insulin affects olfactory perception are currently unknown. Insulin is known to be involved in various processes, including energy homeostasis and cognition (Gerozissis, 2003; Williams et al. 2011; Sohn et al. 2013), by acting on receptors that are widely distributed in the CNS, most notably the hypothalamus, olfactory epithelium and OB (Hill et al. 1986; Unger et al. 1989; Marks et al. 1990, 2009; Lacroix et al. 2008; Aimé et al. 2012). Noteworthy is that OB contains the highest level of insulin (Baskin et al. 1983) and displays the highest insulin transport rate of the entire brain (Banks et al. 1999), suggesting that insulin could play a role in olfactory processing from the early stages of the olfactory system. Furthermore, in classic in vivo studies, insulin was reported as modifying mitral cell (MC) responses evoked by odour (Pager et al. 1972; Cain, 1975). At that time, insulin was proposed to act through centrifugal afferents coming from the hypothalamus rather than acting directly on the OB. However, recent discoveries have challenged this view. In particular, in vitro studies have shown that insulin's action on MCs results in phosphorylation of Kv1.3 channels, reducing their activity (Fadool & Levitan, 1998; Fadool et al. 2000, 2011). These data suggest strongly insulin has a key role in OB olfactory processing.
The present study aimed to investigate whether and how insulin can modify the OB coding properties. To do so, the action of insulin was assessed on MC electrophysiological responses in OB acute slices. The results show that insulin affects MC activity by altering spontaneous activity, biophysical membrane properties and the efficacy of the synaptic inputs. Together, these effects lead to complex changes of MC firing in response to olfactory nerve (ON) stimulation. The electrophysiological effects of insulin were incorporated into a model of MC population activity and this model was used to predict the effects of insulin on population coding. By doing so, insulin could be proposed as differentially impacting both odour detection and qualitative discrimination, either by improving or by impairing these mechanisms. This differential impact would depend on odour quality and is proposed to be exerted on the basis of the alimentary/ethological valence of odour.
Methods
Animal handling was conducted in accordance with the European Community Council Directive 86/609/EEC. Experiments were performed on postnatal day (P)15–25 male Wistar rats (Janvier, Le Genest-Saint-Isle, France). The animals were maintained on a normal light cycle. In mammals, severe physiological changes are associated with the weaning period (Ktorza et al. 1985; Ferré et al. 1986). Thus, to ensure the homogeneity of their diet, only breast-feeding P15–P25 rats were used; the young rats were kept in the same cage as their mother to delay weaning by a few days.
Slice preparation
Animals were anaesthetised with an intraperitoneal injection of ketamine (50 mg ml−1) and decapitated. The head was quickly immersed in ice-cold (2–4°C) artificial cerebrospinal fluid (ACSF; composition in mm: 125 NaCl, 4 KCl, 25 NaHCO3, 2 CaCl2, 1.25 NaH2PO4, 1 MgCl2, 5.5 glucose; pH 7.4, Sigma Aldrich, France) oxygenated with 95% O2/5% CO2. Osmolarity was adjusted to 320 mOsm with sucrose. OBs were removed as previously described (Palouzier-Paulignan et al. 2002) and cut in sagittal or horizontal slices (250–400 μm thick) using a Leica VT1000s vibratome (Leica Biosystems, Wetzlar, Germany). Slices were incubated in a Gibb's chamber at 32°C for 1 h and then at room temperature for the remaining time (25 ± 2°C).
Electrophysiological recordings
Slices were transferred to a recording chamber mounted on an upright microscope (Axioskop FS, Zeiss, Oberkochen, Germany) and were continuously perfused with oxygenated ACSF (4 ml min−1) at 32°C. Neurons were visualised using a 40× objective with differential interference contrast optics (Nomarski) or infrared illumination (Hamamatsu camera). Measurements were performed with an RK 400 amplifier (BioLogic, France). Data were acquired on a PC-Pentium D computer using a 12-bit A/D-D/A converter (Digidata 1440A, Axon Instruments, Union City, CA, USA) and PClamp10 software (Axon Instruments). Junction potential and leak current were corrected offline. Various patch-clamp configurations were achieved with borosilicate pipettes (o.d.: 1.5 mm; i.d.: 1.17 mm; Clark Electro-Medical Instruments, Pangbourne, UK). For cell-attached mode, the recording pipette was filled with extracellular medium. For whole cell experiments, the intracellular solution was composed of (in mm): 135 caesium gluconate, 10 KCl, 10 Hepes, 1 EGTA, 0.1 CaCl2, 2 MgATP and 0.4 GTP-Na3, adjusted with 1 m CsOH to pH 7.3. Osmolarity was 290 mOsm, and ECl was −85 mV under our conditions. For perforated patch-clamp recordings, amphotericin B (3 mg/50 μl dimethylsulphoxide, final concentration: 130 μm) was added to the following intracellular medium (composition in mm): 121 KMeSO4, 13.5 KCl, 10 Hepes, 1 MgCl2, 0.5 CaCl2 and 5 EGTA; 310 mOsm adjusted with 1 m KCl to pH 7.3. The pipettes had a tip resistance of 3–5 MΩ, and the seal resistance was always greater than 2 GΩ. Under perforated-patch configurations, series resistance was approximately 18 MΩ. In experiments where ON was stimulated, a bipolar concentric electrode was placed on the most external layer of the OB, near the recorded MC, and monophasic square pulses (100 μs) were delivered through a stimulus isolation unit.
Insulin (human recombinant insulin, Sigma, St Louis, MO, USA) was used at 1 μg ml−1 (172 nm). This concentration does not interact with insulin-like growth factor pathways in OB neurons in vitro (Fadool et al. 2000; Colley et al. 2004). The hormone was dissolved in ACSF and bath perfused over the entire slice preparation. Because, in such an application protocol, insulin was reported as being non-reversible with washout of the drug (Fadool et al. 2011), a single MC per slice was recorded.
To analyse the synaptic currents, receptor antagonists were diluted in the physiological medium. GABAA receptors were blocked with gabazine (10 μm, Tocris Bioscience, Bristol, UK) or (−)-bicuculline (10 μm, Tocris Bioscience). N-Methyl-d-aspartate (NMDA)-type ionotropic glutamate receptors were blocked with 50 μm d-(−)-2-amino-5-phosphonopentanoic acid (APV; Tocris Bioscience), and α-amino-3-hydroxy-5-methyl-ioxazole-4-propionic acid (AMPA)-type receptors were blocked with 10 μm 2,3-dioxo-6-nitro-1,2,3,4-tetrahydrobenzo[f]quinoxaline-7-sulfonamide (NBQX; Tocris Bioscience).
For the voltage clamp studies of K+ currents, the recorded cells were synaptically isolated via the perfusion of calcium-free ACSF solution composed of (in mm): 125 NaCl, 4 KCl, 25 NaHCO3, 1.25 NaH2PO4, 1 MgCl2 and 5.5 glucose; pH 7.4. Moreover, INa, ICa and IK-Ca were blocked with the Na+ channel blocker tetrodotoxin (TTX, 1 μm; ACROS, Waltham, MA, USA) and the Ca2+ channel blocker EGTA (0.5 mm). To isolate IKDR and IA currents from each other, 4-aminopyridine (4-AP, 4 mm; Sigma-Aldrich) and tetra-ethylammonium (TEA, 25 or 5 mm; Sigma-Aldrich) were used, respectively.
Data analysis
Firing properties were analysed using Open Electrophy (Garcia & Fourcaud-Trocme, 2009), SciPy and MySql database programs (open source licences). The distribution of inter-spike intervals (ISIs) was characterised 3 min prior to the application of hormone (control) and midway through the perfusion of insulin (between the 4th and 7th min). The effect of insulin was correlated with the distance (D) between both of the empirically determined cumulative ISI distributions (control and insulin): accelerated firing resulted in a positive D value (i.e. the ISI distribution during the perfusion of insulin was shifted to the left) and decelerated firing a negative value (shift to the right). The hormone was considered to modulate the discharge of a cell when  >0.1 and **P < 0.01 or ***P < 0.001 (two-sample Kolmogorov–Smirnov test).
Spontaneous GABAergic activity was recorded at a holding potential of −5 mV as outward currents; spontaneous glutamatergic activity was recorded at a holding potential of −85 mV (i.e. ECl) as inward currents. Analysis of the spontaneous events, including the inter-event interval (IEI), amplitude and charge, was performed using Mini Analysis software (Synaptosoft, ver. 6.07). ON-evoked postsynaptic currents (eEPSCs) were analysed using Clampfit10 software (Axon Instruments). Only neurons displaying stable access and membrane resistances (< 20% changes) were included in the analysis.
K+ currents were analysed using Clampfit10 software (Axon Instruments). For IA, voltage dependency was determined by converting the peak current to a conductance, assuming EK = −92.3 mV (as calculated for our conditions). The resulting g V−1 curves were fitted with first-order (inactivation) and second-order (activation) Boltzmann equations.
Statistical comparisons were performed using various non-parametric tests: the Mann–Whitney test for independent samples, the Wilcoxon signed-rank test for paired samples and the Kolmogorov–Smirnov test for distributions. Fisher's exact test was used for contingency analysis, and the Pearson test for correlations. For all tests, asterisks indicated *P < 0.05, **P < 0.01 and ***P < 0.001.
ON-evoked activity analysis
In experiments in cell attached mode with ON stimulation, the effect of insulin was assessed by analysing four parameters: baseline firing rate and ISI distribution, delay of first evoked spikes, duration of first and second evoked ISIs, and average evoked firing rate (during the whole response window following ON stimulation). For each cell, all four parameters were simultaneously analysed over trials. Analysis of activity in the insulin period started as soon as at least one of the parameters showed a stationary change, as compared to control conditions. More than one parameter could be affected by insulin, but in all recordings except one multiple changes started at the same time. Based on these observations, the average delay for insulin stationary effects was 2.5 min (SD 1.1 min, range 1–5 min). In 5/31 cells, there was no clear-cut effect and the analysis was thus started after a 2.5 min delay. The ON response analyses were based on the firing rate computation performed on the 5 s prior to ON stimulation for spontaneous firing, and the first 200 ms after ON stimulation for evoked firing. We checked that using a 100 or 400 ms window for evoked firing computation did not change the results. For the spontaneous firing computation, we checked the values obtained from the 5 s prior to stimulation were similar to those obtained from long spontaneous activity recordings by estimating the effect of insulin using either average firing rate or ISIs. The Wilcoxon signed-rank test for paired samples (P < 0.05) was used on the one hand to test the effect of insulin on spontaneous and evoked MC firing rates and, on the other, to evaluate the difference between the evoked and spontaneous firing rates of each individual cell.
Population activity model, construction and analysis
Because by looking at the single cell level, insulin induced complex effects, a population model of coding was designed to extrapolate the effect of insulin on OB main odour processes, namely odour detection and discrimination. The basic premise was that the OB information is contained in the firing rates of MCs. In the operating OB, odour stimuli are encoded through a specific combination of activated MCs (Duchamp & Sicard, 1984). The model thus defined theoretical odours by randomly allocating different MC combinations to different theoretical odours. The effect of insulin on OB processing was then evaluated by comparing the mathematical distances, in control and under insulin, between spontaneous and evoked population activities, for each theoretical odour (detection), and evoked population activities between pairs of odours (discrimination).
Individual cell activity was taken from the ON stimulation experiments (31 MCs). For each cell, the spontaneous and evoked firing rates during control ( ) and during the application of insulin
  were calculated.
The two population rate vectors during the spontaneous state under control (S) and insulin (Sins) conditions were then defined respectively as:
The theoretical odour responses were, as mentioned above, constructed by combining the responses to ON stimulation of a subset of MCs comprising 10–30% of the recorded cells. In the model, MCs were assumed to be connected to distinct glomeruli and, thus, to be independently activated by each of the theoretical odours. Thus, 200 random subsets of MCs were allocated to 200 odours, these ensuring a representative view of the population response to odours. For each theoretical odour, the two odour-evoked population rate vectors, under control (Oi) and insulin (Oi,ins) conditions, were defined as:
where  if cell j was not activated by odour i, and
  if cell j was activated,
where  or
or  , depending on whether cell j was activated or not by odour i.
Once the odour-evoked population rate vectors were defined, odour detection was estimated by computing the Euclidian distance between the population rate vectors S and Oi for each odour i:
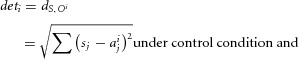 |
 |
The proportion of change in the detection distance of odours was defined as:
Similarly, the effect of insulin on odour discrimination was determined by computing the distance between two distinct odour-evoked population rate vectors:
The proportion of change in the discrimination distance of odours was defined as:
Two types of surrogate data were generated to statistically assess the robustness of the model. The first type aimed at cancelling any effect of insulin without affecting other features of neuronal firing. It was constructed by randomly shuffling, for each cell, the control and insulin trials before computing spontaneous or evoked firing rates. The second type of surrogate data aimed at removing any correlation, at the population level, between the changes of evoked firing rates induced by insulin and the control evoked firing rates. For this, the changes of average evoked firing rate induced by insulin were computed for each cell but then randomly shuffled across the cells. Note that this shuffling can lead to non-physiological negative firing rates if a large negative change is randomly attributed to a low control evoked firing rate. However, this did not affect the way the model was constructed and was used only to assess the effect of the destroyed correlation on model output.
Results
Insulin increased the spontaneous firing in most MCs
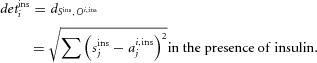
MC spontaneous activity was recorded in cell-attached configuration. Taking the cell population as a whole, insulin significantly altered spontaneous firing rate in 91.5% of MCs (n = 24). Insulin increased the spontaneous firing rate in 62.5% of MCs (n = 15/24, P < 0.001, Kolmogorov–Smirnov test) but decreased it in 29% of MCs (n = 7/24, P < 0.001, Kolmogorov–Smirnov test). Figure 1A exemplifies the main observed effects. Depending to the neuron, insulin increased the firing (Fig. 1Aa), which shifted the ISI distribution to the left (Fig. 1Ab, P < 0.001, Kolmogorov–Smirnov test), or inversely decreased the firing (Fig. 1Ba), which shifted the ISI distribution to the right (Fig. 1Bb, P < 0.001, Kolmogorov–Smirnov test). The distance (D) between the control and insulin distributions was quantified. By convention a positive D value represents a left shift (in Fig. 1Ab, D = 0.47) whereas a negative ‘D’ value, a right shift (in Fig. 1Bb, D = −0.54). Figure 1C synthesizes the insulin effect on the ISI distributions for all recorded cells (n = 24). Note that before insulin application, MCs showed a stable spontaneous activity, i.e. no shift of ISI distribution.
Figure 1. Insulin affects MC spontaneous firing with a prevailing excitatory effect.
Examples of MC spontaneous firing, which was increased (A) or decreased (B) by the perfusion of insulin. Aa and Ba, electrophysiological traces recorded in control (CTR) conditions and during insulin perfusion. Ab and Bb, cumulative probabilities of inter-spike intervals (ISIs) calculated over 3 min in the control condition (dashed line) and during insulin application (continuous line). For cell A, the ISI distribution was significantly shifted to the left. This shift was quantified by a positive D (distance between the control and insulin distributions), reflecting a firing increase. For cell B, the ISI distribution is shifted to the right and quantified by a negative D, indicating a firing decrease. A Kolmogorov–Smirnov test indicated that the CTR and insulin ISI distributions are significantly different (***P < 0.001). C, distance (D) between the ISI distributions of each recorded MC. A given cell was considered to be modulated by insulin when  >0.1 and **P < 0.01 or ***P < 0.001 (Kolmogorov–Smirnov test); n.s., not significant.
There is no correlation between D and the firing frequency measured before the perfusion of insulin (correlation coefficient R2 = 0.0013, P = 0.869, Pearson correlation), and thus the changes of spontaneous MC activity induced by insulin did not depend on the neuron initial firing rate. There was no link between the type of insulin effect on spontaneous firing rate and the animal, its age or the moment of MC recording (data not shown).
The excitatory effect of insulin on spontaneous MC firing could be ascribed to the inhibition of their voltage-gated K+ currents
A previous report shows that insulin can increase the excitability of MCs in adult mice by reducing voltage-gated potassium currents (Fadool et al. 2011). Therefore, the increase in spontaneous firing observed here in young rat MCs was checked as being attributable to inhibition of the potassium current.
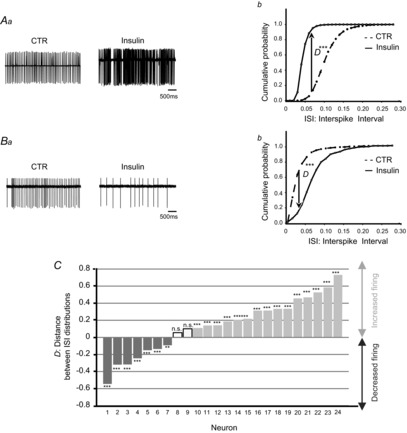
The effect of insulin on MC spontaneous firing was analysed while slices were perfused with voltage-gated K+ channel blockers (4 mm 4-AP and 25 mm TEA). In this condition, the proportion of MCs for which spontaneous activity was affected by insulin decreased significantly (Fig. 2; P = 0.00026, Fisher's exact test) as it affected only 25% (n = 8), versus 91.5 % (n = 24) in control. Moreover insulin-induced changes were restricted to one direction: the decrease in spontaneous firing rate. Thus, K+ channel blockers impaired the excitatory effect of insulin but did not change the proportion of MCs inhibited by insulin (33%, n = 3/9 under blockers, 29%; n = 7/24 in control). Note that the impairment of the excitatory action cannot be ascribed to a ceiling effect due to the increase of basal firing rate (5.49 ± 0.95 Hz, n = 9) produced by the K+ channel blockers, as a similar basal firing rate was observed in the presence of bicuculline (8.94 ± 1.38 Hz, n = 22; P = 0.147, Mann–Whitney test), a condition in which an excitatory action of insulin was still present (see later).
Figure 2. The excitatory action of insulin on spontaneous MC firing disappears in the presence of K+ channel blockers.
A, distance between the ISI distributions (with and without insulin) recorded in the presence of K+ channel blockers (4 mm 4-AP and 25 mm TEA). Discharge of a cell was considered to be modulated by insulin when  >0.1 and ***P < 0.001 (Kolmogorov–Smirnov test); n.s., not significant. B, distribution of the effect of insulin on the MC population tested in the control condition (CTR) is different from that observed in the presence of K+ channel blockers (**P = 0.00026, Fisher's exact test). Indeed, no cell was excited in the presence of K+ channel blockers, compared with 62.5% excited cells in the control condition (n = 15/24 with positive D; Fig. 1B).
The action of insulin on the classically described K+ currents, in MCs, the transient 4AP-sensitive currents (which comprise Kv1.3, the main inactivating potassium channel targeted (Fadool et al. 2011) but also Kv4.x channels) and the sustained TEA-sensitive currents (Wang et al. 1996; Christie & Westbrook, 2003), was investigated further. MCs were recorded in perforated-patch configuration in calcium-free TTX/EGTA solution and experimentally depolarised (from −90 to +40 mV) to elicit an outward current comprising two components: one transient component followed by one sustained component. The transient component was suppressed by the application of 4-AP (Fig. 3A), while the sustained one was suppressed by the application of TEA (Fig. 4A), this suppression being demonstrated by a subtraction protocol (Fig. 4B).
Figure 3. Insulin reduces the sustained component of the voltage-activated K+ currents.
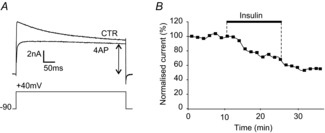
A, example of an outward current recorded from one MC stimulated by a depolarising step (from −90 to +40 mV), showing that the addition of 4-AP isolated the sustained component from the global K+ current evoked in the control condition (CTR, calcium-free TTX/EGTA). The magnitude of the sustained K+ current was measured at steady state (arrow). B, in this MC, the K+ current was monitored by repeating this protocol every 1.5 min, and the magnitude of the slow K+ current was normalised to the mean of the control values.
Figure 4. Insulin reduces the transient component of the voltage-activated K+ currents.
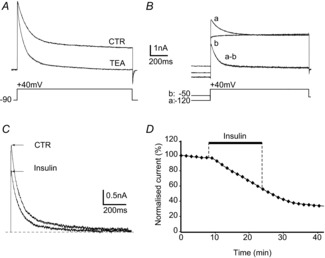
A, example of one MC stimulated by a depolarising step (from −90 to +40 mV); the addition of TEA to the perfusate isolated the transient component of the global K+ current recorded under control conditions (calcium-free TTX/EGTA, CTR). This transient component exhibited an inactivation constant of τ = 93.7 ms. B, the step subtraction protocol was applied under calcium-free TTX/EGTA conditions. Two voltage steps were successively delivered. The first step, from −120 to +40 mV, activated the global K+ current (a). The second step, from −50 to +40 mV, activated the sustained K+ current (b). Thus, the subtraction of b from a revealed the transient K+ current, which displayed a characteristic inactivation constant of τ = 101.3 ms. C and D, the inhibitory effect of insulin on transient K+ currents, for one cell, using the step-subtraction protocol. IA was monitored every 1.5 min, and the current magnitude measured under insulin perfusion was normalised to the mean of the control values.
The magnitude of the sustained K+ current was measured at steady state during the control, insulin and washout periods (exemplified for one cell, Fig. 3B). A significant reduction of 61.5 ± 14% as compared to the control value (P < 0.001, Wilcoxon test) was observed in 75% of the cells (n = 12/16).
Two protocols were used to isolate the rapidly inactivated component from the sustained component (Grissmer et al. 1994), namely a bath application of 25 mm TEA (Fig. 4A) or a step subtraction protocol (Fig. 4B). An inactivation constant τ less than 100 ms characterised the remaining rapidly inactivated K+ current, the magnitude of which was measured at its peak (Fig. 4C). Figure 4D illustrates the evolution of the magnitude of the rapidly inactivated K+ current during the control, insulin and washout periods in one cell. In 75% of the MCs (n = 9/12), insulin significantly reduced the transient current to 50.7 ± 18.8% (P < 0.005; Wilcoxon test).
Together, these results showed that insulin reduced two voltage-gated K+ currents in a subpopulation of MCs (75%); such an action would support the spontaneous firing increase, observed in 62.5% of the MCs, in control.
The inhibitory effect of insulin on spontaneous MC firing was mainly GABAA dependent
GABAergic involvement on the inhibitory action of insulin on MCs was studied in OB slices free of the influence of GABAA receptors, through the bath application of gabazine or bicuculline. In these conditions, insulin reduced the spontaneous firing rate in only 4.5% of MCs (n = 1/22; Fig. 5A, P < 0.001, Kolmogorov–Smirnov test), a value significantly different from the 29% observed in control experiments (P = 0.0296, Fisher's exact test, Fig. 5B). Differently, insulin still increased the spontaneous firing rate in 63.5% of MCs (n = 14/22), this proportion being very close to that observed in control (62.5%). These results suggest that the inhibitory effect of insulin on MC spontaneous firing rate is indirect and depends on GABAA transmission.
Figure 5. Inhibitory action of insulin on spontaneous MC firing is reduced in the absence of GABAergic transmission.
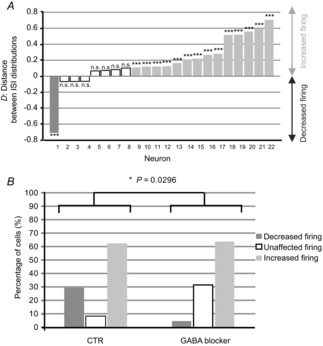
A, distance between ISI distributions (with and without insulin) recorded in the presence of a GABAA receptor antagonist (bicuculline or gabazine). The discharge of a cell was considered to be modified by insulin when  >0.1 and ***P < 0.001 (Kolmogorov–Smirnov test); n.s., not significant. B, the repartition of insulin effect among the MCs tested under control conditions (CTR) was different from that observed in the presence of a GABAA receptor antagonist (*P = 0.0296, Fisher's exact test). Indeed, only 4.55% of cells were inhibited by insulin (n = 1/22) in the presence of a GABAA receptor antagonist, compared with 29.17% in the control condition (n = 7/24 with negative D, Fig. 1B).
The involvement of GABAA transmission was further validated by analysing the effect of insulin on the spontaneous inhibitory synaptic activity impinging on MCs. Spontaneous GABAergic inhibitory postsynaptic currents (sIPSCs) were recorded at a −5 mV holding potential, as outward currents (sIPSC mean frequency 7.6 ± 5 Hz, range 1.4–16 Hz; n = 9; Fig. 6A, inset). sIPSC activity was checked as being completely abolished by gabazine (Fig. 6A, inset). The average sIPSC activity was altered by insulin given that the latter significantly reduced sGABA-IPSC amplitude (−7 ± 3.8% of variation, n = 9, P = 0.017, Wilcoxon test; Fig. 6A inset and Fig. 6Aa), whereas the sGABA-IPSC IEI was not significantly altered (IEI; 6 ± 10% of variation, n = 9, P = 0.78, Wilcoxon test, Fig. 6Ab).
Figure 6. Insulin differentially modulates sGABA-IPSCs according to the examined MC, with a prevailing inhibitory effect.
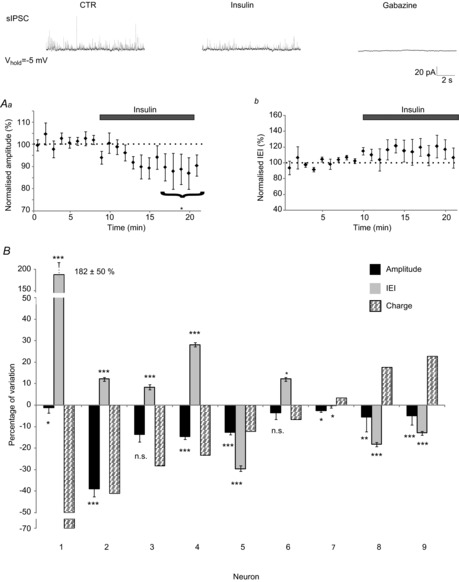
A, time plots of normalised (a) amplitude and (b) inter-event interval (IEI) of the average of the sGABA-IPSCs recorded from all MCs under control conditions and during the perfusion of insulin (n = 9, mean ± SEM; inset: representative traces). As a whole, the perfusion of insulin reduced the amplitude (*P < 0.05, Wilcoxon test) whereas it did not significantly modify the IEI of sGABA-IPSCs. B, the effects of insulin detailed for each MC (% variation compared with the control period), on amplitude (black bars), IEI (grey bars) and GABAergic charge (hatched bars) revealed a complex action on amplitude and IEI (*P < 0.05, **P < 0.01, ***P < 0.001, n.s., not significant; Kolmogorov–Smirnov test). Resulting from the action of insulin, the inhibitory charge was reduced in six neurons (n = 6/9; 66%) and increased in the remaining neurons (n = 3/9; 33%).
The inhibitory charge received by the MCs was calculated by combining the effects of insulin on amplitude and IEI for each recorded neuron (Fig. 6B). Under insulin, the inhibitory charge decreased in 6/9 MCs (66%) and increased in the remaining 3 (33%). The increase of GABAergic charge in a subpopulation of the MCs (33%) could be proposed as accounting for the MC subpopulation (29%) where insulin did not reduce spontaneous firing (Fig. 1B). This hypothesis is reinforced by the observation that GABAergic impact on MC firing increased in neurons in which insulin exerted a depressing action (Fig. 7).
Figure 7. Insulin increases the GABAergic impact on MC firing in neurons in which insulin has an inhibitory effect.
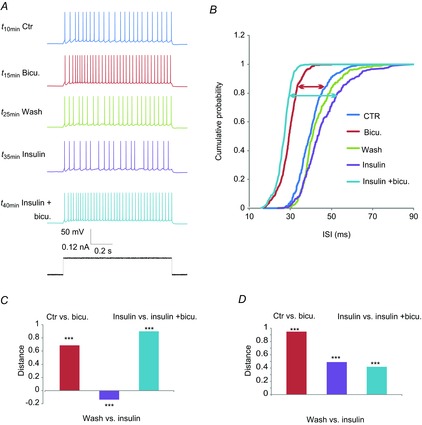
A, example of MC firing evoked by a depolarising step in different conditions. Bicuculline (Bicu., 10 μm) increases the firing, indicating the inhibitory impact of the GABAergic transmission on MC. Applied alone, insulin decreases firing in this specific MC, while co-applied with bicucculline, it increases the GABAergic impact. B, corresponding ISI cumulative distributions of the MC firings obtained in the different conditions. The red arrow highlights the shift of the control distribution produced by bicucculline. The turquoise-blue arrow points to the opposite shifts of the distribution induced by insulin applied alone or with bicucculline. C, corresponding distances between the distributions in the different conditions. Insulin has an inhibitory action (negative distance value). Note that the distance produced by bicucculline, i.e. the GABAergic inhibition, is increased in the presence of insulin compared to the control condition, *** P < 0.001. D, example of an MC in which insulin has an excitatory action characterized by a positive shift of the distance distribution. Note that in this MC, the GABAergic inhibition is significantly reduced in the presence of insulin compared to the control condition, *** P < 0.001.
Insulin altered EPSCs and spike response evoked by ON stimulation
The effect of insulin was first tested on ON-evoked eEPSCs, MCs being held at −85 mV (i.e. ECl). Here, insulin perfusion rapidly reduced the eEPSCs evoked by ON stimulation (Fig. 8A). This reduction was significant in 8/9 neurons (89%; P < 0.001, Wilcoxon test; Fig. 8B), the mean eEPSC amplitude being 69 ± 9% of the control (n = 9, P < 0.05, Wilcoxon test; Fig. 8B). In four of the recorded MCs EPSC activity was checked to be completely abolished by NBQX+APV.
Figure 8. Insulin reduces EPSCs evoked by ON stimulation.
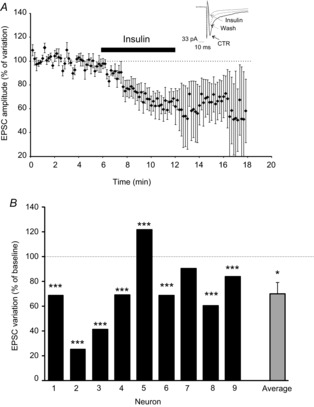
A, time plot of eEPSC amplitude under control, insulin and washout conditions. Inset: corresponding representative traces of eEPSCs; noted that for the exemplified MC a partial recovery after washout was observed. B, variation in eEPSC amplitude during the perfusion of insulin (compared to the control amplitude) in each recorded MC. Insulin significantly reduced the eEPSC amplitude for the majority of the recorded MCs (n = 7/9, *P < 0.05, ***P < 0.001, Wilcoxon test). Error bars represents SEM.
The next step was to examine how the combination of the insulin effect on synaptic transmission and intrinsic electrical properties could affect MC spike responses to ON stimulations. To do so, MCs, recorded in cell-attached configuration, were stimulated through the ON (one stimulation every 20 s). Insulin significantly decreased MC-evoked firing activity in 9/31 MCs (29%) and increased it in 12/31 MCs (39%; Fig. 9Aa, upper graph). Besides, as observed above, spontaneous activity increased in 13/31 (42%) or decreased in 2/31 (7%) of MCs (Fig. 9Aa, middle graph). Here again, we checked that there was no link between the type of insulin effect on evoked firing rate and the animal, its age or the moment of MC recording (data not shown). Through these simultaneous changes of MC spontaneous activity and ON response, insulin is proposed to alter the signal to noise ratio. Thus, Fig. 9A (lower graph) shows that the distance from spontaneous to evoked firing rate was significantly decreased by insulin for 39% of MCs and increased for 29% of MCs. However, because the opposite effects of insulin were again quantitatively balanced, the distances averaged across cells were not significantly changed (Wilcoxon test, P > 0.1, Fig. 9B). Interestingly, when the ON-evoked response under insulin was related to that observed in control, insulin tended to decrease the higher response firing rates, while increasing the lower rates (Fig. 9C, upper plot; least-squares linear fitting, slope: −0.31, P < 0.001). A similar tendency is shown through the correlation between the insulin-induced distance modification and the initial distance D (Fig. 9C, lower plot, least-squares linear fitting, slope: −0.28, P < 0.01). In this way, the variability between the MC-evoked firing rates was reduced by insulin while the average population firing rate was not affected. The results indicate that, even if exerted in two opposite directions, the insulin effect was not carried out indiscriminately in the MC population.
Figure 9. Insulin changes the response of MCs to ON stimulation.
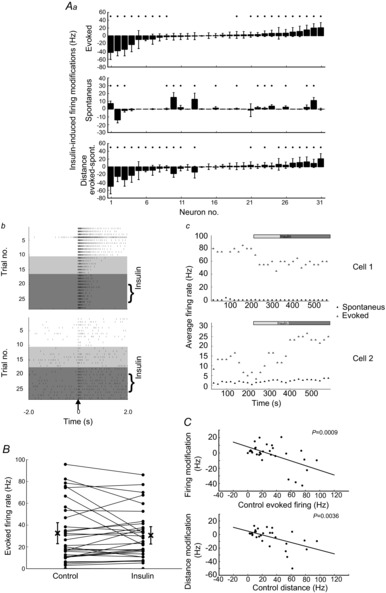
A, effects of insulin on the MC responses produced by ON stimulation (one every 20 s). Aa, insulin modified the frequency of evoked and spontaneous activity and the distance between these parameters, for most of the recorded MCs. Note the heterogeneity of the effects of insulin (*P < 0.05, Wilcoxon test). Ab, raster plots of two representative MC responses in control and insulin conditions (white and grey backgrounds, respectively). Light grey indicates the transition period discarded for the analysis of the effect of insulin. The ON was stimulated at time 0. Ac, temporal plots of the firing frequency (spontaneous and evoked), showing the temporal evolution of the insulin effect for the two neurons exemplified in B. B, modification of the evoked frequency for all MCs tested. Note that the average response (X) of the cell population is not modified. Error bars represent the 95% confidence interval (2× SEM). C, upper plot: correlation between the insulin effect on the evoked response and the magnitude of the evoked response in control conditions. Lower plot: correlation between the insulin-induced modification of distance (between spontaneous and evoked firings) and the distance in control conditions; the correlation is an outcome of the insulin effect on the evoked activity (upper plot, as the insulin effect on spontaneous activity did not depend on the initial condition; not shown). Note that the correlation is reduced by the presence of neurons for which insulin did not modify the evoked activity.
The population activity model provides a tool for understanding the impact of insulin on odour detection and discrimination performances in OB
The OB population model designed was based on spontaneous and evoked firing rates measured in the ON electrical stimulation experiment. It combined results from all MCs, as if they were simultaneously recorded, constituting a virtual population. The was model was built on the following assumptions: first, each recorded MC was connected to a specific OB glomerulus – such an approximation matches the low probability of recording neurons projecting in the same glomerulus (31 MCs recorded for about 2100 possible glomeruli; Royet et al. 1998); second, each MC response to the ON electrical stimulation was assimilated to a response evoked by sensory inputs. Thus, given that the real odours can activate different glomeruli, the theoretical odours were defined as activating a random subset, from 10 to 30%, of the MC virtual population. Together, the odour information in the model is summarized by two types of population firing vectors. The first reflected the spontaneous activity in the absence of odours (pre-odour vector), and was given by the concatenation of all MC spontaneous firing rates. The second, different for each theoretical odour, reflected evoked activity (odour vector), and was obtained by the concatenation of the evoked firing rates of MCs in combination allocated to each theoretical odour, and of the spontaneous firing rates of non-activated MCs. By doing so, the model generated 200 distinct random odour vectors (see Methods).
The OB network was assumed to detect odours by assessing the difference between the odour (signal) and the pre-odour (noise) activity of MCs. In the model, such a difference was calculated for each theoretical odour as being the Euclidian distance between the odour and the pre-odour vector. Furthermore, the OB network encodes odour quality throughout specific combinations of excited MCs, discrimination mechanisms being based on differences between these combinations (Duchamp & Sicard, 1984). Therefore, in the model, discrimination between a pair of odours was calculated as the Euclidian distance between their theoretical odour vectors.
The model allowed us to assess the impact of insulin on odour detection and discrimination OB abilities by analysing the changes that insulin induced, in spontaneous and evoked MC activities (Fig. 9A). This was achieved by plotting the distribution of the relative change of detection for all the odours (Fig. 10Aa) or the distribution of the relative change of discrimination between all possible odour pairs (Fig. 10Ab)
Figure 10. Modelling the experimental data suggests that insulin changes the detection and the discrimination capacity of the OB.
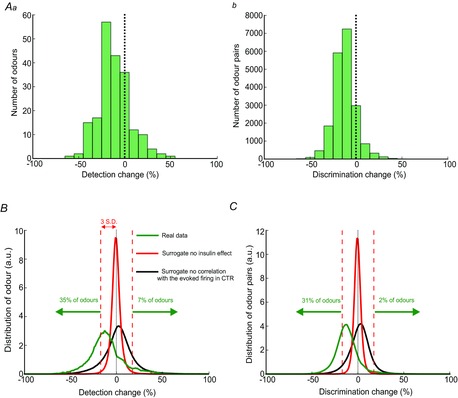
A, modifications produced by insulin on odour detection (a) and discrimination (b) capacities of the network for 200 random virtual odours. B and C, average distributions of insulin-induced modifications, on detection (B, green curve) and discrimination (C, green curve) capacities, produced by running the model 10,000 times. Surrogate distributions produced by shuffling the control and insulin trials (red curves) or by shuffling the evoked firing rate (black curves) show that model-induced changes in the detection and discrimination capacities are due to the insulin effect on MC activity as well as to the correlation of the insulin effect with the initial MC response (as depicted in Fig. 8C). Note that the percentages of odours under and over the 3 SD of the surrogate distributions are considerably higher than expected by chance (i.e.<0.3%). The distributions are normalized to the area of the red curve.
Insulin modified both the detection and the discrimination abilities of the network mainly negatively, as shown by the global shift to the left of the distance–change distributions. To assess the significance of this observation, the model output constructed using the real data was compared with the model outputs using two types of surrogate data obtained by randomly shuffling some features of the real data (see Methods and Fig. 10B and C). The first type of surrogate cancelled any insulin effect, keeping all other aspects of MC firing intact. This surrogate yielded average distributions of changes close to 0 with low variability (red curves in Fig. 10B and C). When comparing the average surrogate distribution with the real data average distribution (green curves in Fig. 10B and C), the latter exceeded the surrogate on both sides (compare green and red curves in Fig. 10B and C). Specifically, the use of a threshold of a 3 SD value around the mean of the surrogate data distribution (eliminating 99.7% of the surrogate data, red dashed lines in Fig. 10B and C) allowed us to neglect those changes that might be due only to noise in the real data. Behind this threshold there was still, in the real data, an increase in detection for 7% of odours and a decrease for 35%. Both values were considerably higher than expected by chance (i.e. <0.3%). For discrimination, there was a 2% increase and 31% decrease. Therefore, the odour detection and discrimination capabilities of the network were either increased or decreased depending on the odour. The wide distributions based on real data could be explained by the large variability in the insulin-induced modification of the evoked responses and insulin-induced changes of distances at the single cell level (see Fig. 9A). However, why there was a shift mainly towards a decrease both for detection and for discrimination is less clear. Insulin reduced the variability of evoked firing rates across the MCs (Fig. 9C). Indeed, a larger variability in space coordinates (individual cell firing rates) induced, on average, larger Euclidian distances. This effect was demonstrated by constructing a second set of surrogate data. The shuffling destroyed the correlation between the insulin-induced changes and the pre-insulin-evoked firing rate shown in Fig. 9C (linear fit slope for the surrogate data: 0 ± 0.1, real data slope: −0.31). The model outputs with this type of surrogate data are shown in Fig. 10B and C (black curve). The resulting average distributions had the same variability as the real data model output, but centred on zero. The Kolmogorov–Smirnov tests between the average distributions or between individual draws demonstrated that the left shift of the real data output is highly significant (P < 0.01). Therefore, the shifts towards a decrease for the detection and discrimination capabilities are the consequences of the reduction in variability of MC-evoked activity, which was induced by insulin.
Overall, the population activity model shows that the opposite effects of insulin on MC population firing were not carried out indiscriminately and would result in a modulation of olfactory perception in two opposite directions, with an emphasis on a reduction of detection and discrimination performances.
Discussion
The results show that insulin modulates spontaneous and electrical evoked activities in most MCs. This strong impact of insulin is exerted on the MC firing patterns elicited by ON stimulation, by interfering with both the MC membrane properties and the synaptic events impinging on them. More precisely, insulin appears to target the MC K+ intrinsic currents, GABAergic inhibitory interneuron network and ON–MC synaptic transmission. Our population rate modelling indicates that the complex action of insulin could impact odour detection and discrimination in opposite directions, depending on the odour quality. Such an OB-differentiated modulation by insulin is fully consistent with the physiological context of food intake (Aimé et al. 2012).
Insulin increases MC excitability by inhibiting their K+ currents
Two mechanisms could account for the increase in MC spontaneous firing (Figs 1 and 9) induced by insulin: a direct effect via the closure of intrinsic voltage-gated K+ channels in MCs and an indirect effect via reduction of their inhibitory input.
The direct effect was described by isolating MCs from the surrounding network. Under this condition, insulin inhibits two native K+ currents: the slow (Fig. 3), presumably ID and IKDR current, and the fast (Fig. 4), putatively IA, current. Such a reduction was observed in 75% of neurons. This proportion is in agreement with the proportion of MCs whose spontaneous firing increased (Figs 1 and 9) in the presence of insulin and suggests that only a subset of MCs would be directly targeted by the hormone. This assumption is consistent with the immunohistochemical study of Aimé et al. (2012), which showed that only a subset of MCs express insulin receptors. According to the roles of IKDR and IA (which promote action potential repolarisation and increase ISIs, respectively), their blockade by insulin is proposed as increasing MC spontaneous firing. This was confirmed by blocking K+ currents, which resulted in the abolition of the insulin excitatory effect on spontaneous discharge (Fig. 2). The excitatory effect of insulin was previously observed by Fadool et al. (2011), who ascribed it to an inhibition of Kv1.3 K+ channels. Because Kv1.3 participates in transient and delayed K+ currents (Coetzee et al. 1999; Song, 2002), the Kv1.3 subunit is hypothesised to be present either alone (homomer) or in combination with other K+ channel subunits (heteromer), within the protein assemblies that form the voltage-gated channels that are responsible for the insulin-modulated native currents.
The indirect action of insulin on MCs was revealed by studying sIPSCs. Insulin was found to modulate, in amplitude and frequency, the GABAergic inputs on MCs (Fig. 6), which resulted in reducing the inhibitory charge in 66% of the MCs (Fig. 6B). However, because the excitatory effect of insulin on the MC spontaneous firing did not significantly change under GABAA receptor antagonists (Fig. 5), the inhibitory charge decrease did not appear to be a determining mechanism involved in the excitatory effect of insulin.
The experimental data suggest that excitatory and depressing effects of insulin on spontaneous firing were mutually exclusive. In particular, for each MC, insulin appears to affect either the excitability or the GABAergic synaptic inhibition, but not both. Indeed, blocking insulin's effect on MC excitability did not increase the number of MCs that were depressed or the magnitude of the depression (Fig. 2). Similarly, blocking the GABAergic transmission did not augment the proportion of MCs that was excited by insulin (Fig. 5). Insulin's effect on the two systems therefore appears to be MC specific.
Insulin reduces MC activity by acting on GABAergic and glutamatergic MC inputs
The reduction of spontaneous firing in 29% of the MCs recorded in the intact network (Fig. 1) suggests another way for insulin to act. In 33% of the MCs, insulin increased the GABAergic charge (Fig. 6B), while the GABA blockers clearly impaired the inhibitory action of insulin (Fig. 5B). These observations suggest that insulin can reduce the activity of MCs by increasing their inhibitory GABAergic inputs. Because the frequency of sIPSCs was modified by insulin, the latter would probably reduce the probability of GABA release from OB interneurons. Granular cells are the best candidates because they express the K+ channels targeted by the hormone (Schoppa & Westbrook, 1999) and insulin receptors (Fadool et al. 2000; Aimé et al. 2012). Moreover, insulin appeared to affect GABAergic transmission by acting directly on MCs. Indeed, the paradoxical effect, namely sIPSC amplitude decreasing despite an increase in frequency (Fig. 6B), suggests the existence of a postsynaptic action of insulin on MCs that would regulate the membrane expression and/or efficacy of GABAA receptors. However, further experiments are needed to confirm this hypothesis.
Insulin was also observed as reducing MC spontaneous (data not shown) and evoked (Fig. 8) EPSCs. The absence of insulin receptors in the ON layer (Aimé et al. 2012), together with a dissociated effect of insulin on sEPSC amplitude (reduction) and frequency (not significantly affected), supports a postsynaptic action of the hormone. In agreement with this, modulation of the receptor's expression at the cell surface has been described in another brain region (Mielke & Wang, 2011).
Insulin reduced eEPSCs in the majority of the recorded MCs (7/9, Fig. 8B), whereas it reduced the firing evoked by ON stimulation in only about 30% of the MCs (Fig. 9A). This difference indicates that the reduction of eEPSCs could be compensated for by additional simultaneous actions of insulin at other network levels. Here, evidence was provided for two such actions: an increase in MC excitability involving a reduction of their intrinsic K+ currents and a reduction in MC excitability involving GABAergic inhibition.
Insulin alters the population response of MCs without modifying the average evoked activity
MCs, as the principal output neurons of the OB to higher order cortices, carry, through their firing, the overall information processing exerted by this structure. Here insulin was shown to be capable of altering MC firing by acting at different levels of the OB network. The impact of insulin on OB processing was evaluated by analysing its complex action on MC ON-evoked responses. Although the evoked response was significantly modified in about 60% of the MCs, insulin did not alter the average evoked activity of the MC population. This can be ascribed to the fact that insulin acts on MCs differentially, in opposite directions and in a balanced manner. Insulin opposite effects on MC responses (excitatory vs. inhibitory) have been previously reported in anaesthetised rats (Cain, 1975). Another feeding peptide, orexin, has been also shown to induce opposite effects on MCs in OB slices (Hardy et al. 2005). Here the direction of insulin effect was connected to the control evoked firing rate (Fig. 9C, upper plot). Indeed, insulin tended to decrease the higher firing rates but to increase the lower firing rates, thus reducing the variability of the evoked firing across MCs. Note that the distance between the evoked and the spontaneous activities also correlates with the initial distance (Fig. 9C, lower plot), and in this way it reduced the inter-cell variability of the signal to noise ratio.
What is the physiological implication of the effects of insulin in the OB network?
Insulin modulates the OB network by acting directly on its main output neurons and by modulating their GABAergic and glutamatergic inputs. For a given MC, depending on the predominance of the direct or indirect effects of insulin, the signal to noise ratio can be improved or reduced.
How would such a modulation by insulin, which exerts differentially within the OB network, affect odour processing? The insulin-induced decrease in evoked activity variability across cells suggests a reduced ability of the network to discriminate different odours (discrimination being based on a specific active MC combination, activity of which should clearly contrast with other neurons). In parallel, the distance variability between the evoked and spontaneous activity was also reduced (Fig. 9C, lower plot), suggesting a reduced ability of the network to detect the odours (detection properties being based on the contrast between MC spontaneous and evoked firings). The population activity model supports such hypotheses and further suggests that insulin would differentially impact odour processing according to odour identity (Fig. 10). Among the 200 computed odours, for some (about 35%), the action of insulin would result in reduced detection and discrimination abilities of MCs. However, these coding abilities would be enhanced for a small but consistent number of odours (2–7%, Fig. 10). The distribution of odours into these two sets could depend on the alimentary valence of the odor in a feeding context.
How does the model fit the behavioural experimental data? Regarding odour detection in rodents, the intranasal delivery of insulin (Marks et al. 2009) was reported to moderately increase the olfactory detection of peppermint, whereas the icv injection of insulin reduced the detection of isoamyl acetate (Aimé et al. 2012). Similarly, in humans, a hyperinsulinaemic/euglycaemic clamp or an intranasal insulin delivery was shown to reduce the detection of butanol (Ketterer et al. 2011; Brunner et al. 2013). Regarding odour discrimination, the intranasal delivery of insulin in rodents (Marks et al. 2009) also increased discrimination between two pairs of non-alimentary odours (peppermint/geranyl-acetate or the alcohols C9/C10) but did not modify discrimination in humans (Brunner et al. 2013). Thus, the previous behavioural and present electrophysiological data are fully in agreement and support that insulin can differentially alter odour detection and discrimination (Marks et al. 2009; Ketterer et al. 2011; Aimé et al. 2012).
Conclusions
Here, MCs are shown to be being heterogeneous regarding modulation of their activity by insulin. Recent investigations have stressed that heterogeneity is a characteristic of the MC population and that it drives the computational properties of these neurons. For example, their intrinsic biophysical diversity has been proposed to increase MC information content (Padmanabhan & Urban, 2010), while heterogeneity in Ih current (mixed cationic current, involving channels permeable to both Na+ and K+) expression has been proposed to affect stimulus processing by these neurons (Angelo & Margrie, 2011). More recently, MCs were shown to be heterogeneous with regard to their glucosensitivity (Tucker et al. 2013). Here, the MC differential sensitivities to insulin were proposed as coming from both the heterogeneity of the MC population itself and the complex action of insulin on their surrounding synaptic network. To what extent can the MC heterogeneity described here match that previously described? Padmanabhan and Urban (2010) reported a differential expression of voltage-dependent K+ channels, which could account for MCs that were not excited by insulin in the present study. Moreover, Angelo and Margrie (2011) showed that the heterogeneity of Ih current expression in MC correlated with their firing pattern, MCs expressing Ih having a more regular firing. Here there was no correlation between MC firing mode (recorded as spontaneous activity) and the direction of the insulin effect (data not shown), suggesting that heterogeneity in insulin's action would not match heterogeneity in Ih expression.
Regardless, the main finding of the present study is that the heterogeneous nature of the modulation exerted by insulin on MCs could impact odour detection and discrimination mechanisms. Because insulin is one of the major hormones involved in feeding behaviour, such an impact could be hypothesised as being exerted according to relevant ecological characteristics, such as the alimentary/ethological valence of the odour.
Glossary
- ACSF
artificial cerebrospinal fluid
- APV
(d-(−)-2-amino-5-phosphonopentanoic acid
- 4-AP
4-aminopyridine
- EPSC
evoked postsynaptic current
- IPSC
inhibitory postsynaptic current
- IEI
inter-event interval
- ISI
inter-spike interval
- MC
mitral cell
- NBQX
2,3-dioxo-6-nitro-1,2,3,4-tetrahydrobenzo[f]quinoxaline-7-sulfonamide
- OB
olfactory bulb
- ON
olfactory nerve
- TEA
tetra-ethyl-ammonium
- TTX
tetrodotoxin
Additional information
Competing interests
The authors declare that they have no any conflicts of interests and no competing financial interest that may be perceived as contributing to potential bias.
Author contributions
N.K., N.F-T.: collection, analysis, interpretation and design of the experiments, drafting the article. A.S.: collection and analysis of data. M.T.: technical assistance and conception of the data processing software. P.A., S.G., P.D.-V.: research conception, drafting and revising the article. B.P.-P.: analysis of data; research conception, drafting and revising the article.
Funding
This work was supported by the Centre National de la Recherche (CNRS), the Claude Bernard University of Lyon (University Lyon1) and a grant from The French National Research Agency (Agence Nationale de la Recherche, ANR) in the Programme National de Recherche en Alimentation et Nutrition Humaine (ANR-05-PNRA-1.E7 AROMALIM).
References
- Aimé P, Duchamp-Viret P, Chaput MA, Savigner A, Mahfouz M, Julliard AK. Fasting increases and satiation decreases olfactory detection for a neutral odor in rats. Behav Brain Res. 2007;179:258–264. doi: 10.1016/j.bbr.2007.02.012. [DOI] [PubMed] [Google Scholar]
- Aimé P, Hegoburu C, Jaillard T, Degletagne C, Garcia S, Messaoudi B, Thevenet M, Lorsignol A, Duchamp C, Mouly AM, Julliard AK. A physiological increase of insulin in the olfactory bulb decreases detection of a learned aversive odor and abolishes food odor-induced sniffing behavior in rats. PLoS One. 2012;7:e51227. doi: 10.1371/journal.pone.0051227. [DOI] [PMC free article] [PubMed] [Google Scholar]
- Angelo K, Margrie TW. Population diversity and function of hyperpolarization-activated current in olfactory bulb mitral cells. Sci Rep. 2011;1:50. doi: 10.1038/srep00050. [DOI] [PMC free article] [PubMed] [Google Scholar]
- Banks WA, Kastin AJ, Pan W. Uptake and degradation of blood-borne insulin by the olfactory bulb. Peptides. 1999;20:373–378. doi: 10.1016/s0196-9781(99)00045-5. [DOI] [PubMed] [Google Scholar]
- Baskin DG, Porte D, Jr, Guest K, Dorsa DM. Regional concentrations of insulin in the rat brain. Endocrinology. 1983;112:898–903. doi: 10.1210/endo-112-3-898. [DOI] [PubMed] [Google Scholar]
- Brunner YF, Benedict C, Freiherr J. Intranasal insulin reduces olfactory sensitivity in normosmic humans. J Clin Endocrinol Metab. 2013;98:E1626–1630. doi: 10.1210/jc.2013-2061. [DOI] [PubMed] [Google Scholar]
- Cain DP. Effects of insulin injection on responses of olfactory bulb and amygdala single units to odors. Brain Res. 1975;99:69–83. doi: 10.1016/0006-8993(75)90609-5. [DOI] [PubMed] [Google Scholar]
- Christie JM, Westbrook GL. Regulation of backpropagating action potentials in mitral cell lateral dendrites by A-type potassium currents. J Neurophysiol. 2003;89:2466–2472. doi: 10.1152/jn.00997.2002. [DOI] [PubMed] [Google Scholar]
- Coetzee WA, Amarillo Y, Chiu J, Chow A, Lau D, McCormack T, Moreno H, Nadal MS, Ozaita A, Pountney D, Saganich M, Vega-Saenz de Miera E, Rudy B. Molecular diversity of K+ channels. Ann N Y Acad Sci. 1999;868:233–285. doi: 10.1111/j.1749-6632.1999.tb11293.x. [DOI] [PubMed] [Google Scholar]
- Colley B, Tucker K, Fadool DA. Comparison of modulation of Kv1.3 channel by two receptor tyrosine kinases in olfactory bulb neurons of rodents. Receptors Channels. 2004;10:25–36. [PMC free article] [PubMed] [Google Scholar]
- Duchamp A, Sicard G. Odour discrimination by olfactory bulb neurons, statistical analysis of electrophysiological responses and comparison with odour discrimination by receptor cells. Chem Senses. 1984;9:1–14. [Google Scholar]
- Fadool DA, Levitan IB. Modulation of olfactory bulb neuron potassium current by tyrosine phosphorylation. J Neurosci. 1998;18:6126–6137. doi: 10.1523/JNEUROSCI.18-16-06126.1998. [DOI] [PMC free article] [PubMed] [Google Scholar]
- Fadool DA, Tucker K, Pedarzani P. Mitral cells of the olfactory bulb perform metabolic sensing and are disrupted by obesity at the level of the Kv1.3 ion channel. PLoS ONE. 2011;6:e24921. doi: 10.1371/journal.pone.0024921. [DOI] [PMC free article] [PubMed] [Google Scholar]
- Fadool DA, Tucker K, Phillips JJ, Simmen JA. Brain insulin receptor causes activity-dependent current suppression in the olfactory bulb through multiple phosphorylation of Kv1.3. J Neurophysiol. 2000;83:2332–2348. doi: 10.1152/jn.2000.83.4.2332. [DOI] [PMC free article] [PubMed] [Google Scholar]
- Ferré P, Decaux JF, Issad T, Girard J. Changes in energy metabolism during the suckling and weaning period in the newborn. Reprod Nutr Dev. 1986;26:619–631. doi: 10.1051/rnd:19860413. [DOI] [PubMed] [Google Scholar]
- Garcia S, Fourcaud-Trocme N. OpenElectrophy, an electrophysiological data- and analysis-sharing framework. Front Neuroinform. 2009;3:14. doi: 10.3389/neuro.11.014.2009. [DOI] [PMC free article] [PubMed] [Google Scholar]
- Gerozissis K. Brain insulin, regulation, mechanisms of action and functions. Cell Mol Neurobiol. 2003;23:1–25. doi: 10.1023/A:1022598900246. [DOI] [PMC free article] [PubMed] [Google Scholar]
- Grissmer S, Nguyen AN, Aiyar J, Hanson DC, Mather RJ, Gutman GA, Karmilowicz MJ, Auperin DD, Chandy KG. Pharmacological characterization of five cloned voltage-gated K+ channels, types Kv1.1, 1.2, 1.3, 1.5, and 3.1, stably expressed in mammalian cell lines. Mol Pharmacol. 1994;45:1227–1234. [PubMed] [Google Scholar]
- Hill JM, Lesniak MA, Pert CB, Roth J. Autoradiographic localization of insulin receptors in rat brain, prominence in olfactory and limbic areas. Neuroscience. 1986;17:1127–1138. doi: 10.1016/0306-4522(86)90082-5. [DOI] [PubMed] [Google Scholar]
- Hardy AB, Aioun J, Baly C, Julliard KA, Caillol M, Salesse R, Duchamp-Viret P. Orexin A modulates mitral cell activity in the rat olfactory bulb, patch-clamp study on slices and immunocytochemical localization of orexin receptors. Endocrinology. 2005;146:4042–4053. doi: 10.1210/en.2005-0020. [DOI] [PubMed] [Google Scholar]
- Julliard AK, Chaput MA, Apelbaum A, Aime P, Mahfouz M, Duchamp-Viret P. Changes in rat olfactory detection performance induced by orexin and leptin mimicking fasting and satiation. Behav Brain Res. 2007;183:123–129. doi: 10.1016/j.bbr.2007.05.033. [DOI] [PubMed] [Google Scholar]
- Ketterer C, Heni M, Thamer C, Herzberg-Schafer SA, Haring HU, Fritsche A. Acute, short-term hyperinsulinemia increases olfactory threshold in healthy subjects. Int J Obes (Lond) 2011;35:1135–1138. doi: 10.1038/ijo.2010.251. [DOI] [PubMed] [Google Scholar]
- Ktorza A, Bihoreau MT, Nurjhan N, Picon L, Girard J. Insulin and glucagon during the perinatal period, secretion and metabolic effects on the liver. Biol Neonate. 1985;48:204–220. doi: 10.1159/000242173. [DOI] [PubMed] [Google Scholar]
- Lacroix MC, Badonnel K, Meunier N, Tan F, Schlegel-Le Poupon C, Durieux D, Monnerie R, Baly C, Congar P, Salesse R, Caillol M. Expression of insulin system in the olfactory epithelium, first approaches to its role and regulation. J Neuroendocrinol. 2008;20:1176–1190. doi: 10.1111/j.1365-2826.2008.01777.x. [DOI] [PubMed] [Google Scholar]
- Marks DR, Tucker K, Cavallin MA, Mast TG, Fadool DA. Awake intranasal insulin delivery modifies protein complexes and alters memory, anxiety, and olfactory behaviors. J Neurosci. 2009;29:6734–6751. doi: 10.1523/JNEUROSCI.1350-09.2009. [DOI] [PMC free article] [PubMed] [Google Scholar]
- Marks JL, Porte D, Jr, Stahl WL, Baskin DG. Localization of insulin receptor mRNA in rat brain by in situ hybridization. Endocrinology. 1990;127:3234–3236. doi: 10.1210/endo-127-6-3234. [DOI] [PubMed] [Google Scholar]
- Mielke JG, Wang YT. Insulin, synaptic function, and opportunities for neuroprotection. Progr Mol Biol Transl Sci. 2011;98:133–186. doi: 10.1016/B978-0-12-385506-0.00004-1. [DOI] [PubMed] [Google Scholar]
- Padmanabhan K, Urban NN. Intrinsic biophysical diversity decorrelates neuronal firing while increasing information content. Nat Neurosci. 2010;13:1276–1282. doi: 10.1038/nn.2630. [DOI] [PMC free article] [PubMed] [Google Scholar]
- Pager J, Giachetti I, Holley A, Le Magnen J. A selective control of olfactory bulb electrical activity in relation to food deprivation and satiety in rats. Physiol Behav. 1972;9:573–579. doi: 10.1016/0031-9384(72)90014-5. [DOI] [PubMed] [Google Scholar]
- Palouzier-Paulignan B, Duchamp-Viret P, Hardy AB, Duchamp A. GABAB receptor-mediated inhibition of mitral/tufted cell activity in the rat olfactory bulb, a whole-cell patch-clamp study in vitro. Neuroscience. 2002;111:241–250. doi: 10.1016/s0306-4522(02)00003-9. [DOI] [PubMed] [Google Scholar]
- Palouzier-Paulignan B, Lacroix M-C, Aimé P, Baly C, Caillol M, Congar P, Julliard AK, Tucker K, Fadool DA. Olfaction under metabolic influences. Chem Senses. 2012;37:769–797. doi: 10.1093/chemse/bjs059. [DOI] [PMC free article] [PubMed] [Google Scholar]
- Royet JP, Distel H, Hudson R, Gervais R. A re-estimation of the number of glomeruli and mitral cells in the olfactory bulb of rabbit. Brain Res. 1998;788:35–42. doi: 10.1016/s0006-8993(97)01504-7. [DOI] [PubMed] [Google Scholar]
- Savigner A, Duchamp-Viret P, Grosmaitre X, Chaput M, Garcia S, Ma M, Palouzier-Paulignan B. Modulation of spontaneous and odorant-evoked activity of rat olfactory sensory neurons by two anorectic peptides, insulin and leptin. J Neurophysiol. 2009;101:2898–2906. doi: 10.1152/jn.91169.2008. [DOI] [PMC free article] [PubMed] [Google Scholar]
- Schoppa NE, Westbrook GL. Regulation of synaptic timing in the olfactory bulb by an A-type potassium current. Nat Neurosci. 1999;2:1106–1113. doi: 10.1038/16033. [DOI] [PubMed] [Google Scholar]
- Sohn JW, Elmquist JK, Williams KW. Neuronal circuits that regulate feeding behavior and metabolism. Trends Neurosci. 2013;36:504–512. doi: 10.1016/j.tins.2013.05.003. [DOI] [PMC free article] [PubMed] [Google Scholar]
- Song WJ. Genes responsible for native depolarization-activated K+ currents in neurons. Neurosci Res. 2002;42:7–14. doi: 10.1016/s0168-0102(01)00305-4. [DOI] [PubMed] [Google Scholar]
- Tucker K, Cho S, Thiebaud N, Henderson MX, Fadool DA. Glucose sensitivity of mouse olfactory bulb neurons is conveyed by a voltage-gated potassium channel. J Physiol. 2013;591:2541–2561. doi: 10.1113/jphysiol.2013.254086. [DOI] [PMC free article] [PubMed] [Google Scholar]
- Unger J, McNeill TH, Moxley RT, 3rd, White M, Moss A, Livingston JN. Distribution of insulin receptor-like immunoreactivity in the rat forebrain. Neuroscience. 1989;31:143–157. doi: 10.1016/0306-4522(89)90036-5. [DOI] [PubMed] [Google Scholar]
- Wang XY, McKenzie JS, Kemm RE. Whole-cell K+ currents in identified olfactory bulb output neurones of rats. J Physiol. 1996;490:63–77. doi: 10.1113/jphysiol.1996.sp021127. [DOI] [PMC free article] [PubMed] [Google Scholar]
- Williams KW, Scott MM, Elmquist JK. Modulation of the central melanocortin system by leptin, insulin, and serotonin, co-ordinated actions in a dispersed neuronal network. Eur J Pharmacol. 2011;660:2–12. doi: 10.1016/j.ejphar.2010.11.042. [DOI] [PMC free article] [PubMed] [Google Scholar]
- Yeomans MR. Olfactory influences on appetite and satiety in humans. Physiol Behav. 2006;87:800–804. doi: 10.1016/j.physbeh.2006.01.029. [DOI] [PubMed] [Google Scholar]