

Abstract
Astrocytes are thought to detect neuronal activity in the form of intracellular calcium elevations; thereby, astrocytes can regulate neuronal excitability and synaptic transmission. Little is known, however, about how the astrocyte calcium signal regulates the activity of neuronal populations. In this study, we addressed this issue using functional multineuron calcium imaging in hippocampal slice cultures. Under normal conditions, CA3 neuronal networks exhibited temporally correlated activity patterns, occasionally generating large synchronization among a subset of cells. The synchronized neuronal activity was correlated with astrocyte calcium events. Calcium buffering by an intracellular injection of a calcium chelator into multiple astrocytes reduced the synaptic strength of unitary transmission between pairs of surrounding pyramidal cells and caused desynchronization of the neuronal networks. Uncaging the calcium in the astrocytes increased the frequency of neuronal synchronization. These data suggest an essential role of the astrocyte calcium signal in the maintenance of basal neuronal function at the circuit level.
Key points
In the brain, astrocytes detect neuronal activity and regulate neuronal excitability and synaptic transmission.
Recent studies show that calcium elevations that are localized within astrocyte processes upregulate endogenous neurotransmission at nearby synapses.
We demonstrated that at the network level calcium buffering in astrocytes caused a significant reduction in the correlated activity of neurons in cultured hippocampal slices.
In contrast, the uncaging of calcium in astrocytes triggered synchronized activity in neuronal populations.
This study provides experimental support for the functional relevance of astrocyte signalling to the maintenance of collective neuronal dynamics.
Introduction
Brain function occurs through the concerted activity of neuronal and glial circuitry (Allen & Barres, 2009). Whereas neurons use electrical signals across the plasma membrane, astrocytes, the largest class of glial cells, exhibit excitability in the form of changes in intracellular calcium concentrations. Astrocyte calcium transients can be induced by synaptic activity in vitro (Perea & Araque, 2005; Gordon et al. 2009; Bernardinelli et al. 2011; Min & Nevian, 2012) and sensory-evoked stimulation in vivo (Wang et al. 2006; Schummers et al. 2008; Nimmerjahn et al. 2009; Takata et al. 2011). Astrocyte calcium transients modulate synaptic transmission and plasticity through the extracellular release of gliotransmitters (Halassa & Haydon, 2010; Henneberger et al. 2010).
In addition to the previously accumulated evidence, recent studies have shown that calcium elevations that occur within astrocyte processes can be triggered by the basal synaptic activity associated with single action potentials. These localized calcium signals are believed to upregulate the endogenous neurotransmission at nearby synapses (Di Castro et al. 2011; Panatier et al. 2011). Single astrocytes contact thousands of synapses; thus, astrocytes may work as a key component that sustains neuronal circuit function. However, little was known about the impact of astrocyte calcium signalling on the collective dynamics of a large number of neurons. To address this issue, it is necessary to capture the many-to-many relationship between neuronal and astrocytic populations.
In this study, we used functional multineuron calcium imaging and intracellular dialysis of a calcium chelator and examined how disrupting the astrocyte calcium signal affected the spatiotemporal activity patterns of neuron populations in cultured hippocampal slices. Inhibiting the astrocyte calcium signalling significantly suppressed neuronal network synchronization, which was measured by two parameters: the frequency of large synchronization events and the number of correlated neuron pairs.
Methods
Ethical approval
Experiments were performed with the approval of the animal experimental ethics committee at the University of Tokyo (approval number: 24-6) according to the University of Tokyo guidelines for the care and use of laboratory animals.
Slice preparations
Hippocampal slice cultures were prepared from postnatal day 7 Wistar/ST rats (n = 32) (SLC, Shizuoka, Japan). Briefly, rat pups were chilled, and the brains were removed and horizontally cut into 300 μm-thick slices in aerated, ice-cold Gey's balanced salt solution supplemented with 25 mm glucose. Entorhino-hippocampal stumps were excised and cultivated on Omnipore membrane filters (JHWP02500; Millipore, Billerica, MA, USA) that were laid on plastic O-ring discs (Koyama et al. 2007). The cultures were fed with 1 ml of 50% minimal essential medium, 25% Hanks’ balanced salt solution, 25% horse serum and antibiotics in a humidified incubator at 37°C in 5% CO2 and were used for experiments on days 7–14 in vitro. The medium was changed every 3.5 days.
Calcium imaging from cultured slices
Slices were washed three times with oxygenated artificial cerebrospinal fluid (aCSF) consisting of (mm) 127 NaCl, 26 NaHCO3, 3.3 KCl, 1.24 KH2PO4, 1.2 MgSO4, 1.2–1.5 CaCl2 and 10 glucose, and bubbled with 95% O2 and 5% CO2, unless otherwise specified. The slices were transferred to a 35 mm dish filled with 2 ml of dye solution and incubated for 40 min in a humidified incubator at 37°C in 5% CO2 with 0.0005% Oregon Green 488 BAPTA-1 (OGB-1) AM (Invitrogen, Carlsbad, CA, USA), 0.01% Pluronic F-127 (Invitrogen) and 0.005% Cremophor EL (Sigma-Aldrich, St Louis, MO, USA). The slices were then covered in aCSF again for >30 min. The slices were mounted in a recording chamber at 32°C and perfused with aCSF at a rate of 1.5–2.0 ml min−1 for >15 min. The hippocampal CA3 pyramidal cell layer was imaged at 10 Hz using a Nipkow-disc confocal microscope (CSU-X1; Yokogawa Electric, Tokyo, Japan), a cooled CCD camera (iXonEM+ DV897; Andor Technology, Belfast, UK), an upright microscope with a water-immersion objective lens (16×, 0.8 numerical aperture; Nikon). The fluorophores were excited at 488 nm with a laser diode and visualized with a 507 nm long-pass emission filter. After identification of the cell types, the regions of interest were carefully placed onto the cell bodies. The fluorescence change (ΔF/F) was calculated as ΔF/F = (Ft – F0)/F0, where Ft is the fluorescence intensity at time t, and F0 is the baseline intensity averaged for 50 s before and after time t. Spike times were reconstructed from the onsets of Ca2+ transients with custom-written software in Microsoft Visual Basic (Sasaki et al. 2008). The signals were then inspected by eye to remove erroneously detected noise. For astrocytes, the region of interest size was set to a diameter of 10 μm, which corresponds to the size of the astrocyte soma. Calcium elevations were extracted with a threshold of 4 × SD of the baseline noise and a 5 s duration (Sasaki et al. 2011). The signals were then inspected by eye to remove erroneously detected noise. Data analysis was performed with custom software written in Matlab (Mathworks, Natick, MA, USA). (S)-α-Methyl-4-carboxyphenylglycine (MCPG; Sigma-Aldrich), pyridoxal-phosphate-6-azophenyl-2′,4′-disulphonic acid (PPADS; Sigma-Aldrich) and (2R)-amino-5-phosphonopentanoate (AP5) were applied in the bath.
In vivo calcium imaging of rat hippocampal astrocytes
Male Wistar rats (postnatal, 14 days old; n = 6) were anaesthetized with urethane (1.5 g kg−1, i.p.), and the exposed skull was glued to a metal plate, which was fixed to a stereotaxic frame. A craniotomy (2.5 to 3 mm diameter), centred 3.0 mm posteriorly and 2.5 mm laterally to the bregma, was performed, and the dura was surgically removed. The cortical tissue above the hippocampus was removed by aspiration (Kuga et al. 2011). Then, the exposed dorsal surface of the hippocampus was loaded with a small volume (approximately 4 μl) of dye solution consisting of 0.133% fluo-4 AM (Invitrogen), 100 μm SR101, 20% DMSO and 8% Pluronic F-127. During an incubation period of 60 min, the hippocampal surface was covered with a small piece of Gel Form (Pfizer Inc., New York, USA) to retain the dye solution in place. After the unloaded dye was washed with aCSF, the aspirated area was mounted with 2% agar dissolved in aCSF. The astrocyte calcium activity was imaged with a two-photon laser-scanning microscope based on a mode-locked Ti:sapphire laser with a 100 fs pulse width, 80 MHz pulse frequency and 840 nm wavelength (Mai Tai; Spectra Physics, Mountain View, CA, USA), an upright microscope (BX61WI; Olympus, Tokyo, Japan), and a water-immersion objective lens (20×, 0.95NA and 25×, 1.05NA, Olympus). After each experiment, the brain was removed and immediately frozen. Coronally sectioned preparations (30 μm thickness) were stained with 0.1% Cresyl Fast Violet (Wako Pure Chemical Industries, Osaka, Japan) to confirm the imaged area.
Electrophysiological recordings
Cell-attached patch-clamp recordings were obtained from neurons and astrocytes with an Axopatch 700B amplifier (Molecular Devices, Sunnyvale, CA, USA). Borosilicate glass pipettes (4–6 MΩ) were filled with aCSF. Signals were low-pass filtered at 1–2 kHz, digitized at 20 kHz and analysed with pClamp 10.1 software (Molecular Devices).
Calcium buffering
To inhibit astrocyte calcium activity, BAPTA was injected into the astrocytes. For a targeted single-cell electroporation technique, borosilicate glass pipettes (5–7 MΩ) were filled with aCSF containing 50 mm BAPTA (Sigma-Aldrich) and 1 mm Alexa Fluor 488 hydrazide (Invitrogen). The tip of the pipette was placed onto the soma in the same manner as for cell-attached recording, and 50 rectangular pulses (–5 V, 0.5 ms duration) were applied at a frequency of 50 Hz (Ohkura et al. 2012). This procedure was repeated in the adjacent astrocytes using the same pipette. For an alternative dialysis method, whole cell patch-clamp recordings were performed from astrocytes using borosilicate glass pipettes (5–7 MΩ) filled with a solution containing (in mm): 125 KMeSO4, 10 Hepes, 4 MgCl2, 4 ATP, 0.4 GTP, 10 BAPTA and 0.2 Alexa Fluor 594 (pH 7.2).
Calcium uncaging
To stimulate the astrocyte calcium signal, 10 mm o-nitrophenyl-EGTA (NP-EGTA; Invitrogen), a caged calcium reagent, was injected into the astrocytes using the electroporation described above. To lower the basal neuronal activity, the ionic composition of aCSF was modified as follows: 3.0 mm K+, 1.8 mm Ca2+ and 1.8 mm Mg2+. NP-EGTA was uncaged by a 150 μm diameter ultraviolet (UV) pulse for a 5–10 s exposure to UV light that was emitted from a 100 mW high-pressure mercury lamp (C-SHG1; Nikon, Tokyo, Japan) and short-pass filtered at 330 nm (XF1001; Omega Optical, Brattleboro, VT, USA).
Post hoc Nissl staining
Slices were fixed in 4% paraformaldehyde (PFA) in 0.1 m phosphate buffer solution for 2 h and were permeabilized with 0.3% Triton X-100 for 60 min. They were then incubated with 530/615 NeuroTrace Nissl (Invitrogen). Images were acquired at a Z-depth interval of 5 μm with an Olympus two-photon laser scanning system.
Immunohistochemistry
Rats (postnatal, 14 days old; n = 5) were perfused transcardially with cold 4% PFA in 25 mm phosphate-buffered saline (PBS). The brain samples were postfixed with 4% PFA overnight at 4°C. The fixed brains were rinsed three times with 25 mm PBS, and horizontal hippocampal slices with a thickness of 300 μm were prepared with a vibratome (Dosaka). Cultured slices were fixed in 4% PFA in 25 mm PBS overnight at 4°C. The slices were permeabilized in 25 mm PBS with 1% Triton X-100 and 10% goat serum at room temperature for 60 min. The samples were then incubated with primary rat monoclonal anti-NeuN antibody (1:1000; Millipore) and mouse monoclonal anti-S100β antibody (1:1000; Sigma) for two overnight periods at 4°C and labelled with secondary anti-rabbit IgG Alexa-488 (1:500; Life Technologies, Carlsbad, CA, USA) and anti-mouse IgG Alexa-594 (1:500; Invitrogen) overnight at room temperature.
Results
Slice preparations allow both imaging of cells with high spatiotemporal resolution and detailed manipulation of cell activity. A disadvantage of acute slices is that neuronal activity is almost abolished because most of the synaptic connections are severely disrupted. In cultured slices, synaptic connections can be re-established ex vivo (Wittner et al. 2007), and the spontaneous activity of neurons recovers to the some extent in vivo (Sasaki et al. 2007; Takahashi et al. 2010). To address how the astrocyte calcium signal modulates intrinsic activity patterns in neuronal networks, we utilized cultured slice preparations. It has been suggested, however, that astrocytes change their fine structures and expression levels of proteins in slice preparations (Takano et al. 2014). We first confirmed how well the basic morphological and physiological properties of astrocytes were preserved in the cultured slices (Fig. 1). No significant differences were found in the density or the inter-soma distance of S100β-positive astrocyte pairs between in vivo preparations and cultured slices (Fig. 1A). The complexity of glial fibrillary acidic protein (GFAP)-positive processes was assessed by Sholl analysis. In the cultured slices, the number of intersections between the glial processes and the Sholl circles significantly decreased at distances of 20–40 μm and increased at distances greater than 60 μm from the glial soma (Fig. 1B, left; P < 0.05, Tukey's test). Branch order analysis revealed less cumulative branching in the cultured slices at any distance from the soma (Fig. 1B, right). These results suggest that cultured astrocytes have fewer branching structures, whereas individual processes are than those in in vivo astrocytes. GFAP-positive processes have been reported to be partially retracted shortly after the preparation of acute slices (Takano et al. 2014). Our results imply that after 1 week of incubation in culture, astrocytes are likely to re-extend the remaining processes without aberrant branching. Calcium imaging of the astrocytes showed that the basic kinetics of astrocyte calcium transients (i.e. duration and latency to peak) were not significantly different between the in vivo and cultured astrocytes (Fig. 1D; in vivo, n = 533 events from six animals; cultured slice, n = 250 events from seven slices), whereas the frequency of calcium activity tended to be lower in the cultured slices (Fig. 1E; in vivo, n = 119 active cells from six animals; cultured slice, n = 98 active cells from seven slices). Taken together, these results suggest that the basic morphological and physiological properties are, at least in part, preserved in cultured astrocytes.
Figure 1. Morphological and physiological characteristics of astrocytes in cultured hippocampal slices.
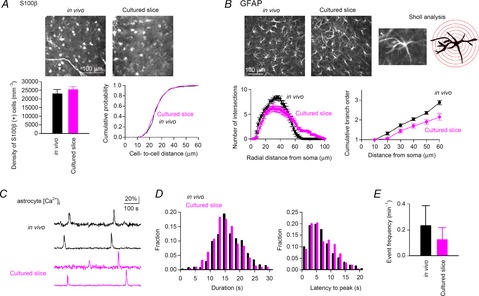
A, (top) immunolabeling of S100β in astrocytes in the striatum radiatum. The sections prepared by transcardial fixation are labelled in vivo. (bottom) Density of S100β-positive cells (left; P > 0.05, Student's t test, n = 4 slices each) and distribution of the cell-to-cell distances between the closest pairs of S100β-positive cells (right; P > 0.05, Kolmogorov–Smirnov test, in vivo, n = 396 cells; cultured slice, n = 435 cells). B, (top) immunolabelling of GFAP in astrocytes. An example cell used for Sholl analysis is magnified in the right panel. The red circles are depicted with diameters that increase in 10 μm intervals. (bottom) Sholl analysis of GFAP-positive processes (left; n = 25 cells each) and the cumulative branch order number plotted as a function of the path length from the soma (right). C, calcium fluorescence traces of rat astrocytes in vivo and in cultured slices. D, distribution of duration and latency to peak of the calcium events of astrocytes (in vivo, n = 533 events from six animals; cultured slice, n = 250 events from seven slices). E, average frequency of astrocyte calcium events (in vivo, n = 119 active cells from six animals; cultured slice, n = 98 active cells from seven slices). Error bars are SEM.
Imaging of neuronal and glial calcium activity in the hippocampus
Using a high-speed confocal imaging technique, we monitored the spatiotemporal patterns of the spontaneous activity of more than 100 neurons in the CA3 region of hippocampal slice cultures. Neurons and astrocytes were both loaded with OGB-1 AM and were discriminated based on post hoc staining with Nissl, a fluorescent neuron-specific marker (Fig. 2A). Compared with Nissl-negative cells, which correspond to putative glial cells, Nissl-positive neurons had larger somata (Fig. 2C) and a relatively lower basal fluorescence intensity (Sasaki et al. 2007). Cell-attached patch-clamp recordings revealed that the neurons exhibited calcium transients with a decay time constant of 350–600 ms in response to action potentials, whereas the astrocytes displayed slower calcium elevations with a duration of more than 2 s, independent of the electrical activity (Fig. 2B and C). Based on these morphological and functional characteristics, we were therefore able to separate neurons from astrocytes (Fig. 2C). We have previously reported that our imaging system can reliably detect the neuronal calcium events evoked by single spikes with 100% probability at a frame rate of 10 Hz (Sasaki et al. 2008). An example spatiotemporal activity pattern of neuronal and glial cells is shown in Fig. 2D. On average, the single movies included 100 ± 4 neurons and 29 ± 2 astrocytes (n = 23 slices). During our observation period of 5 min, 41 ± 3% neurons and 44 ± 2% astrocytes exhibited at least one calcium activity event. The frequencies of calcium activity were 3.6 ± 0.3 min−1 in active neurons (n = 303 cells) and 0.67 ± 0.04 min−1 in active astrocytes (n = 68 cells).
Figure 2. Optical recording of calcium activity in hippocampal neurons and glial cells.
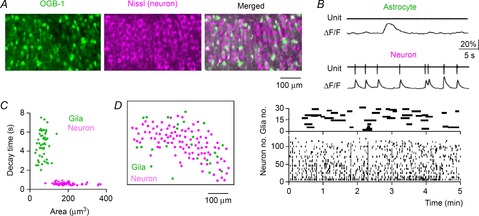
A, the hippocampal CA3 region in a cultured slice loaded with OGB-1 (left) was confocally imaged and post hoc Nissl-stained (middle). Non-neuronal cells became green in the merged image (right). B, an astrocyte (top) and a neuron (bottom) were patch-clamp recorded in the cell-attached configuration. The astrocytes exhibited spontaneous calcium elevations that were not associated with electrical activity, whereas the neurons exhibited calcium transients that were time-locked to action potentials. C, cell types were classified according to their size and the decay time constant of calcium activity. Putative astrocytes and neurons are indicated in green and magenta dots, respectively. Each dot indicates a single cell. D, the locations of 101 neurons and 24 astrocytes (left) in an imaged slice are shown in the left cell map. The spatiotemporal patterns of the spontaneous calcium events detected in these cells are plotted in the right rastergrams. Each black line represents a single calcium event. The recordings were performed in aCSF consisting of 4.5 mm K+, 1.2 mm Ca2+ and 1.2 mm Mg2+.
Evaluation of neuronal synchronization
We characterized the temporal correlation of the activity in a neuronal population. For any given short period of 100 ms, 0.36 ± 0.05% of the total recorded neurons (n = 6 slices) were active neurons. Thus, the spontaneous activity was fundamentally sparse. Nonetheless, the slices occasionally exhibited synchronized activity patterns (Fig. 2D). We frequently observed that a subset of neurons was recruited coincidently in these synchronized events. We thus defined a large synchronization as an event in which more than 10% of the total neurons exhibited calcium events during a period of 100 ms. To determine whether a stochastic process accounted for the large synchronization, we compared the emergence of large synchronization to that in randomized surrogate datasets. In the surrogate, we randomly shuffled the inter-event intervals (IEIs) of calcium events within each neuron and repeated this procedure for all neurons in the dataset (Fig. 3A). This procedure collapsed the temporal correlation across neuronal events without changing the total event number (Fig. 3B, right). For each dataset, we created 20 surrogates. An example surrogate is shown in Fig. 3B. The overall percentage of co-active neurons in the surrogates was shifted to the left in the cumulative probability distribution (Fig. 3C middle, n = 6 slices). Indeed, large synchronization emerged at a frequency of 1.7 ± 0.9 min−1 in the real datasets, but no large synchronization occurred in the surrogates (Fig. 3C). Therefore, the large synchronization in the original datasets could not be explained by chance.
Figure 3. Characterization of synchronized neuronal activity in cultured hippocampal slices.
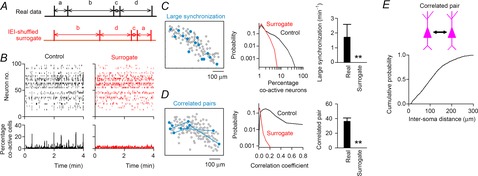
A, to collate the event correlations between neurons, the inter-event intervals (IEIs) were transposed at random within cells. B, a rastergram of 100 neurons (left) was IEI shuffled (right). The bottom time histograms show the percentage of co-active neurons relative to the total number of imaged neurons (100 ms bin). C, cells activated during a representative large synchronization event are shown by filled circles in the left cell map. The distribution of the percentage of co-active cells during a time window of the 100 ms bin (middle) and the frequency of large synchronization (right) are compared with those in the corresponding surrogates (n = 65,908 bins from six slices). D, highly correlated neuron pairs, which exhibited correlation coefficients of more than 0.25, are linked by lines in the left cell map. The distribution of correlation values between all possible neuron pairs (middle) and the number of highly correlated neuron pairs (right) are compared with those in the corresponding surrogates (n = 8339 pairs from 303 neurons). Error bars are SEM, **P < 0.001, paired t test. E, cumulative distribution of soma-to-soma distances between correlated neuron pairs (n = 246 pairs).
To further confirm this notion, we utilized another prominent feature of neuronal activity, i.e. pairwise synchronization. The timings of calcium events are often correlated with a nearly zero time lag between two neurons. To quantify the level of synchrony, we calculated the correlation coefficients of event timings between pairs of neurons (Fig. 3D). The correlation coefficient had a mean of 0.10 ± 0.01 and ranged from 0.01 to 0.89 (n = 8339 pairs from 303 neurons in six slices). In surrogate datasets, this value decreased to 0.03 ± 0.01 and ranged from −0.04 to 0.19. We defined a highly correlated pair as a cell pair that exhibited a correlation coefficient greater than 0.25 because this level was not observed in the surrogate datasets. Indeed, the total number of correlated pairs was 36 ± 5 in the real datasets and 0 ± 0 in their surrogates (Fig. 3D). Therefore, in our preparations the neurons spontaneously generated temporally coordinated firing patterns. The average inter-soma distance between correlated neuron pairs was 81 ± 7 μm (Fig. 3E; n = 246 pairs).
Correlated activity between the neuronal and astrocytic population
We investigated whether astrocytes display calcium activity time-locked with neuronal synchronization (Fig. 4). The number of co-active glial cells correlated weakly but significantly with the percentage of co-active neurons (Fig. 4B; n = 2741; R = 0.28, P < 0.01). When more than 10% of the neurons showed synchronous activity, the glial cells increased the number of calcium events (Fig. 4C). This correlation analysis implies that glial cells are linked to the generation of neuronal co-activation. To examine the spatial relationship between neuronal and glial synchrony, we measured the inter-soma distances between co-active neuron pairs and astrocytes that exhibited calcium activity at the same time as the neuronal synchronization (Fig. 4D). The neuron–glia distances were significantly smaller than those obtained from their surrogate datasets (P < 0.05, Kolmogorov–Smirnov test), suggesting a non-random spatial arrangement in glia-related neuronal synchronization. However, the average distance was 95 ± 8 μm (n = 3834 pairs), which is larger than the size of a single astrocyte territory (Bushong et al. 2002). This indicates that not all correlated activity is explained by the inter-soma distance alone. The lack of an apparent proximity in neuronal and glial activity may be attributable to the complexity of dendritic morphology. To test this idea, two CA3 pyramidal cells within an imaging region (400 × 400 μm) were randomly selected and labelled by Alexa Fluor 594 through whole-cell patch-clamp pipettes (Fig. 4E). In 9 of 19 neuron pairs, a part of the dendrites from two neurons overlapped with each other (i.e. minimum inter-dendrite distance = 0 μm). In 18 of 19 pairs, the minimum inter-dendrite distance was less than 50 μm (Fig. 4E, right). The spatial apposition suggests that, within the range of our imaging field, nearly all neuron pairs can be linked to a single astrocyte territory through their processes.
Figure 4. Correlated activity of neuronal and glial networks.
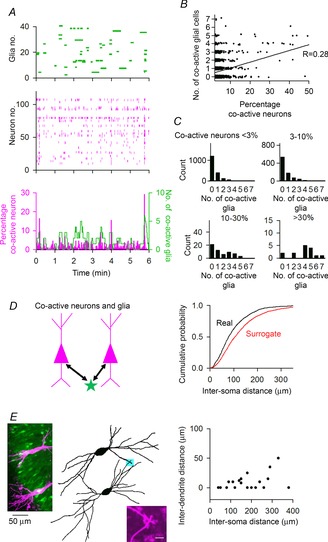
A, calcium activity of astrocytes (top) and neurons (middle). The bottom time histogram represents the percentage of co-active neurons and the number of co-active glial cells. B, the number of co-active glial cells plotted against the percentage of co-active neurons (R = 0.28, P < 0.01, n = 2741). C, distribution of the number of co-active glial cells at the period when the percentage of co-active neurons is <3% (n = 1825), 3–10% (n = 843), 10–30% (n = 58) and >30% (n = 15). The data were reconstructed from the plot in B. D, cumulative distribution of soma-to-soma distances between co-active neurons and glial cells. Surrogate datasets were created by randomly selecting glial cells in the same imaging field. P < 0.01, Kolmogorov –Smirnov test. E, (left) representative image of Alexa 594-injected neurons after whole-cell recordings superimposed on OGB-1-loaded cells. In this example, the inter-soma distance is 168 μm, and the minimum inter-dendrite distance is 0 μm. The point represents a contact site, which is magnified in the right bottom inset. Scale bar = 5 μm. (Right) In each neuron pair, the minimum inter-dendrite distance was plotted as a function of the inter-soma distance (n = 19 neuron pairs).
Astrocytes modulate the temporal dynamics of the neuronal population
To directly investigate whether glial cells regulate the formation of patterned activity in neuronal circuits, the calcium signal of astrocytes was hampered by an intracellular infusion of BAPTA, a calcium chelator that can buffer intracellular calcium ions (Serrano et al. 2006; Navarrete & Araque, 2010; Di Castro et al. 2011; Panatier et al. 2011; Poskanzer & Yuste, 2011). To inject BAPTA into multiple astrocytes, we used a single-cell electroporation technique (Judkewitz et al. 2009; Ohkura et al. 2012). Compared with the loading of chemical compounds through whole-cell pipettes, single-cell electroporation has the advantage of being able to sequentially introduce compounds into multiple cells within a short time. Indeed, we were able to load BAPTA into 20 adjacent cells one by one within 5 min. The BAPTA loading was confirmed by co-loading with Alexa 594-dextran (Fig. 5A). The fluorescent signals did not leak into neighbouring neuropils, demonstrating the selective loading of BAPTA into astrocyte compartments. Unlike Alexa 594-dextran, BAPTA freely spreads to neighbouring astrocytes through gap junctions; thus, virtually all astrocytes in an imaged area were expected to be loaded with BAPTA. Consistent with this, the spontaneous calcium events of those astrocytes, including the indirectly loaded cells, were almost completely abolished after the multicellular BAPTA dialysis (Fig. 5A, right).
Figure 5. Calcium chelation in astrocytes attenuates nearby synaptic transmission.
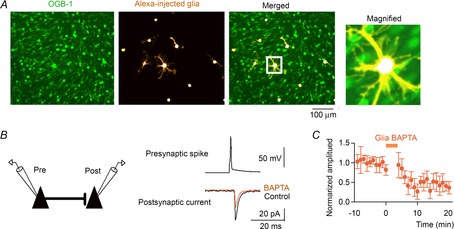
A, OGB-1-loaded CA3 cells and astrocytes co-loaded with BAPTA and Alexa 594-dextran were confocally imaged and merged in the right panel. The region in the white square is magnified in the right inset. B, dual whole-cell recordings were obtained from a synaptically coupled pair of CA3 pyramidal cells. Averaged unitary postsynaptic currents triggered by single presynaptic spikes were recorded before and after intracellular BAPTA injection. C, the amplitudes of the postsynaptic currents were normalized to the baseline level before BAPTA infusion and plotted as a function of time relative to the BAPTA injection (n = 4 cells). Error bars are SEM.
First, we examined the effect of BAPTA dialysis on nearby synaptic transmission. We obtained simultaneous whole-cell recordings from synaptically connected pairs of CA3 pyramidal cells (Fig. 5B). The presynaptic neurons were injected with a brief depolarizing current 50–100 times every 10 s to evoke single action potentials, and unitary postsynaptic currents were monitored from the postsynaptic cells that were clamped at a voltage of −70 mV. After recordings of the basal unitary postsynaptic currents for 5 min, BAPTA was loaded into 5–12 astrocytes located around the postsynaptic dendrites. Similar to previous studies using minimal stimulation of dentate gyrus synapses (Di Castro et al. 2011) and CA1 synapses (Panatier et al. 2011) in acute hippocampus slices, the astrocytic BAPTA significantly reduced the amplitude of the unitary postsynaptic currents in CA3 pyramidal cells by 49.3 ± 22.2% (Fig. 5C; P = 0.0031, t4 = 6.36, paired-t test, n = 5 cells).
Next, we investigated whether the blockade of astrocyte calcium signals affects the collective behaviour of neuronal populations. Figure 6A depicts representative rastergrams of neuronal and astrocyte calcium events in a slice in which astrocytes were electroporated with or without BAPTA by our electroporation method. There were no significant differences between the BAPTA-free slices (EP Without BAPTA, n = 6 slices) and the BAPTA-treated slices (EP With BAPTA, n = 6 slices) in the percentage of active neurons (Fig. 6B; P = 0.47, t10 = 0.75, Student's t test), the mean frequency of neuronal events (Fig. 6C; P = 0.69, t10 = 0.41, Student's t test) or the distribution of neuronal event frequencies (P = 0.10, D576 = 0.10, Kolmogorov–Smirnov test). Therefore, the treatment of astrocytes with BAPTA was unlikely to influence the level of spontaneous neuronal activity per se. Nonetheless, we found that BAPTA treatment interfered with neuronal synchronization; in the BAPTA-treated slices, both the frequency of large synchronization (Fig. 6D; P = 0.012, t10 = 3.02, Student's t test) and the number of highly correlated pairs (Fig. 6E; P = 0.017, t10 = 2.83, Student's t test) were significantly lower than those in the BAPTA-free slices. We also performed intracellular BAPTA dialysis of a single astrocyte using whole-cell recording with a pipette solution containing 10 mm BAPTA (Panatier et al. 2011). Consistent with the results from the above electroporation method, the BAPTA injection into an astrocyte through a whole-cell pipette (WC With BAPTA) significantly reduced the frequency of large synchronization (Fig. 6D; P = 0.013, t8 = 3.19, Student's t test) and the number of highly correlated pairs (Fig. 6E; P = 0.019, t8 = 2.92, Student's t test) compared with those in the BAPTA-free condition (WC Without BAPTA). These results suggest that astrocyte calcium signalling is necessary for sustaining the temporally organized dynamics of a neuronal population.
Figure 6. Calcium chelation in astrocytes attenuates neuronal synchronization.
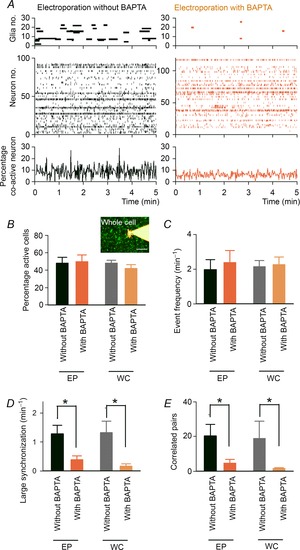
A, the calcium activity of astrocytes (top) and neurons (middle) is compared between slices in which 20 astrocytes were electroporated with BAPTA (right) or no BAPTA (left). The bottom time histograms represent the percentage of co-active neurons (100 ms bin). B and C, the percentage of active neurons in a given 5 min time period (B) and the mean frequency of neuronal events (C). BAPTA was injected by electroporation of astrocyte populations (EP) or whole-cell patching of a single astrocyte (WC, inset). EP Without BAPTA, n = 6 slices; EP With BAPTA, n = 6 slices; WC Without BAPTA, n = 5 slices; WC With BAPTA, n = 5 slices. Scale bar = 50 μm. D and E, the frequency of large synchronization (D) and the number of highly correlated neuron pairs (E). Error bars are SEM, *P < 0.05, Student's t test.
To investigate the mechanisms underlying glia-related neuronal synchrony, we examined the pharmacological actions of glutamatergic and purinergic antagonists. Among the tested inhibitors, PPADS, a P2 ATP receptor antagonist, and MCPG, a group I and II metabotropic glutamate receptor (mGluR) antagonist, tended to affect neuronal dynamics. In the presence of PPADS, both the frequency of large synchronization and the number of correlated neuronal pairs were partially reduced, whereas the total neuronal firing rates remained unchanged (Fig. 7A). An MCPG application reduced the frequency of large neuronal synchronization (Fig. 7B, middle) without altering the number of correlated cell pairs (Fig. 7B, bottom). No differences in these parameters were found in the presence of AP5, an N-methyl-d-aspartate (NMDA) receptor antagonist (Fig. 7C), indicating that activation of NMDA receptors is not involved in the synchronized patterns of neurons.
Figure 7. Pharmacological inhibition of synchronized neuronal activity.
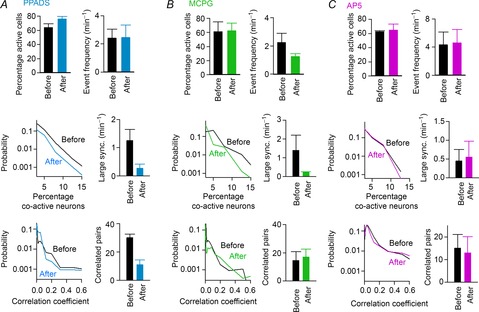
A, (top) the percentage of active neurons in a given 5 min time period and the average frequency of neuronal events before and after bath application of PPADS (n = 4 slices). (middle) Distribution of the percentage of co-active cells (left) and the frequency of large synchronization (right), which were calculated as described in Fig. 3C. (bottom) Distribution of correlation values between neuron pairs (left) and the number of highly correlated pairs (right), which were calculated as described in Fig. 3D. B, same as in A but for MCPG application (n = 4 slices). C, same as in A but for AP5 application (n = 4 slices). Error bars are SEM.
Finally, we examined whether the astrocyte calcium elevations were sufficient to increase neuronal synchronization. Eight to 12 astrocytes were electroporated with NP-EGTA, a UV-sensitive caged calcium reagent, and these astrocytes were illuminated with UV light (330 nm) with a diameter of 150 μm for 5–10 s. To prevent excessive neuronal activation after uncaging, the baseline activity level was lowered by aCSF that consisted of 3.0 mm K+, 1.8 mm Ca2+ and 1.8 mm Mg2+. The UV-induced uncaging significantly increased the frequency of large synchronization (Fig. 8B; P = 0.0021, t4 = 7.11, paired t test) and the number of highly correlated pairs (Fig. 8C; P = 0.009, t4 = 4.76, paired t test). Similar results were obtained when the caged compound was intracellularly dialysed into a single astrocyte by a whole-cell pipette (large synchronization, P = 0.0061, t3 = 6.97; number of highly correlated pairs, P = 0.027, t3 = 4.03).
Figure 8. Calcium uncaging in astrocytes facilitates neuronal synchronization.
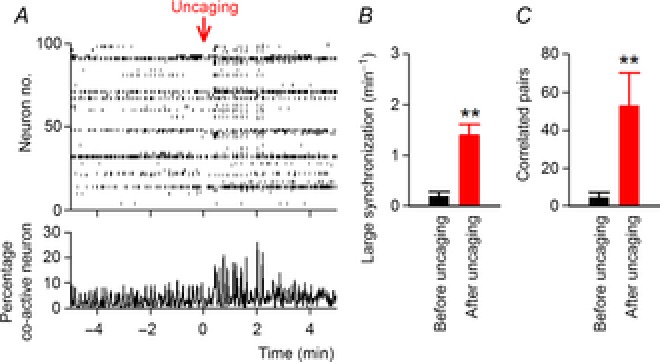
A, NP-EGTA-loaded astrocytes were illuminated with UV for 5 s at time 0 min (Uncaging) while calcium activity was monitored in the surrounding neurons. The recording was performed in aCSF containing 3.0 mm K+, 1.8 mm Ca2+ and 1.8 mm Mg2+. B and C, the frequencies of large synchronization (B) and the number of highly correlated pairs (C) were compared between the control period before uncaging and the 2 min period after uncaging; n = 3299 pairs between 531 cells from five slices. Error bars are SEM, **P < 0.01, paired t test.
Discussion
Previous studies of neuron–astrocyte communication have shown the role of astrocyte calcium signals in regulating the basal activity of a small number of synapses (Di Castro et al. 2011; Panatier et al. 2011). In the condition in which calcium signals are buffered in astrocyte populations, we showed that synchronized neuronal activity is prominently reduced, which supports the proposal that astrocytes can maintain basal neuronal function at the network level.
Note, however, that our study was performed using young slice preparations. The mechanisms of astrocyte calcium signalling differ between the adult brain and the young brain (Sun et al. 2013) or between slices and in vivo measurements (Takano et al. 2014). In addition, organotypic slice cultures undergo re-extension of astrocyte processes, as shown in Fig. 1, and substantial remodelling of synaptic connections. To extrapolate our results to a higher order of brain functions, further studies will be needed with other types of experimental preparations using advanced technical approaches.
The BAPTA treatment reduced, but did not completely abolish, the basal synaptic transmission. Likewise, it weakened, but did not completely block, the neuronal synchronization. Therefore, astrocytes are not indispensable to synaptic transmission or synchronization, but they are probably involved in neuromodulation through gliotransmitters. From a series of tested pharmacological inhibitors, we found that P2 receptor blockade showed effects that were most similar to calcium buffering in astrocytes (i.e. both the frequency of large synchronization and the number of correlated neuronal pairs were decreased without altering the total neuronal firing rates). These results imply that P2 receptor activation might be responsible for the glial maintenance of neuronal synchronization. However, bath application of drugs is not cell-type specific; thus, we cannot exclude the possibility that these pharmacological actions were simply due to the inhibition of neuronal receptors that are independent of glia-related pathways. Application of MCPG, an mGluR antagonist, abolished large neuronal synchronization, but these effects could be simply explained by a decrease in the overall frequency of neuronal calcium events (Fig. 7B, top), which makes it difficult to determine whether metabotropic glutamate receptors are involved in glia-induced neuronal synchronization. Another possible mechanism is the breakdown of glial–neuronal metabolic interactions. Disruption of the intracellular ion equilibrium by calcium buffering in astrocytes may cause a reduction in the delivery of metabolic substrates to neurons, leading to the dysfunction of organized neuronal networks (Belanger et al. 2011). To isolate the effect of astrocytes and determine the detailed mechanisms of complex network dynamics, further investigation is required using molecular and genetic tools to selectively manipulate targeted molecules in a cell type-specific manner.
Assuming that organized temporal patterns of neurons contribute to information processing and memory storage in the brain (Zohary et al. 1994; Vaadia et al. 1995; deCharms & Merzenich, 1996; Riehle et al. 1997; Steinmetz et al. 2000), astrocyte calcium signal may play a pivotal role in fundamental brain function by sustaining functional clusters of neurons.
Glossary
- aCSF
artificial cerebrospinal fluid
- AP5
(2R)-amino-5-phosphonopentanoate
- GFAP
glial fibrillary acidic protein
- IEI
inter-event interval
- MCPG
(S)-α-methyl-4-carboxyphenylglycine
- mGluR
metabotropic glutamate receptor
- NMDA
N-methyl-d-aspartate
- NP-EGTA
o-nitrophenyl-EGTA
- PFA
paraformaldehyde
- PPADS
pyridoxal-phosphate-6-azophenyl-2′,4′-disulphonic acid
Additional information
Competing interests
None declared.
Author contributions
T.S. designed the research; T.S. collected and analysed the slice imaging and patch-clamp recording data while T.I. performed pharmacological experiments. R.N. performed the immunohistochemical investigation. R.A. and A.A. performed the in vivo imaging. M.N. and Y.I. supervised the project. T.S. and Y.I. wrote the manuscript. All authors read and approved the final submission. The research was conducted at The University of Tokyo.
Funding
This work was partly supported by Grants-in-Aid for Science Research on Innovative Areas, ‘Mesoscopic Neurocircuitry’ (No. 22115003), from the Ministry of Education, Culture, Sports, Science and Technology of Japan and by the Funding Program for Next Generation World-Leading Researchers (LS023).
References
- Allen NJ, Barres BA. Neuroscience: Glia – more than just brain glue. Nature. 2009;457:675–677. doi: 10.1038/457675a. [DOI] [PubMed] [Google Scholar]
- Belanger M, Allaman I, Magistretti PJ. Brain energy metabolism: focus on astrocyte–neuron metabolic cooperation. Cell Metab. 2011;14:724–738. doi: 10.1016/j.cmet.2011.08.016. [DOI] [PubMed] [Google Scholar]
- Bernardinelli Y, Salmon C, Jones EV, Farmer WT, Stellwagen D, Murai KK. Astrocytes display complex and localized calcium responses to single-neuron stimulation in the hippocampus. J Neurosci. 2011;31:8905–8919. doi: 10.1523/JNEUROSCI.6341-10.2011. [DOI] [PMC free article] [PubMed] [Google Scholar]
- Bushong EA, Martone ME, Jones YZ, Ellisman MH. Protoplasmic astrocytes in CA1 stratum radiatum occupy separate anatomical domains. J Neurosci. 2002;22:183–192. doi: 10.1523/JNEUROSCI.22-01-00183.2002. [DOI] [PMC free article] [PubMed] [Google Scholar]
- deCharms RC, Merzenich MM. Primary cortical representation of sounds by the coordination of action-potential timing. Nature. 1996;381:610–613. doi: 10.1038/381610a0. [DOI] [PubMed] [Google Scholar]
- Di Castro MA, Chuquet J, Liaudet N, Bhaukaurally K, Santello M, Bouvier D, Tiret P, Volterra A. Local Ca2+ detection and modulation of synaptic release by astrocytes. Nat Neurosci. 2011;14:1276–1284. doi: 10.1038/nn.2929. [DOI] [PubMed] [Google Scholar]
- Gordon GR, Iremonger KJ, Kantevari S, Ellis-Davies GC, MacVicar BA, Bains JS. Astrocyte-mediated distributed plasticity at hypothalamic glutamate synapses. Neuron. 2009;64:391–403. doi: 10.1016/j.neuron.2009.10.021. [DOI] [PMC free article] [PubMed] [Google Scholar]
- Halassa MM, Haydon PG. Integrated brain circuits: astrocytic networks modulate neuronal activity and behaviour. Annu Rev Physiol. 2010;72:335–355. doi: 10.1146/annurev-physiol-021909-135843. [DOI] [PMC free article] [PubMed] [Google Scholar]
- Henneberger C, Papouin T, Oliet SH, Rusakov DA. Long-term potentiation depends on release of d-serine from astrocytes. Nature. 2010;463:232–236. doi: 10.1038/nature08673. [DOI] [PMC free article] [PubMed] [Google Scholar]
- Judkewitz B, Rizzi M, Kitamura K, Hausser M. Targeted single-cell electroporation of mammalian neurons in vivo. Nat Protoc. 2009;4:862–869. doi: 10.1038/nprot.2009.56. [DOI] [PubMed] [Google Scholar]
- Koyama R, Muramatsu R, Sasaki T, Kimura R, Ueyama C, Tamura M, Tamura N, Ichikawa J, Takahashi N, Usami A, Yamada MK, Matsuki N, Ikegaya Y. A low-cost method for brain slice cultures. J Pharmacol Sci. 2007;104:191–194. doi: 10.1254/jphs.sc0070119. [DOI] [PubMed] [Google Scholar]
- Kuga N, Sasaki T, Takahara Y, Matsuki N, Ikegaya Y. Large-scale calcium waves traveling through astrocytic networks in vivo. J Neurosci. 2011;31:2607–2614. doi: 10.1523/JNEUROSCI.5319-10.2011. [DOI] [PMC free article] [PubMed] [Google Scholar]
- Min R, Nevian T. Astrocyte signalling controls spike timing-dependent depression at neocortical synapses. Nat Neurosci. 2012;15:746–753. doi: 10.1038/nn.3075. [DOI] [PubMed] [Google Scholar]
- Navarrete M, Araque A. Endocannabinoids potentiate synaptic transmission through stimulation of astrocytes. Neuron. 2010;68:113–126. doi: 10.1016/j.neuron.2010.08.043. [DOI] [PubMed] [Google Scholar]
- Nimmerjahn A, Mukamel EA, Schnitzer MJ. Motor behaviour activates Bergmann glial networks. Neuron. 2009;62:400–412. doi: 10.1016/j.neuron.2009.03.019. [DOI] [PMC free article] [PubMed] [Google Scholar]
- Ohkura M, Sasaki T, Kobayashi C, Ikegaya Y, Nakai J. An improved genetically encoded red fluorescent Ca2+ indicator for detecting optically evoked action potentials. PLoS One. 2012;7:e39933. doi: 10.1371/journal.pone.0039933. [DOI] [PMC free article] [PubMed] [Google Scholar]
- Panatier A, Vallee J, Haber M, Murai KK, Lacaille JC, Robitaille R. Astrocytes are endogenous regulators of basal transmission at central synapses. Cell. 2011;146:785–798. doi: 10.1016/j.cell.2011.07.022. [DOI] [PubMed] [Google Scholar]
- Perea G, Araque A. Properties of synaptically evoked astrocyte calcium signal reveal synaptic information processing by astrocytes. J Neurosci. 2005;25:2192–2203. doi: 10.1523/JNEUROSCI.3965-04.2005. [DOI] [PMC free article] [PubMed] [Google Scholar]
- Poskanzer KE, Yuste R. Astrocytic regulation of cortical UP states. Proc Natl Acad Sci U S A. 2011;108:18453–18458. doi: 10.1073/pnas.1112378108. [DOI] [PMC free article] [PubMed] [Google Scholar]
- Riehle A, Grun S, Diesmann M, Aertsen A. Spike synchronization and rate modulation differentially involved in motor cortical function. Science. 1997;278:1950–1953. doi: 10.1126/science.278.5345.1950. [DOI] [PubMed] [Google Scholar]
- Sasaki T, Kuga N, Namiki S, Matsuki N, Ikegaya Y. Locally synchronized astrocytes. Cereb Cortex. 2011;21:1889–1900. doi: 10.1093/cercor/bhq256. [DOI] [PubMed] [Google Scholar]
- Sasaki T, Matsuki N, Ikegaya Y. Metastability of active CA3 networks. J Neurosci. 2007;27:517–528. doi: 10.1523/JNEUROSCI.4514-06.2007. [DOI] [PMC free article] [PubMed] [Google Scholar]
- Sasaki T, Takahashi N, Matsuki N, Ikegaya Y. Fast and accurate detection of action potentials from somatic calcium fluctuations. J Neurophysiol. 2008;100:1668–1676. doi: 10.1152/jn.00084.2008. [DOI] [PubMed] [Google Scholar]
- Schummers J, Yu H, Sur M. Tuned responses of astrocytes and their influence on hemodynamic signals in the visual cortex. Science. 2008;320:1638–1643. doi: 10.1126/science.1156120. [DOI] [PubMed] [Google Scholar]
- Serrano A, Haddjeri N, Lacaille JC, Robitaille R. GABAergic network activation of glial cells underlies hippocampal heterosynaptic depression. J Neurosci. 2006;26:5370–5382. doi: 10.1523/JNEUROSCI.5255-05.2006. [DOI] [PMC free article] [PubMed] [Google Scholar]
- Steinmetz PN, Roy A, Fitzgerald PJ, Hsiao SS, Johnson KO, Niebur E. Attention modulates synchronized neuronal firing in primate somatosensory cortex. Nature. 2000;404:187–190. doi: 10.1038/35004588. [DOI] [PubMed] [Google Scholar]
- Sun W, McConnell E, Pare JF, Xu Q, Chen M, Peng W, Lovatt D, Han X, Smith Y, Nedergaard M. Glutamate-dependent neuroglial calcium signalling differs between young and adult brain. Science. 2013;339:197–200. doi: 10.1126/science.1226740. [DOI] [PMC free article] [PubMed] [Google Scholar]
- Takahashi N, Sasaki T, Matsumoto W, Matsuki N, Ikegaya Y. Circuit topology for synchronizing neurons in spontaneously active networks. Proc Natl Acad Sci U S A. 2010;107:10244–10249. doi: 10.1073/pnas.0914594107. [DOI] [PMC free article] [PubMed] [Google Scholar]
- Takano T, He W, Han X, Wang F, Xu Q, Wang X, Oberheim Bush NA, Cruz N, Dienel GA, Nedergaard M. Rapid manifestation of reactive astrogliosis in acute hippocampal brain slices. Glia. 2014;62:78–95. doi: 10.1002/glia.22588. [DOI] [PMC free article] [PubMed] [Google Scholar]
- Takata N, Mishima T, Hisatsune C, Nagai T, Ebisui E, Mikoshiba K, Hirase H. Astrocyte calcium signalling transforms cholinergic modulation to cortical plasticity in vivo. J Neurosci. 2011;31:18155–18165. doi: 10.1523/JNEUROSCI.5289-11.2011. [DOI] [PMC free article] [PubMed] [Google Scholar]
- Vaadia E, Haalman I, Abeles M, Bergman H, Prut Y, Slovin H, Aertsen A. Dynamics of neuronal interactions in monkey cortex in relation to behavioural events. Nature. 1995;373:515–518. doi: 10.1038/373515a0. [DOI] [PubMed] [Google Scholar]
- Wang X, Lou N, Xu Q, Tian GF, Peng WG, Han X, Kang J, Takano T, Nedergaard M. Astrocytic Ca2+ signalling evoked by sensory stimulation in vivo. Nat Neurosci. 2006;9:816–823. doi: 10.1038/nn1703. [DOI] [PubMed] [Google Scholar]
- Wittner L, Henze DA, Zaborszky L, Buzsaki G. Three-dimensional reconstruction of the axon arbor of a CA3 pyramidal cell recorded and filled in vivo. Brain Struct Funct. 2007;212:75–83. doi: 10.1007/s00429-007-0148-y. [DOI] [PMC free article] [PubMed] [Google Scholar]
- Zohary E, Shadlen MN, Newsome WT. Correlated neuronal discharge rate and its implications for psychophysical performance. Nature. 1994;370:140–143. doi: 10.1038/370140a0. [DOI] [PubMed] [Google Scholar]