

Abstract
During neural development in animals, GABAergic and glycinergic neurons are first excitatory, and then become inhibitory in the mature state. This developmental shift is due mainly to strong expression of the cation-chloride K–Cl cotransporter 2 (KCC2) and down-regulation of Na–K–Cl cotransporter 1 (NKCC1) during maturation. The down-regulation of co-transporter KCC2 after spinal cord transection in animals leads to the depolarising (excitatory) action of GABA and glycine and thus results in a reduction of inhibitory synaptic efficiency. Furosemide, a loop diuretic, has been shown to selectively and reversibly block inhibitory postsynaptic potentials without affecting excitatory postsynaptic potentials in animal spinal neurons. Moreover, this diuretic has been also demonstrated to block the cation-chloride co-transporters. Here, we used furosemide to demonstrate changes in spinal inhibitory networks in healthy human subjects. Non-invasive electrophysiological techniques were used to assess presynaptic inhibition, postsynaptic inhibition and the efficacy of synaptic transmission between muscle afferent terminals and soleus motoneurons in the spinal cord. Orally administered furosemide, at doses commonly used in the clinic (40 mg), significantly reduced spinal inhibitory interneuronal activity for at least 70 min from intake compared to control experiments in the same subjects while no changes were observed in the efficacy of synaptic transmission between muscle afferent terminals and soleus motoneurons. The reduction of inhibition was dose-dependent. Our results provide indirect evidence that reversible changes in the cation-chloride transport system induce modulations of inhibitory neuronal activity at spinal cord level in humans.
Key points
It has been demonstrated in humans that furosemide crosses the blood–brain barrier and blocks activity in the epileptic brain.
In this study, we demonstrated using non-invasive electrophysiological techniques in healthy human subjects that furosemide, a cation-chloride co-transporter blocker, orally administered at doses commonly used in the clinic (40 mg), reduces the efficacy of pre- and postsynaptic inhibition of soleus motoneurons in the spinal cord.
Furosemide can be a useful tool to detect the intrinsic functioning of inhibitory synapses and to explore if the reduced inhibitory interneuronal activity that probably contributes to spasticity also exists in humans with spinal cord injury.
Introduction
GABA and glycine are depolarising and excitatory in the immature spinal cord, becoming inhibitory in the mature state (Takahashi, 1984; Wu et al. 1992; Ziskind-Conhaim, 1998, Ben Ari, 2002). This developmental transition is generated by the differential expression of cation–chloride transporters, the chloride inward co-transporter (K–Cl cotransporter 2, NKCC1) being highly expressed in immature neurons whereas the chloride outward co-transporter (K–Cl cotransporter 2, KCC2) is dominant in mature neurons. The abundant KCC2 expression on mature neurons lowers the intracellular chloride ion concentrations. When GABA and glycine neurotransmitters contact the neuron, there will subsequently be an inward flux of chloride ions, thus lowering the membrane potential (i.e. inhibition).
In the animal spinal cord, the lack of KCC2 expression leads to a depolarising action of GABA and glycine (Vinay & Jean-Xavier, 2008), and also results in a reduction of inhibitory synaptic efficiency (Boulenguez et al. 2010). In KCC2 knockout animals, sciatic nerve recordings have revealed abnormal spontaneous electrical activity and altered lumbar motoneuron responses to sciatic nerve stimulation (Hübner et al. 2001). Several studies in animals have shown that loss or reduction of co-transporter KCC2 function results in the development of CNS hyper-excitability (Woo et al. 2002; Zhu et al. 2008).
The loop diuretics, furosemide and bumetanide, are thought to modulate inhibitory synapses through their antagonist effect on cation-chloride co-transporters (Gillen et al. 1996; Payne et al. 2003; Yamada et al. 2004). It has been suggested that furosemide antagonises the KCC2 co-transporter but it is also used as an NKCC1 blocker. Nevertheless, its effect on the NKCC1 co-transporter is less potent than bumetanide (Gillen et al. 1996; Russell, 2000). To date, no substance has been identified that selectively inhibits KCC2 (Kahle et al. 2008; Löscher & Schmidt, 2011), and some of the KCC2 blockers used in animal studies require very high concentrations (Payne, 1997) that are likely to be toxic in humans. Nicoll (1978) demonstrated in the frog that furosemide selectively and reversibly blocks inhibitory postsynaptic potentials (IPSPs) elicited in spinal motoneurons by GABA and glycine without affecting excitatory postsynaptic potentials (EPSPs) elicited in spinal motoneurons by glutamate. As furosemide has been shown to cross the blood–brain barrier after intravenous injection in humans (Haglund & Hochman, 2005) and is a widely used diuretic which has been employed with a good safety record for many years in humans, we have chosen furosemide to investigate the functioning of inhibitory synapses in this study.
The aim of the present study was to investigate the possibility that orally administered furosemide at normal clinical doses could modify the functioning of spinal inhibitory synapses in healthy human subjects. We studied two types of inhibitory spinal networks: (i) presynaptic inhibition of Ia fibres, which is probably mediated via GABAergic synapses, and (ii) postsynaptic inhibition produced by cutaneous stimulation, which is probably mediated via glycinergic synapses (Jankowska, 1992). In addition, we explored the effects of furosemide on the efficacy of synaptic transmission between muscle afferent terminals and soleus motoneurons by studying post-activation depression of the H-reflex. The results obtained in healthy subjects reveal that orally administered furosemide (40 mg) reduces the efficacy of spinal inhibitory interneurons without affecting the efficacy of synaptic transmission between muscle afferent terminals and soleus motoneurons.
Methods
Ethical approval
The experiments described in this study conformed to the guidelines issued by the World Medical Association (Declaration of Helsinki) on the ethics of experimentation in humans and the approval of the local ethical committee of the CPP Île-de-France VI – Pitié-Salpêtrière. Written informed consent was obtained from all subjects before participation.
Study design
This randomized controlled study was performed on 19 healthy subjects (nine females) aged 22–64 years old (mean ± standard error of the mean (SEM) 35.1 ± 2.5 years). All subjects participated in two different sessions to investigate the time course of changes in spinal network excitability for a period of 70 min (i) after furosemide intake (furosemide experiment) and (ii) without furosemide (control experiment). The two different experiments (furosemide and control) were performed on different days.
Experimental procedure
Medical examinations (blood testing for electrolytes, creatinine, glucose and blood pressure) were performed before the experiment to verify that subjects had no contraindications to furosemide.
All experiments were performed at rest. Subjects sat comfortably with the head, neck, back and arms supported in a slightly reclined armchair. The dominant leg was examined and remained in a stationary supported position with hip semi-flexion (120 deg), slight knee flexion (160 deg) and plantar flexion (110 deg).
Each experiment comprised seven time epochs (0–10, 11–20, 21–30, 31–40, 41–50, 51–60 and 61–70 min). The amount of pre-/postsynaptic inhibition evaluated at the beginning of recording (during 10 min before drug administration in the furosemide experiment, or 10 min before the test start time in the control experiment) corresponds to baseline inhibition. After the amount of inhibition was determined for the baseline period, 40 mg furosemide was orally administered. For the subject's convenience, due to its diuretic effect, the amount of inhibition was monitored through repetitive measurement over a time period limited to 70 min after administration of drug. Furosemide pharmacokinetics and pharmacodynamics in healthy subjects show that furosemide (40–80 mg) appears in the serum within 10 min and peaks from 60 to 90 min after oral administration (Branch et al. 1976, 1977; Tilstone & Fine, 1978).
The effects of varying doses of furosemide (0, 20 and 40 mg) were also investigated on pre-/postsynaptic inhibition in six subjects using the same experimental design.
The experiments testing the effects of furosemide on the efficacy of synaptic transmission between muscle afferent terminals and soleus motoneurons (post-activation depression of the H-reflex) were performed in 15 subjects as described previously for pre- and postsynaptic inhibition.
Water intake was recommended to subjects after the experiment. However, apart from the diuretic effect, some side effects of furosemide such as headaches and dizziness were reported by some of the subjects who participated in the present study.
Electrophysiological recordings
Method of assessing spinal network excitability
Soleus H-reflex
Spinal inhibitory circuits were studied using non-invasive electrophysiological techniques based on the H-reflex. The H-reflex was evoked in the soleus muscle by percutaneous stimulation of the posterior tibial nerve (PTN) at the popliteal fossa using a constant-current stimulator (D7SA Digitimer Ltd, Welwyn Garden City, UK). A rectangular 1 ms stimulus, delivered at 0.33 Hz to the PTN, was computer-triggered using a customised script (Signal 4.20, Cambridge Electronic Design, Cambridge, UK). The H-reflex was recorded from the electromyographic (EMG) signal of the soleus muscle using bipolar surface electrodes (Delsys Inc., Boston, MA, USA; Ag electrodes DE-2.1) positioned on the skin parallel to the muscle belly. The EMG signals were amplified (×1000), band pass filtered at 20–450 Hz (Delsys), digitised at 1 kHz (Power 1401 A/D board, Cambridge Electronic Design) and then stored on computer for offline analysis.
The maximum motor response (Mmax) and maximum H-reflex response (Hmax) were recorded at the beginning of the each experiment. The stimulus intensity was then adjusted to elicit H-reflex amplitude of 20–35% of Mmax, which corresponded to ∼50% of Hmax (mean value of H-reflex amplitude 24.85 ± 2.8% Mmax (control experiments); 23.17 ± 2.2% Mmax (furosemide experiments)). The unconditioned H-reflexes were set to have similar size across subjects and kept constant throughout the experiment, as the sensitivity of the H-reflex to facilitation or inhibition conditioning effects depends on its non-conditioned size (Crone et al. 1990).
Inhibitory conditioning stimulations (see Fig. 1)
Figure 1. Schematic diagrams of the techniques used to test spinal inhibitions and the underlying networks.
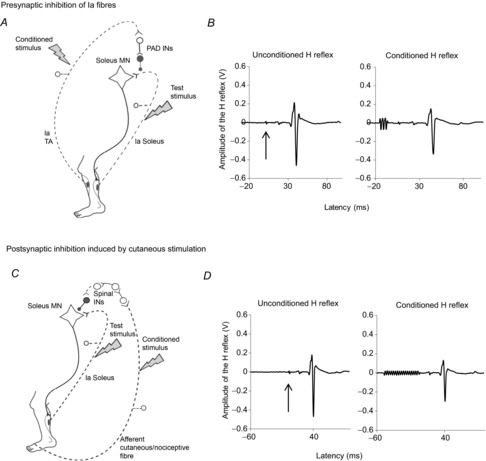
A, schematic diagram of the presynaptic inhibition of soleus Ia fibres. The conditioning stimulus induces the afferent volley in the tibialis anterior (TA) Ia afferent fibres and activates primary afferent depolarization (PAD) interneurons responsible for the presynaptic inhibition of Ia soleus fibres before the synapse with the soleus motoneuron. B, examples of waveforms of the unconditioned H-reflex (left), and the conditioned H-reflex (right) when preceded by the TA conditioning stimulus. The arrow indicates the trigger of the test stimulation. The conditioning stimulus consists of a train of three rectangular pulses, each of 1 ms, with an intensity 1.2 times the TA motor threshold (MT), delivered 21 ms before the test stimulation (see the beginning of the trace). C, schematic diagram of the postsynaptic inhibition induced by cutaneous stimulation. Conditioning stimulus induces the afferent volley in the cutaneous/nociceptive fibres (dotted line) in the sural nerve from the skin of the lateral side of the fifth toe activating spinal interneurons (INs) projecting on soleus motoneuron. D, examples of waveforms of the unconditioned H-reflex, and the conditioned H-reflex, by electrical stimuli applied to cutaneous afferents of the sural nerve evoking postsynaptic inhibition. The conditioning stimulus consists of trains of 17 pulses, each of 1 ms, with an interpulse interval of 3 ms, delivered 50 ms before the test stimulus. The arrow indicates the trigger of the test stimulus.
Presynaptic inhibition of Ia fibres
The D1 inhibition of the H-reflex was used to assess presynaptic inhibition of Ia fibres (Mizuno et al. 1971). The soleus H-reflex was conditioned with preceding stimulation of the common peroneal nerve (CPN) through hemispherical bipolar electrodes placed 2 cm below the neck of the fibula. The stimulus consisted of a train of three rectangular pulses, each of 1 ms duration, with an interpulse interval of 3 ms, with an intensity 1.2 times the tibialis anterior (TA) motor threshold (MT), delivered 21 ms before the test stimulation (Faist et al. 1996). MT was determined by tendon palpation and by the oscilloscope EMG display (mean MT 15.00 ± 0.31 mA (control experiment); 11.60 ± 0.13 mA (furosemide experiment)). At this inter-stimulus interval (21 ms), the CPN conditioning volley evokes an inhibition of the soleus H-reflex that is probably caused by presynaptic inhibition of soleus Ia afferents (Faist et al. 1996).
Postsynaptic inhibition produced by cutaneous stimulation
It has been shown that stimulation of the sural nerve (a purely cutaneous nerve) induces an inhibition of the soleus H-reflex (Hugon & Bathien, 1967). The soleus H-reflex was conditioned by electrical stimuli applied to cutaneous afferents of the sural nerve through bipolar adhesive electrodes placed on the lateral side of the fifth toe. The stimuli consisted of trains of 17 pulses, each of 1 ms, with an interpulse interval of 3 ms, delivered 50 ms before the test stimulus. In such conditions, the induced inhibition is probably caused by postsynaptic inhibition of soleus motorneurons (Pierrot-Deseilligny & Burke, 2012). The intensity of stimulation was based on the subject's perception threshold (PT) defined as the lowest stimulus intensity at which the subject reported sensation of the stimulation using a single pulse (mean PT 1.73 ± 0.02 mA (control experiment); 1.61 ± 0.1 mA (furosemide experiment)). The intensity of the stimulus train was slowly increased to 3–5 times PT to induce a clear-cut inhibition of the soleus H-reflex (mean intensity 4.33 ± 0.3 PT (control experiment); 3.79 ± 0.3 PT (furosemide experiment)).
Each stimulation sequence comprised three different conditions of 20 stimuli each: (i) test stimulus alone, (ii) paired stimulation (test stimulus + conditioning stimulus to CPN evoking presynaptic inhibition) and (iii) paired stimulation (test stimulus + conditioning stimulus to the sural nerve inducing postsynaptic inhibition). Consequently, 40 conditioned and 20 unconditioned H-reflexes, evoked at 0.33 Hz, were determined during each time epoch. A complete sequence took about 3 min. Conditioned and unconditioned H-reflexes were randomly alternated.
Post-activation depression
To test the possible effect of furosemide on spinal excitatory synapses, we used post-activation depression of soleus H-reflexes. It has been shown in both animals (Eccles, 1964) and humans (Magladery et al. 1951; Paillard, 1955; Crone & Nielsen, 1989; Hultborn & Nielsen, 1998) that post-activation depression at the Ia fibre–motorneuron synapse reflects the efficiency of the monosynaptic excitatory transmission between Ia fibre and motoneuron and is thus a simple and reliable tool to assess the functioning of excitatory synaptic transmission without contamination of other synaptic mechanisms (Meunier et al. 2007). Post-activation depression can be demonstrated by the depressive effect of increasing the stimulus rate on the size of H-reflexes. H-reflex is dramatically depressed when the interval between the two consecutive stimuli is 1–2 s, with gradual recovery as the interval increase over 10 s (Crone & Nielsen, 1989). In the present study, the H-reflex evoked every 3 s (0.33 Hz) was initially adjusted at Hmax/2. The soleus H-reflex evoked at low frequency (every 6 s or 0.16 Hz) and high frequency (every 1 s or 1 Hz) was measured in each case (see Fig. 4B). Twenty soleus H-reflexes were evoked for each stimulus rate (1 and 0.16 Hz). The amount of post-activation depression of the H-reflex was evaluated as the size of the H-reflex elicited every 1 Hz (high stimulus rate) expressed as a percentage of its value when elicited every 0.16 Hz (low stimulus rate). This is referred to as the 1/0.16 ratio. This ratio was used to determine the amount of post-activation depression of the H-reflex (Aymard et al. 2000).
Figure 4. Time courses of furosemide effects on post-activation depression and examples of waveforms of H-reflexes evoked at different frequencies for assessing post-activation depression.
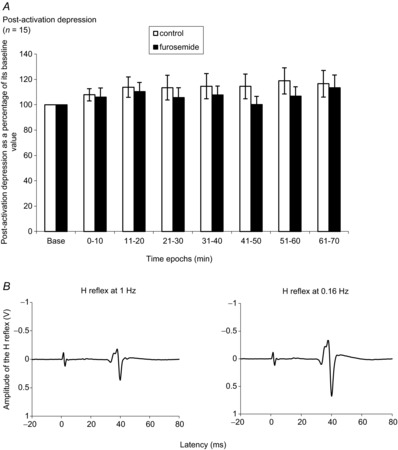
A, mean (±SEM) postsynaptic activation depression values expressed as a percentage of its baseline value over time (baseline, 0–10, 11–20, 21–30, 31–40, 41–50, 51–60 and 61–70 min) in control and furosemide. n = number of participants. B, examples of waveforms of H-reflex evoked at 1 Hz (left) and at 0.16 Hz (right).
Statistical methods
Data processing
To evaluate the amounts of pre- and postsynaptic inhibition, peak-to-peak amplitudes of unconditioned H-reflexes were compared to those of conditioned H-reflexes. The inhibitory effects were quantified by calculation of the inhibition value as 100 – ((conditioned H value/unconditioned H value) × 100). Each inhibition value was then normalized to the percentage of its baseline value using the equation: [%((Inhibition at tx – baseline inhibition)/baseline inhibition)] + 100.
To evaluate the effects of post-activation depression, the 1/0.16 ratio value was normalized to the percentage of its baseline value using the equation: [% ((1/0.16 ratio at tx – 1/0.16 ratio at baseline)/1/0.16 ratio at baseline)] + 100.
Statistical analysis
The amounts of pre-/postsynaptic inhibition and post-activation depression were averaged among subjects for each time epoch (0–10, 11–20, 21–30, 31–40, 41–50, 51–60 and 61–70 min). A two-way repeated-measures analysis of variance (ANOVA, control vs. furosemide as the within-subject factor) was used to examine the effects of furosemide on pre-/postsynaptic inhibitions or post-activation depression. A post hoc pairwise comparison was performed using Tukey's HSD test.
A one way repeated-measure ANOVA on time epoch (0–10, 11–20, 21–30, 31–40, 41–50, 51–60 and 61–70 min) was also used to determine the impact of time in the control experiment.
For dose-dependent experiments, an a priori power analysis was first performed to determine the minimal sample size. A posteriori, all our data sets were, as assumed in our power analysis, normally distributed and successfully passed the equality of variance test so parametric tests (one way repeated-measures ANOVA) was employed.
Significance was taken at P < 0.05. Mean data are provided ± SEM.
Results
Effects of time on two examples of spinal inhibitory networks
Presynaptic inhibition of Ia fibres
The amount of presynaptic inhibition in the control experiments (without furosemide) observed over 70 min is shown in Fig. 2A (19 subjects). A one-way repeated-measures ANOVA failed to detect a significant effect of time on presynaptic inhibition in control experiments (P > 0.05).
Figure 2. Time courses of the modifications of presynaptic inhibition and postsynaptic inhibition presented over time in the control experiments.
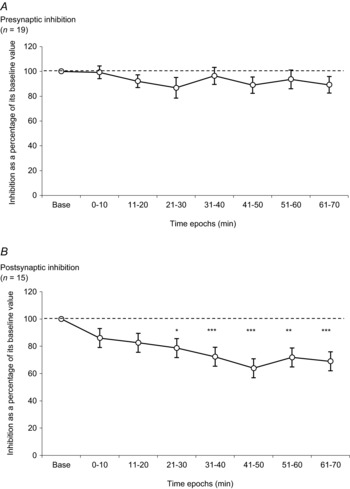
A, amount of presynaptic inhibition is plotted against the eight time epochs (baseline, 0–10, 11–20, 21–30, 31–40, 41–50, 51–60 and 61–70 min). The dotted line represents the baseline value for presynaptic inhibition. B, amount of postsynaptic inhibition is plotted against the eight time epochs (baseline, 0–10, 11–20, 21–30, 31–40, 41–50, 51–60 and 61–70 min). The dotted line represents the baseline value for postsynaptic inhibition. Asterisks indicate significant differences between inhibition in the baseline and inhibition observed in time epochs. The results were significant at *P < 0.05, ** P < 0.01 and ***P < 0.001. All results are expressed as mean ± SEM. n = number of participants.
Postsynaptic inhibition induced by cutaneous stimulation
The experiments were performed in all 19 subjects but this type of spinal synaptic inhibition could not be demonstrated in four of them as the conditioning stimulus intensity required to evoke postsynaptic inhibition was above that evoking an unbearable painful sensation and/or triggered the flexor reflex in these subjects. The results from postsynaptic inhibition were thus observed in only 15 subjects. The amount of postsynaptic inhibition in the control experiments observed over 70 min is shown in Fig. 2B. There was a gradual decrease of inhibition over time in control experiments (F14,98 = 8.56, P < 0.001, one way repeated-measure ANOVA). The amounts of postsynaptic inhibition decreased progressively after the onset of the recordings and the decrease was statistically significant from 21–30 min up to 61–70 min (baseline vs. 21–30 min, baseline vs. 31–40 min, baseline vs. 41–50 min, baseline vs. 51–60 min, and baseline vs. 61–70 min (P < 0.05, P < 0.001, P < 0.001, P < 0.01 and P < 0.001, respectively, Tukey test)).
Furosemide effects on the two spinal inhibitory networks
Presynaptic inhibition
The comparison between variations of the amount of presynaptic inhibition (expressed as a percentage of its baseline value) in control and furosemide experiments is shown in Fig. 3A (19 subjects). The amounts of presynaptic inhibition in the furosemide experiments start to be significantly different from that observed in control situation at 31–40 min after drug administration. The amount of presynaptic inhibition following furosemide decreased progressively and reached its nadir at 61–70 min (60.66% of its baseline value). Two-way repeated-measures ANOVA detected a significant interaction of condition (control vs. furosemide), time epochs and condition × time epochs (F18,108 = 2.40, Pcondition = 0.037, Ptime epochs < 0.001, P condition × time epochs = 0.032). Post hoc analysis showed that furosemide significantly reduced presynaptic inhibition at 31–40, 41–50, 51–60 and 61–70 min (P < 0.05, P < 0.05, P < 0.01 and P < 0.01, respectively, Tukey test).
Figure 3. Time courses of the effects of furosemide on presynaptic inhibition of Ia fibres (A) and postsynaptic inhibition (B).
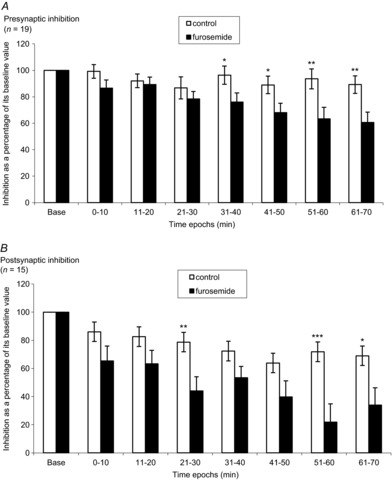
Mean (±SEM) presynaptic inhibition values (A) and postsynaptic inhibition values (B) expressed as a percentage of the baseline value over time (baseline, 0–10, 11–20, 21–30, 31–40, 41–50, 51–60 and 61–70 min) in control and furosemide. Asterisks indicate statistically significant differences between control and furosemide. The results were significant at *P < 0.05, **P < 0.01 and ***P < 0.001. n = number of participants.
Postsynaptic inhibition
The comparison between variations of postsynaptic inhibition (expressed as a percentage of its baseline value) in control and furosemide experiments are presented in Fig. 3B (15 subjects). The strength of postsynaptic inhibition decreased progressively after furosemide administration. The amounts of postsynaptic inhibition in the furosemide experiments began to be significantly different from those observed in control experiments 21–30 min after drug administration. The amount of postsynaptic inhibition then decreased continuously and reached its nadir at 51–60 min (21.88% of its baseline value). Two-way repeated-measures ANOVA detected a significant interaction of condition (control vs. furosemide), time epochs and condition × time epochs (F14,84 = 3.43, Pcondition = 0.034, Ptime epochs < 0.001, P condition × time epochs = 0.004). Post hoc analysis showed that furosemide significantly reduced postsynaptic inhibition at 21–30, 51–60 and 61–70 min (P < 0.01, P < 0.001, and P < 0.05, respectively, Tukey test).
Furosemide effects on monosynaptic excitatory transmission
Post-activation depression
This supplementary experiment was performed after the study of pre- and postsynaptic inhibitions was completed. Fifteen subjects of the previous recording participated in this session (see Table 1). The comparison between variations of post-activation depression (expressed as a percentage of its baseline value) in control and furosemide experiments, observed in 15 subjects, is shown in Fig. 4A. A two-way repeated-measures ANOVA failed to detect a significant interaction of condition × time epochs: P > 0.05. There was no significant difference between two groups (control vs. furosemide).
Table 1.
Individual values (not normalised) of pre- and postsynaptic inhibition reported as a percentage of amplitude of unconditioned H-reflex, and values of post-activation depression (not normalised) reported as 1/0.16 ratio recorded at baseline and during the period 40–70 min
| Presynaptic (control) | Presynatic (furosemide) | Postsynaptic (control) | Postsynaptic (furosemide) | Post-activation depression (control) | Post-activation depression (furosemide) | ||||||||||
|---|---|---|---|---|---|---|---|---|---|---|---|---|---|---|---|
| Sex (F/M) | Age (years) | Side (L/R) | Baseline | 40–70 min | Baseline | 40–70 min | Baseline | 40–70 min | Baseline | 40–70 min | Baseline | 40–70 min | Baseline | 40–70 min | |
| 1 | F | 64 | L | 29.60 | 15.09 | 22.42 | 0.01 | 28.71 | 12.87 | 19.5 | −5.73 | 56.23 | 32.94 | 72.05 | 49.33 |
| 2 | F | 32 | R | 23.53 | 24.26 | 19.68 | 4.82 | 21.95 | 21.75 | 14.68 | 4.47 | 37.84 | 63.70 | 26.77 | 36.77 |
| 3 | M | 26 | R | 36.33 | 38.67 | 44.26 | 45.52 | 25.85 | 10.26 | 17.30 | 6.37 | 48.13 | 43.46 | 49.01 | 55.15 |
| 4 | F | 50 | R | 47.38 | 39.89 | 23.54 | 14.27 | 14.10 | 19.50 | 26.12 | 19.04 | 31.36 | 35.51 | 31.74 | 42.56 |
| 5 | M | 34 | R | 18.90 | 8.08 | 25.63 | 14.31 | 23.38 | 9.69 | 24.34 | 4.73 | 13.54 | 21.68 | 22.31 | 21.18 |
| 6 | F | 40 | R | 30.69 | 6.12 | 24.30 | 21.46 | 1.50 | −6.01 | 12.50 | –8.48 | 40.93 | 43.36 | 39.19 | 54.87 |
| 7 | F | 45 | R | 24.21 | 26.54 | 16.67 | 3.76 | — | — | — | — | 56.30 | 41.62 | 41.47 | 39.25 |
| 8 | M | 52 | R | 37.79 | 40.80 | 28.70 | 19.01 | 14.64 | 10.31 | 18.79 | 10.33 | — | — | — | — |
| 9 | M | 29 | R | 19.44 | 12.70 | 38.74 | 39.15 | 33.67 | 18.47 | 31.03 | 28.82 | 42.15 | 56.59 | 46.23 | 52.07 |
| 10 | F | 31 | R | 29.34 | 32.73 | 41.95 | 39.27 | 30.89 | 21.18 | 28.95 | 26.18 | 72.27 | 87.81 | 65.03 | 66.54 |
| 11 | M | 32 | R | 31.29 | 28.18 | 41.22 | 19.18 | — | — | — | — | — | — | — | — |
| 12 | M | 37 | R | 12.79 | 15.00 | 30.20 | 16.80 | — | — | — | — | 42.87 | 42.68 | 46.58 | 39.65 |
| 13 | M | 22 | R | 14.54 | 7.33 | 14.89 | 16.18 | 32.28 | 18.42 | 19.96 | 11.33 | 64.66 | 74.56 | 74.45 | 66.94 |
| 14 | M | 39 | R | 49.62 | 36.27 | 32.22 | 35.66 | 55.53 | 55.15 | 32.22 | 35.66 | 29.15 | 49.85 | 41.84 | 45.99 |
| 15 | F | 25 | R | 31.14 | 25.23 | 15.57 | 7.02 | 1.52 | −1.63 | 6.91 | 1.20 | 74.54 | 51.55 | 41.93 | 51.36 |
| 16 | F | 25 | R | 22.78 | 27.38 | 33.23 | 14.00 | 54.34 | 57.42 | 29.78 | 16.90 | — | — | — | — |
| 17 | F | 25 | R | 17.48 | 17.47 | 11.06 | 5.36 | 21.28 | 6.55 | 6.85 | –0.08 | 47.82 | 62.05 | 61.98 | 67.75 |
| 18 | M | 23 | R | 33.17 | 34.87 | 28.50 | 31.87 | — | — | — | — | 69.01 | 82.12 | 65.54 | 80.57 |
| 19 | M | 35 | R | 46.75 | 45.06 | 14.74 | 7.13 | 30.34 | 14.57 | 27.33 | 4.38 | — | — | — | — |
—, Not recorded.
Individual values (not normalised to baseline) of pre- and postsynaptic inhibition and of post-activation depression recorded at baseline and during the 40–70 min period are shown in Table 1. Note that three subpools at the intervals with the most prominent effects (41–50, 51–60 and 61–70 min) were pooled in Table 1.
Effects of two different doses of furosemide
For dose-dependent experiments, an a priori power analysis was performed to determine the minimal sample size. Given that postsynaptic inhibition decreased over time (i.e. habituation, see above), the power analysis was performed on presynaptic inhibition only. A sample size of six subjects, each having 0, 20 or 40 mg of furosemide, provided 80% power to detect a 40% change in presynaptic inhibition (one-way repeated-measures ANOVA, two-tailed 5%). This calculation was made assuming that raw data are approximately normally distributed with a standard deviation of 10%. One-way repeated-measures ANOVA was then employed.
Presynaptic inhibition
The effects of two different doses of furosemide were studied on presynaptic inhibition in six subjects (Fig. 5A). The bar chart shows the amount of presynaptic inhibition at different doses observed over a period of 40–70 min after furosemide administration where the effects were mostly observed (see Fig. 3A). A one-way repeated-measures ANOVA detected a significant dose-effect (F5,10 = 13.67, P = 0.001). A post hoc Tukey test revealed significant differences between 0 and 40 mg, and 20 and 40 mg (P < 0.01 and P < 0.01, respectively).
Figure 5. Dose–effect relationships on presynaptic inhibition of Ia fibres (A) and postsynaptic inhibition (B).
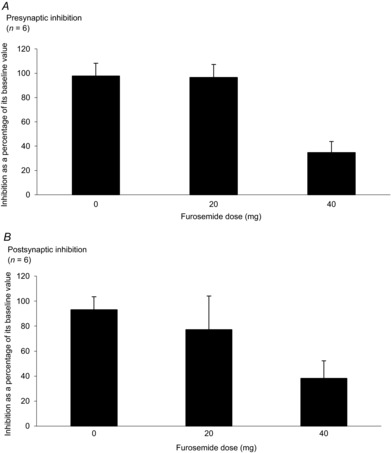
Mean (±SEM) relative inhibitions expressed as a percentage of its control value at 40–70 min after drug administration in the control group (0 mg furosemide), 20 mg furosemide group and 40 mg furosemide group. n = number of participants.
Postsynaptic inhibition
The effects of two different doses of furosemide administration were studied on postsynaptic inhibition in six subjects (Fig. 5B). The bar chart shows the amount of postsynaptic inhibition at different doses observed over 40–70 min after furosemide administration. There was a trend for a dose effect in postsynaptic inhibition as observed in presynaptic inhibition. However, a one-way repeated-measures ANOVA failed to detect a significant dose effect on postsynaptic inhibition (P > 0.05). As time has an influence on postsynaptic inhibition, the effect of furosemide evaluated at 40–70 min could be confounded with this time effect.
Discussion
The main finding of the present study is that oral administration of furosemide at the usual clinical dose (40 mg) decreases the function of inhibitory synapses in the spinal cord without affecting muscle afferent-evoked excitation of motoneurons.
Spinal networks involved in the present study
We have chosen to assess presynaptic inhibition directed to soleus Ia fibres using D1 inhibition. Presynaptic inhibition of Ia fibres was first described by Frank & Fuortes (1957) as a depression of a monosynaptic EPSP occurs without any change in motoneuron membrane potential. It was then extensively studied by Eccles et al. (1964) and Rudomin and colleagues (for references, see Rudomin & Schmidt, 1999). There is a general agreement that the pathways mediating presynaptic Ia inhibition involve two interneurons, where the last order interneuron is GABAergic. The D1 inhibition was first described in humans by Mizuno et al. (1971). Berardelli et al. (1987) and Faist et al. (1996) subsequently showed in both upper and lower limbs that the antagonistic conditioning volley eliciting the D1 inhibition was not depressing the motor evoked potential elicited in the target muscle by cortical stimulation. It is therefore likely that the D1 inhibition is presynaptic in origin as postsynaptic inhibition should depress the monosynaptic H-reflex and also the motor evoked potential. The time interval between conditioning and test stimuli used to evoke the D1 inhibition was proposed by Faist et al. (1996), who demonstrated that at this specific time interval (21 ms), the inhibition of the soleus H reflex is due only to presynaptic inhibition acting on soleus Ia afferents.
Among the postsynaptic effects induced in the soleus motoneurons, the inhibition elicited by electrical stimulation of sural cutaneous afferents, which is a part of the withdrawal reflex (for references see Pierrot-Deseilligny & Burke, 2012), is one of the most robust reflexes in animals and humans. In humans, the amount of this inhibition is marked (around 40% of the unconditioned reflex; Pierrot-Deseilligny et al. 1973). Neurotransmitter involvement in this type of spinal inhibitory network has never been directly demonstrated; however, postsynaptic inhibition has been shown to be mediated by glycine in the cat spinal motoneuron (Curtis et al. 1967).
To study postsynaptic inhibition induced by cutaneous stimulation, we have used the protocol originally described by Hugon & Bathien (1967). The conditioning stimulus was a train of 17 shocks, as it has been shown that cutaneous stimulation-induced responses require temporal summation. Later, Burke et al. (1991) and Nielsen et al. (1997) presented evidence that the cutaneous effect induced in the lower limb with latency shorter than 70 ms is spinal in origin. Their results are also supported by the fact that the cutaneous effect exists in spinal animals and complete spinal cord lesions in humans (Longchampt & Chanelet, 1968; Logigian et al. 1999). Put together, although the exact pattern of the spinal reflexes fed by cutaneous afferents is not completely known, we favour the hypothesis that the effects are spinal in origin. Post-activation depression was chosen to test the possible effect of furosemide on excitatory effects as it has been thought to reflect the efficiency of the monosynaptic excitatory transmission between Ia fibre and motoneuron, which is an example of a pure excitatory effect. Alternative possibilities to test pure excitatory effects should be either homonymous or heteronymous monosynaptic facilitation of the soleus H-reflex. However, homonymous monosynaptic facilitation cannot be used in humans to assess purely excitatory effects, due to several factors, for example the mixed excitatory and inhibitory actions and duration of after-hyperpolarisation. Heteronymous monosynaptic Ia facilitation from the quadriceps to the soleus requires accurate determination of the time interval between the conditioning and test stimulus to ensure its monosynaptic origin (for references, see Pierrot-Deseilligny & Burke, 2012). For other excitatory pathways, for example group II disynaptic excitatory pathways, the indirect method we used cannot eliminate possible contamination by monosynaptic afferent projections or by inhibitory projections involved in the pathway. Moreover, testing group II excitatory pathways at rest relying on the use of the quadriceps H-reflex is not as easy as evoking the H-reflex in the soleus muscle and group II excitatory effects are much larger in the standing than in the sitting position.
Changes in inhibitory synapses over time
Habituation is a gradual decrease in responsiveness following repetitive stimulation and is a well-known phenomenon in the nervous system (Harris, 1943; Hernández-Peón et al. 1956). Most studies report habituation as a reduction in excitatory response, for example a decrease in the flexor reflex (Farel et al. 1973) or failure of the C-fibre evoked response in a dorsal horn neuron following prolonged stimulation (Woolf, 1983). However, it has also been referred to as a reduction in inhibition response. In the decerebrate cat, intracellular recording of motoneurons participating in the flexion reflex revealed that there was a marked and significant decrease of PSP amplitude during habituation, which contains not only the EPSP's habituate but also decrements of IPSP components. The IPSPs of polysynaptic responses decrease rather than increase during habituation, suggesting that the amount of postsynaptic inhibition on the motoneuron is also ‘habituating’ (i.e. decreasing). Besides, the decrease in response during habituation was proposed to be a result of reduced input to motoneurons occurring in interneurons (Brazier, 1961, p. 384). Habituation can be observed in patients with complete spinal cord injury, suggesting that this phenomenon may occur partly or totally at the spinal cord level (Dimitrijevic & Nathan, 1970; Dimitrijevic et al. 1972). The mechanisms underlying habituation in humans remain unclear; however, psychological adaptation of subjects, and also the effects of sensory saturation, could be taken into account (see Dincklage et al. 2013). The experiments performed in this study lasted up to 70 min and the same electrical stimuli were repeated at 0.33 Hz throughout. It could thus be argued that changes in inhibitory spinal network excitability were due to a habituation effect, not furosemide. To exclude this hypothesis, we performed control experiments without furosemide in the same participants. No changes were observed over time for presynaptic inhibition of Ia fibres without furosemide (see Fig. 2A). This finding demonstrates that changes in presynaptic inhibition following furosemide intake are probably due to the effects of furosemide. In the case of postsynaptic inhibition, there was a gradual decrease of inhibition over time in control experiments, revealing that habituation may involve the function of cutaneous receptors or synapses interposed between afferent fibres and soleus motoneurons. The diminution of postsynaptic inhibition after furosemide administration is more pronounced compared with control (see Fig. 3B), probably caused by furosemide even though the difference is not statistically significant for all epochs.
Together, our results suggest that furosemide is at least partly responsible for the decrease of the efficacy of pre- and postsynaptic inhibition of soleus motoneurons. This is also supported by the significant dose–effect relationship for presynaptic inhibition and by the tendency of dose-related changes in postsynaptic inhibition (Fig. 5).
Specific effects of furosemide on spinal inhibitory synapses
Although furosemide is known from animal experiments to block cation-chloride co-transporters, its effects on the human spinal network have not previously been tested. We can thus ask whether the effects demonstrated for inhibitory synapses are specific to GABAergic and glycinergic synapses, or if they are non-specific, affecting both inhibitory and excitatory synapses. The results obtained from the experiments testing the effects of furosemide on post-activation depression at the Ia fibre–motoneuron (an excitatory synaptic transmission) allow us to exclude the hypothesis that furosemide also acts on the Ia afferent–motoneuron synapse. There was no significant difference observed in post-activation depression between control and furosemide experiments. Together, these observations suggest strongly that furosemide decreases the functioning of spinal inhibitory synapses. Although furosemide decreases both pre- and postsynaptic inhibition, the effect of furosemide seems to be more important for postsynaptic than for presynaptic inhibition. The most likely explanation for the difference between the time courses of pre- and postsynaptic inhibition is that in the control condition (without furosemide), there was no systematic change over time for presynaptic inhibition (Fig. 2A) while the amount of postsynaptic inhibition progressively decreases over time (Fig. 2B). This effect of time by itself on postsynaptic inhibition is interpreted above with respect to habituation. Thus, for postsynaptic inhibition, the inhibition following furosemide intake is the sum of habituation effects and the effect of furosemide itself, while the changes of presynaptic inhibition following furosemide intake are only due to furosemide. Another explanation may be that the kinematics of pre- and postsynaptic inhibition are different; however, to our knowledge, there is no evidence to support this hypothesis.
The possible effects of furosemide are not restricted to the spinal cord, but may affect all structures of the CNS, and thus the functioning of networks projecting on interneurons mediating pre- and postsynaptic inhibition. However, as it has been shown in animals that furosemide decreases IPSPs without modifying EPSPs (Nicoll, 1978), the possible effect of furosemide on these networks would be a decrease in inhibitory controls. A decrease in inhibitory controls acting on pre- and postsynaptic inhibition would result in an increase in the efficiency of these inhibitory pathways and thus cannot in all likelihood be responsible for the decrease of inhibition we observed.
Furosemide is known to inhibit in a non-competitive fashion GABA and glycine receptor channels mainly through antagonism of the cation-chloride co-transport system, but this drug also modulates the extracellular space involving, for example, electrical resistance of nervous tissue, extracellular ionic concentration or local ephaptic coupling (Hochman, 2012). Thus, if furosemide modulates the extracellular space, the possibility exists that it would change the distribution of current applied by the transcutaneous electrical conditioning stimuli applied to the peripheral nerves. Therefore, we have verified that the direct motor response evoked in the TA following stimulation of the CPN was not modified during the experiments (data not shown), suggesting that there is probably no change in the distribution of current induced by furosemide. Clearly, the sites of electrical stimuli are far from the spinal cord but the absence of changes in the TA motor response was the only available data in our experiments to test this hypothesis.
Methodological significance and clinical implications
In humans, available methods to study spinal cord networks are indirect and rely on EMG recordings that operate as a window on motoneuron and interneuron excitability (Pierrot-Deseilligny & Burke, 2012). Since the pioneering experiments in humans by Magladery et al. (1951) and Paillard (1955), electrophysiological non-invasive but selective methods have been developed to study the excitability of spinal networks. Recent results obtained in animals show that lesioning of the spinal cord induces a down-regulation of KCC2, which reverses the inhibitory pattern of GABAergic and glycinergic neurons back towards their immature and excitatory state (Jean-Xavier et al. 2006). This raises the possibility of setting up a technique that would allow us to determine if such a reversal also exists in patients with spinal cord injury (SCI). The specific effects of furosemide on spinal inhibitory synapses demonstrated here provide a window on the intrinsic functioning of inhibitory synapses mediated through cation-chloride co-transporters. If SCI in humans shows a down-regulation of KCC2 as observed in animal studies, the comparison of furosemide effects on spinal inhibitory synapse excitability in healthy subjects and SCI patients would allow us to study these effects.
Furosemide is observed to decrease presynaptic inhibition directed to soleus Ia fibres and postsynaptic inhibition directed to soleus motoneurons in the present study. The question may arise as to whether prolonged intake of furosemide would affect daily life or physical activity of people. Exaggerated reflexes or increase in muscle tone have not been reported as side effects of furosemide. However, to our knowledge, no systematic study of exaggerated reflexes or muscle tone has been performed during prolonged furosemide treatment. None of the healthy volunteers who participated in our experiments reported changes in reflexes or muscle tone following a single dose of furosemide administration. We may thus assume that in people with normal functioning of inhibitory synapses, the effects of furosemide have no clinical consequences. However, this may be different in patients with modifications of the functioning of inhibitory synapses. If the down-regulation of KCC2 in spinal rats (Boulenguez et al. 2010) is also present in patients with SCI, it would be interesting to explore the possible muscle tone changes following prolonged furosemide treatment.
In conclusion, furosemide, which is a well tolerated and widely used diuretic, has an effect on spinal inhibitory synapses in healthy subjects. The use of this loop diuretic would be a very useful tool to explore the possibility of whether the reduced inhibitory interneuronal activity which probably contributes to spasticity also exists in humans with SCI.
Acknowledgments
We thank Dr Jacques Rottembourg for the use of furosemide, and Max Westby (PhD) and Nachiket Nadkarni (PhD) for review of the manuscript.
Glossary
- CPN
common peroneal nerve
- EMG
electromyographic
- EPSP
excitatory postsynaptic potential
- Hmax
maximum H-reflex response
- IPSP
inhibitory postsynaptic potential
- KCC2
K–Cl cotransporter 2
- Mmax
maximum motor response
- MT
motor threshold
- NKCC1
Na–K–Cl cotransporter 1
- PT
perception threshold
- PTN
posterior tibial nerve
- SCI
spinal cord injury
- SEM
standard error of the mean
- TA
tibialis anterior
Additional information
Competing interests
None declared.
Author contributions
W.K.: conception and design of experiments, collection, analysis and interpretation of data, preparation of figures, drafting and critical revision of the manuscript. A.L.: conception and design of experiments, collection, analysis and interpretation of data, preparation of figures, drafting and critical revision of the manuscript. R.K.: conception and design of experiments, drafting and critical revision of the manuscript. B.B.: conception and design of experiments, and critical revision of the manuscript. D.J.: conception and design of electrophysiology experiments. J.L.: conception and design of experiments, interpretation of data, critical revision of the manuscript. N.R.: conception and design of experiments, interpretation of data, critical revision of the manuscript. All authors approved the final version of the manuscript, all persons designated as authors qualify for authorship, and all those who qualify for authorship are listed.
Funding
This work was supported by grants from ANR (FIHSC 2013–2014), APHP (Hemipleg P070804), MESR (Er 6 UPMC) and CICIT 805. J.-C.L. is supported by a post-doctoral fellowship from FRM (SPF20101221068).
References
- Aymard C, Katz R, Lafitte C, Lo E, Pénicaud A, Pradat-Diehl P, Raoul S. Presynaptic inhibition and homosynaptic depression: a comparison between lower and upper limbs in normal human subjects and patients with hemiplegia. Brain. 2000;123:1688–1702. doi: 10.1093/brain/123.8.1688. [DOI] [PubMed] [Google Scholar]
- Ben-Ari Y. Excitatory actions of GABA during development: the nature of the nurture. Nat Rev Neurosci. 2002;3:728–739. doi: 10.1038/nrn920. [DOI] [PubMed] [Google Scholar]
- Berardelli A, Day BL, Marsden CD, Rothwell JC. Evidence favouring presynaptic inhibition between antagonist muscle afferents in the human forearm. J Physiol. 1987;391:71–83. doi: 10.1113/jphysiol.1987.sp016726. [DOI] [PMC free article] [PubMed] [Google Scholar]
- Boulenguez P, Liabeuf S, Bos R, Bras H, Jean-Xavier C, Brocard C, Stil A, Darbon P, Cattaert D, Delpire E, Marsala M, Vinay L. Down-regulation of the potassium-chloride cotransporter KCC2 contributes to spasticity after spinal cord injury. Nat Med. 2010;16:302–307. doi: 10.1038/nm.2107. [DOI] [PubMed] [Google Scholar]
- Branch RA, Homeida M, Levine D, Roberts CJ. Pharmacokinetics of frusemide related to diuretic response [proceedings] Br J Pharmacol. 1976;57:442P–443P. [PMC free article] [PubMed] [Google Scholar]
- Branch RA, Roberts CJ, Homeida M, Levine D. Determinants of response to frusemide in normal subjects. Br J Clin Pharmacol. 1977;4:121–127. doi: 10.1111/j.1365-2125.1977.tb00682.x. [DOI] [PMC free article] [PubMed] [Google Scholar]
- Brazier MAB. Brain Function. Vol. 2. San Francisco: University of California Press; 1961. [Google Scholar]
- Burke D, Dickson HG, Skuse NF. Task-dependent changes in the responses to low-threshold cutaneous afferent volleys in the human lower limb. J Physiol. 1991;432:445–458. doi: 10.1113/jphysiol.1991.sp018393. [DOI] [PMC free article] [PubMed] [Google Scholar]
- Crone C, Hultborn H, Mazières L, Morin C, Nielsen J, Pierrot-Deseilligny E. Sensitivity of monosynaptic test reflexes to facilitation and inhibition as a function of the test reflex size: a study in man and the cat. Exp Brain Res. 1990;81:35–45. doi: 10.1007/BF00230098. [DOI] [PubMed] [Google Scholar]
- Crone C, Nielsen J. Methodological implications of the post activation depression of the soleus H-reflex in man. Exp Brain Res. 1989;78:28–32. doi: 10.1007/BF00230683. [DOI] [PubMed] [Google Scholar]
- Curtis DR, Hösli L, Johnston GaR. Inhibition of spinal neurones by glycine. Nature. 1967;215:1502–1503. doi: 10.1038/2151502a0. [DOI] [PubMed] [Google Scholar]
- Dincklage F, Olbrich H, Baars JH, Rehberg B. Habituation of the nociceptive flexion reflex is dependent on inter-stimulus interval and stimulus intensity. J Clin Neurosci. 2013;20:848–850. doi: 10.1016/j.jocn.2012.07.013. [DOI] [PubMed] [Google Scholar]
- Dimitrijević MR, Faganel J, Gregorić M, Nathan PW, Trontelj JK. Habituation: effects of regular and stochastic stimulation. J Neurol Neurosurg Psychiatry. 1972;35:234–242. doi: 10.1136/jnnp.35.2.234. [DOI] [PMC free article] [PubMed] [Google Scholar]
- Dimitrijević MR, Nathan PW. Studies of spasticity in man. 4. Changes in flexion reflex with repetitive cutaneous stimulation in spinal man. Brain. 1970;93:943–968. doi: 10.1093/brain/93.4.743. [DOI] [PubMed] [Google Scholar]
- Eccles JC. The Physiology of Synapses. Berlin: Springer Verlag; 1964. [Google Scholar]
- Faist M, Dietz V, Pierrot-Deseilligny E. Modulation of presynaptic inhibition of Ia afferents during human gait. Exp Brain Res. 1996;109:441–449. doi: 10.1007/BF00229628. [DOI] [PubMed] [Google Scholar]
- Farel PB, Glanzman DL, Thompson RF. Habituation of a monosynaptic response in vertebrate central nervous system: lateral column motoneurone pathway in isolated frog spinal cord. J Neurophysiol. 1973;36:1117–1130. doi: 10.1152/jn.1973.36.6.1117. [DOI] [PubMed] [Google Scholar]
- Frank K, Fuortes MGF. Presynaptic and postsynaptic inhibition of monosynaptic reflexes. Fed Proc. 1957;16:39–40. [Google Scholar]
- Gillen CM, Brill S, Payne JA, Forbush B., 3rd Molecular cloning and functional expression of the K–Cl cotransporter from rabbit, rat, and human. A new member of the cation-chloride cotransporter family. J Biol Chem. 1996;271:16237–16244. doi: 10.1074/jbc.271.27.16237. [DOI] [PubMed] [Google Scholar]
- Haglund MM, Hochman DW. Furosemide and mannitol suppression of epileptic activity in the human brain. J Neurophysiol. 2005;94:907–918. doi: 10.1152/jn.00944.2004. [DOI] [PubMed] [Google Scholar]
- Harris JD. Habituatory response decrement in the intact organism. Psychol Bull. 1943;40:385–422. [Google Scholar]
- Hernandez-Péon R, Scherrer H, Jouvet M. Modification of electric activity in cochlear nucleus during attention in unanesthetized cats. Science. 1956;123:331–332. doi: 10.1126/science.123.3191.331. [DOI] [PubMed] [Google Scholar]
- Hochman DW. Normal and aberrant structure of neurons and glia: the extracellular space and epileptic activity in the adult brain: explaining the antiepileptic effects of furosemide and bumetanide. Epilepsia. 2012;53:18–25. doi: 10.1111/j.1528-1167.2012.03471.x. [DOI] [PMC free article] [PubMed] [Google Scholar]
- Hübner CA, Stein V, Hermans-Borgmeyer I, Meyer T, Ballanyi K, Jentsch TJ. Disruption of KCC2 reveals an essential role of K-Cl cotransport already in early synaptic inhibition. Neuron. 2001;30:515–524. doi: 10.1016/s0896-6273(01)00297-5. [DOI] [PubMed] [Google Scholar]
- Hugon M, Bathien N. [Effect of stimulation of the sural nerve on various monosynaptic reflexes in man] J Physiol (Paris) 1967;59:244. [PubMed] [Google Scholar]
- Hultborn H. Modulation of transmitter release from Ia afferents by their preceding activity – a ‘postactivation depression’. In: Rudomin PM, Romo R, Mendell L, Nielsen JB, editors. Presynaptic Inhibition and Neural Control. New York: Oxford University Pres; 1998. pp. 178–191. [Google Scholar]
- Jankowska E. Interneuronal relay in spinal pathways from proprioceptors. Prog Neurobiol. 1992;38:335–378. doi: 10.1016/0301-0082(92)90024-9. [DOI] [PubMed] [Google Scholar]
- Jean-Xavier C, Pflieger J-F, Liabeuf S, Vinay L. Inhibitory postsynaptic potentials in lumbar motoneurons remain depolarizing after neonatal spinal cord transection in the rat. J Neurophysiol. 2006;96:2274–2281. doi: 10.1152/jn.00328.2006. [DOI] [PubMed] [Google Scholar]
- Kahle KT, Staley KJ, Nahed BV, Gamba G, Hebert SC, Lifton RP, Mount DB. Roles of the cation-chloride cotransporters in neurological disease. Nat Clin Pract Neurol. 2008;4:490–503. doi: 10.1038/ncpneuro0883. [DOI] [PubMed] [Google Scholar]
- Logigian EL, Plotkin GM, Shefner JM. The cutaneous silent period is mediated by spinal inhibitory reflex. Muscle Nerve. 1999;22:467–472. doi: 10.1002/(sici)1097-4598(199904)22:4<467::aid-mus7>3.0.co;2-y. [DOI] [PubMed] [Google Scholar]
- Longchampt P, Chanelet J. Analyse de l'activité des neurones médullaires impliqués dans l’élaboration du réflexe de flexion d'origine cutanée chez le chat. C R Soc Biol. 1968;162:1113–1120. [PubMed] [Google Scholar]
- Löscher W, Schmidt D. Modern antiepileptic drug development has failed to deliver: ways out of the current dilemma. Epilepsia. 2011;52:657–678. doi: 10.1111/j.1528-1167.2011.03024.x. [DOI] [PubMed] [Google Scholar]
- Magladery JW, Porter WE, Park AM, Teasdall RD. Electrophysiological studies of nerve and reflex activity in normal man. IV. The two-neurone reflex and identification of certain action potentials from spinal roots and cord. Bull Johns Hopkins Hosp. 1951;88:499–519. [PubMed] [Google Scholar]
- Meunier S, Russmann H, Simonetta-Moreau M, Hallet M. Changes in spinal excitability after PAS. J Neurophysiol. 2007;97:3131–3135. doi: 10.1152/jn.01086.2006. [DOI] [PubMed] [Google Scholar]
- Mizuno Y, Tanaka R, Yanagisawa N. Reciprocal group I inhibition of triceps surae motoneurones in man. J Neurophysiol. 1971;34:1010–1017. doi: 10.1152/jn.1971.34.6.1010. [DOI] [PubMed] [Google Scholar]
- Nicoll RA. The blockade of GABA mediated responses in the frog spinal cord by ammonium ions and furosemide. J Physiol. 1978;283:121–132. doi: 10.1113/jphysiol.1978.sp012491. [DOI] [PMC free article] [PubMed] [Google Scholar]
- Nielsen J, Petersen N, Fedirchuk B. Evidence suggesting a transcortical pathway from cutaneous foot afferents to tibialis anterior motoneurones in man. J Physiol. 1997;501:473–484. doi: 10.1111/j.1469-7793.1997.473bn.x. [DOI] [PMC free article] [PubMed] [Google Scholar]
- Paillard J. Réflexes et Régulations d’Origine Proprioceptive chez l’Homme: Etude Neuro-physiologique et Psychophysiologique. Arnette: Thèse de Sciences; 1955. [Google Scholar]
- Payne JA. Functional characterization of the neuronal-specific K-Cl cotransporter: implications for [K+]o regulation. Am J Physiol. 1997;273:C1516–1525. doi: 10.1152/ajpcell.1997.273.5.C1516. [DOI] [PubMed] [Google Scholar]
- Payne JA, Rivera C, Voipio J, Kaila K. Cation-chloride co-transporters in neuronal communication, development and trauma. Trends Neurosci. 2003;26:199–206. doi: 10.1016/S0166-2236(03)00068-7. [DOI] [PubMed] [Google Scholar]
- Pierrot-Deseilligny E, Burke DJ. The Circuitry of the Human Spinal Cord: Spinal and Corticospinal Mechanisms of Movement. 1st edn. Cambridge: Cambridge University Press; 2012. [Google Scholar]
- Pierrot-Deseilligny E, Bussel B, Sideri G, Cathala HP, Castaigne P. Effect of voluntary contraction on H-reflexes changes induced by cutaneous stimulation in normal man. EEG Clin Neurophysiol. 1973;34:185–192. doi: 10.1016/0013-4694(73)90046-1. [DOI] [PubMed] [Google Scholar]
- Rudomin P, Schmidt RF. Presynaptic inhibition in the vertebrate spinal cord revisited. Exp Brain Res. 1999;129:1–37. doi: 10.1007/s002210050933. [DOI] [PubMed] [Google Scholar]
- Russell JM. Sodium–potassium–chloride cotransport. Physiol Rev. 2000;80:211–276. doi: 10.1152/physrev.2000.80.1.211. [DOI] [PubMed] [Google Scholar]
- Takahashi T. Inhibitory miniature synaptic potentials in rat motoneurons. Proc R Soc Lond B Biol Sci. 1984;221:103–109. doi: 10.1098/rspb.1984.0025. [DOI] [PubMed] [Google Scholar]
- Tilstone WJ, Fine A. Furosemide kinetics in renal failure. Clin Pharmacol Ther. 1978;23:644–650. doi: 10.1002/cpt1978236644. [DOI] [PubMed] [Google Scholar]
- Vinay L, Jean-Xavier C. Plasticity of spinal cord locomotor networks and contribution of cation-chloride cotransporters. Brain Res Rev. 2008;57:103–110. doi: 10.1016/j.brainresrev.2007.09.003. [DOI] [PubMed] [Google Scholar]
- Woo N-S, Lu J, England R, McClellan R, Dufour S, Mount DB, Deutch AY, Lovinger DM, Delpire E. Hyperexcitability and epilepsy associated with disruption of the mouse neuronal-specific K–Cl cotransporter gene. Hippocampus. 2002;12:258–268. doi: 10.1002/hipo.10014. [DOI] [PubMed] [Google Scholar]
- Woolf CJ. C-primary afferent fibre mediated inhibition in the dorsal horn of the decerebrate-spinal rat. Exp Brain Res. 1983;51:283–290. doi: 10.1007/BF00237204. [DOI] [PubMed] [Google Scholar]
- Wu WL, Ziskind-Conhaim L, Sweet MA. Early development of glycine- and GABA-mediated synapses in rat spinal cord. J Neurosci. 1992;12:3935–3945. doi: 10.1523/JNEUROSCI.12-10-03935.1992. [DOI] [PMC free article] [PubMed] [Google Scholar]
- Yamada J, Okabe A, Toyoda H, Kilb W, Luhmann HJ, Fukuda A. Cl– uptake promoting depolarizing GABA actions in immature rat neocortical neurones is mediated by NKCC1. J Physiol. 2004;557:829–841. doi: 10.1113/jphysiol.2004.062471. [DOI] [PMC free article] [PubMed] [Google Scholar]
- Zhu L, Polley N, Mathews GC, Delpire E. NKCC1 and KCC2 prevent hyperexcitability in the mouse hippocampus. Epilepsy Res. 2008;79:201–212. doi: 10.1016/j.eplepsyres.2008.02.005. [DOI] [PMC free article] [PubMed] [Google Scholar]
- Ziskind-Conhaim L. Physiological functions of GABA-induced depolarizations in the developing rat spinal cord. Perspect Dev Neurobiol. 1998;5:279–287. [PubMed] [Google Scholar]