

1. Introduction
A progressive reduction of the spatial scale accessible by microscopes has catalyzed our increasing understanding of cells and their constituents. Light microscopy has been at the forefront of this journey, beginning in the 1600s with the first observation of cells and bacteria using a simple lens. With the advent of phase contrast and fluorescence microscopy, a second phase of visualization into the micron-scale world began, with researchers now able to discern membrane-bounded organelles and cytoskeletal elements. It was not until the advent of genetically encoded fluorescent proteins (FPs),1-4 however, that biologists could begin imaging the constituents of these structures. This marked a third phase of light-based, biological visualization. Still, because cellular structures closer together than ∼200 nm could not be resolved using these techniques due to the diffraction limit of light,5 light microscopy could not yet cross into the nanoscopic world.
Now, this frontier is finally being crossed. Recently developed light-based superresolution (SR) techniques are allowing imaging of biological structures with spatial resolutions more than an order of magnitude finer than conventional optical microscopes. This is being achieved in two ways: by spatially modulating the excitation radiation, as used by stimulated emission depletion (STED) microscopy 6 and structured illumination microscopy (SIM),7,8 and by temporally modulating the emission of individual fluorescent molecules, as used in photoactivated localization microscopy (PALM),9,10 stochastic optical reconstruction microscopy (STORM),11 and related point-localization SR imaging approaches.12,13 In this review, we discuss the second of these SR imaging techniques, focusing particularly on PALM along with some illustrative applications.
PALM relies on accurate localization of single FPs based on temporal isolation of single molecule emission, combining this precise positional information to reconstruct superresolution images. Because PALM employs genetically-encoded, photo-controllable FPs to localize single molecules 14-17, it has broad applicability for investigating the spatial organization and motion of diverse types of proteins associated with various structures and environments inside cells and tissues. Recent applications of PALM, with other point-localization SR techniques, are stimulating new testable hypothesis, refining the prevailing conceptual frameworks, and extending our understanding of mechanistic principles in biology at the nanoscale.
2. Path to development of point-localization superresolution microscopy
The development of point-localization SR imaging techniques like PALM was preceded by years of work advancing the reliable detection of single molecules. Starting in the late eighties, several groundbreaking achievements helped propel this advancement. These included: the first optical detection of single molecules embedded in a solid matrix at low temperature;18,19 the first detection of single fluorophores in solution;20 and, the imaging of isolated, single molecules at room temperature 21. These seminal works marked important advances towards studying single molecules in biological systems under physiological conditions. Further refinement of single molecule imaging protocols furnished highly sensitive single molecule assays for measuring enzymatic activity and important biological insights about various motor proteins. Key highlights from these studies included: assays for the turnover of individual ATP molecules during the mechanical work cycle of single myosin motor;22 elucidation of the step size of myosin V during motor-driven transport;23 single molecule time-lapse imaging showing that the γ-subunit of mitochondrial F1-ATPase acts like a rotary motor to mediate energy exchange between sites of proton flow and ATP synthesis;24 and, demonstration of a hand-over-hand mechanism of movement of kinesin and myosin along microtubules and actin filaments, respectively.25,26
The imaging of single molecules in these early in vitro studies involved detection of isolated, single chromophores, achieved by diluting the fluorescent molecules. Such dilution ensured the presence of a single fluorescent molecule within a diffraction-limited spot, which is the area on the detector occupied by the image of a single, isolated fluorescent molecule. This spot is also referred to as the point-spread-function (PSF) of the microscope, defined as the response of an imaging system to a point source emitter. The PSF is sensitive to the wavelength of light emitted from the molecule and is roughly 200-400 nm in radius for molecules emitting in the visible spectrum. In biological samples, obtaining sufficiently dilute molecules during imaging is difficult because proteins in cells are densely packed. In a cell expressing FPs, for example, many FPs typically exist and fluoresce within a single diffraction-limited spot so they cannot be spatially resolved. This results from the use of the same signal (i.e., fluorescence emission) to detect simultaneously excited molecules.
Researchers soon realized, however, that if the detection of signal from neighboring fluorescent molecules could be distinguished using specific optical characteristics, then it would be possible to differentiate neighboring molecules from each other because mathematical fitting of the PSF corresponding to each molecule would provide precise spatial coordinates of each molecule.27,28 This idea for circumventing the obstacle to single molecule detection imposed by diffraction and high molecule density was first proposed by Betzig,29 and was subsequently employed by others to image a few fluorescent molecules in close proximity based on properties like fluorescence emission spectra 30 and fluorescence lifetime.31 While promising, these approaches were still a long way from distinguishing the thousands of densely packed fluorescent molecules typical of images within biological specimens.
This limitation was overcome with the development of photoactivatable and photoswitchable FPs, whose fluorescence emission could be modulated by illuminating with a specific wavelength of light.14,15,32 Upon irradiation with blue light, photoactivable proteins like PAGFP are shifted from a dark to fluorescent state, while the emission of photoswitchable proteins like Eos 33 are shifted from green to red. By calibrating the illumination power of the activating blue light, the light-induced photochromism of these photocontrollable FPs can be used to selectively switch the emission profile of only a small fraction of fluorescent proteins in a sample at any given instant. Stochastically activating/photoswitching, exciting and imaging sparse subsets of these FPs ensures observation of only one molecule within a diffraction-limited spot. Because the fluorescing molecules eventually photobleach, a new subset of molecules can be activated and imaged at a later time, thus preventing the accumulation of active fluorophores in the same image frame. Multiple cycles of such photoactivation, excitation and photobleaching can be used to accumulate thousands of image frames containing isolated, single molecule images from a FP-labeled structure. By mathematically fitting the spatially isolated PSFs in each of the image frames, accurate estimations of the positions of the molecules with respect to each other can be determined, generating a superresolution image (Figs. 1-2).
Figure 1.
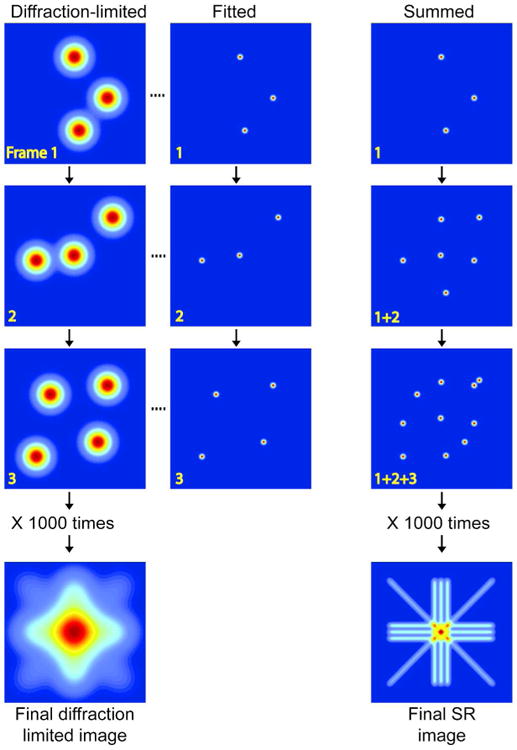
Operational principle of PALM and related pointillist superresolution microscopy techniques that rely on temporal modulation of fluorescence emission of single fluorescent molecules. Image acquisition starts with photoconversion of a sparse subset of the molecules to fluorescent state, and recording of the spatially isolated single molecule images (Frame 1, left column). Each of the single molecule images, representing the point spread function (PSF) of the microscope, is mathematically fit to precisely localize the corresponding molecule (Frame 1, center column). Following photobleaching of the fluorescing molecules, a new subset of fluorescent molecules is photoconverted, imaged and localized (Frame 2, center and left column). This sequence of photoactivation, imaging and photobleaching is repeated multiple times to precisely localize thousand of molecules. The column on the right shows the progressive build up of the pointillistic superresolution image as new localizations are added from successive cycles. The final superresolution image constructed by the synthesis of all the localizations from thousands of acquisition cycles reveal fine structural details, which are obscured in the diffraction-limited image. The reader should note that the positions of adjacent molecules along the diagonal line of the superresolution image are laterally shifted by a pixel. Thus, molecules on the diagonal lines are separated by a larger distance (√2 units compared to 1 unit) compared to those on the horizontal or vertical lines. As a consequence, the PSFs of adjacent molecules on the diagonal lines overlap to lesser extent, and the diagonal lines in the superresolution image look dimmer than the horizontal and vertical lines.
Figure 2.
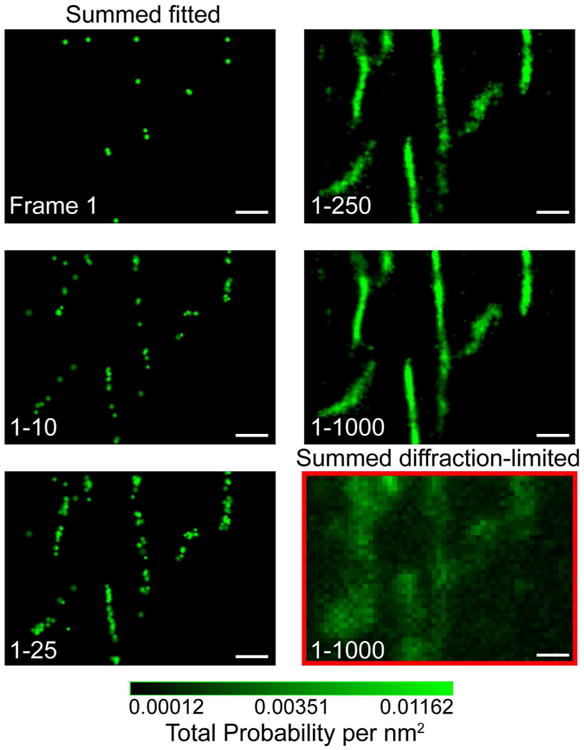
PALM imaging of mGEos labeled mitochondrial-targeting sequence (mito-mGEos) expressed in COS-7 cells. The micrographs show the step-wise, pointillistic reconstruction of individual mitochondrial elements as single molecules are imaged and localized in successive frames. The individual mitochondrial elements can be discerned only when sufficient number of single molecules is localized (sum of frames 1-250), illustrating the Shannon-Nyquist criterion for resolving structural details of biological organelles. The superresolution image constructed by integrating the precise single molecule localizations from 1000 frames clearly demonstrate the dramatic gain in resolution compared to the diffraction-limited image generated by combining the corresponding 1000 diffraction-limited images.
This concept of using the temporally adjustable emission of photocontrollable FPs to obtain single molecule localizations within densely labeled biological structures was the basis for the development of PALM in 2006.9,10 Other point-localization SR strategies based on this principle were developed concurrently or soon thereafter but employed antibodies labeled with cyanine activator and reporter dye pairs (STORM) 11 or single organic dyes (dSTORM) 12 as photocontrollable agents. Advances in imaging techniques, optics and fluorescent probes have subsequently spurred the development of an ever-expanding set of other point-localization methodologies 13,34-36 all relying on accurate localization of individual fluorescent molecules (with tens of nanometer precision), but using distinct fluorescent probes and experimental schemes to modulate the excitation and emission of closely spaced fluorescent molecules.
3. Accurately localizing single molecules in point-localization SR microscopy
Successful implementation of PALM and other point-localization SR microscopy techniques rests on the ability to precisely estimate the position of single molecules. After all, these techniques do not directly generate an image, but provide precise localization information for thousands of single fluorophores. This collection of precise positional coordinates provides the higher spatial resolution achieved by these techniques. The positional values for the localized molecules have a finite amount of uncertainty associated with them (normally tens of nanometer). This uncertainty has to be taken into account during data interpretation, especially in relation to resolving features in the image.
A single FP looks like an extended blurry spot when observed under an optical microscope. The dimensions of this blurry spot is limited by diffraction, and is ∼200 nm laterally at the shortest practical excitation wavelength (i.e., blue light). Because it represents the PSF of the microscope, the single molecule image can be approximated with a Gaussian function with the center of the Gaussian representing the center of the molecule.28,37,38 The position of the Gaussian center can be estimated with a very high degree of precision (down to a few nanometers) when sufficient numbers of photons are captured.27,28
Capturing a sufficient number of photons is critical for accurately localizing a FP in PALM and other point-localization SR approaches. This is because each photon emitted from a single fluorescing molecule provides an independent estimation of its position. With low numbers of photons emitted, the combined signal from each photon produces a PSF that is too broad to localize the molecule with high precision. The reverse holds when there are hundreds or thousands of photons emitted by the molecule. Now, precise positioning becomes possible because the certainty in determining the center of the Gaussian function describing a fluorescent molecule increases by a factor equal to the inverse square root of the total number of detected photons (localization precision ∼ σ/√N, where σ is the standard deviation of the Gaussian and N is the number of photons detected from the molecule).28 The greater the photons emitted by a fluorescent molecule, therefore, the better the precision in its position estimation.
4. Factors affecting achievable resolution in PALM
Image resolution is a measure of the spatial information content and is typically defined as the minimum distance of separation between two structural features so that they can be spatially distinguished. To recreate the details of a structure down to a specific spatial scale in the context of a PALM pointillistic image, at least two proteins (i.e., two observation points) need to be localized within a distance spanned by this spatial scale. This concept was first described by Nyquist and Shannon,39 and is commonly referred to as Nyquist sampling theory (Fig. 2). To satisfy this requirement of two localizations per resolution limit, one fluorescent protein has to be detected at least every 12.5 nanometers for achieving a resolution of 25 nm. This means the reconstructed superresolution image must have an extremely high molecular density of around 6400 molecules per square micrometer, which is not always achievable. The density of molecules, therefore, is often the limiting factor in achieving high structural resolution in PALM images. Recent advances in single molecule localization algorithms that allow precise localization of multiple fluorophores with overlapping signals 40-46 should improve the efficiency of single molecule detection within densely labeled biological structures. It should be noted that the localization precision of overlapping molecules localized within crowded diffraction spots is often less than that of single, isolated single molecules. However, even with decreased localization precision for this subset of molecules, the increased density of localized molecules afforded should facilitate the reconstruction of the structural details at higher spatial resolution.
Molecular density in a PALM image is greatly impacted by the efficiency with which fluorescent proteins are detected and localized in a structure-of-interest. Proper calibration of experimental conditions and single molecule detection algorithms are therefore crucial in determining the quality of the superresolution images. The number of fluorescently labeled proteins that are actually present in the structure can also limit the number of localizations in the final image. Insufficient sampling, either due to inefficient detection or insufficient labeling density, can furthermore introduce discontinuity in the structural details. This, in turn, can create artifacts in the reconstructed image. The resolution of a superresolution image additionally depends on the physical size of the fluorescent label: FPs are ∼3 nm in diameter and their fusion partner can add another 2-3 nm to that size. This sets a lower limit to achievable resolution in PALM. If primary and secondary antibodies are used to label the protein of interest (as in immunocytochemistry), the combined size of the two antibodies limits the resolution to ∼15 nm.
5. Choosing FPs for optimal PALM imaging
During image acquisition in PALM, a photoconvertible FP sequentially undergoes three different photophysical processes: photoconversion; emission; and photobleaching. The photophysical properties of the FP should allow controlled modulation of these three processes for optimal single molecule detection and localization (Table 1). The first process, photoconversion, must be regulated to maximize the number of single molecules detected in an image frame while ensuring that their precise localization is not compromised due to overcrowding. A high density of photoconverted FPs due to poorly regulated photoconversion leads to merging of single molecule images and increased background, requiring rejection of some of these single molecules due to poor fitting. This decreases the density of single molecules in the final superresolution image.
Table 1. Practical guide for Photoactivated Localization Microscopy.
| Nanoscale Structure | Structural Dynamics | Assembly Stoichiometry | Single Molecule Dynamics | |
|---|---|---|---|---|
| Recommended Probes: | mEOS3, tdEOS, PS-CFP2, Dendra2, KikGR, Kaede | Dronpa, mGEos, mIrisFP, rsGFP/YFP, eYFP | PS-CFP2, mEOS3, PAmCherry, PAGFP | tdEOS, mEOS3, PATagRFP, PAmCherry |
| Probe Characteristics: | High photon output per switching cycle | High photon output per switching cycle | Low degree of multiple reappearances | Long fluorescent lifetime |
| Fluorophore reappearances to ensure sufficient sampling | Reversible switching (high reappearances) | High photon output to maximize resolution | Minimal blinking on time-scales similar to or longer than frame rate | |
| Properties of Target Protein: | Present in high copy on structure of interest | Highly represented in the structure of interest | Present in statistically significant quantities | Should not induce oligomerization of fusion protein |
| Tolerance to photo-activatable/ switchable protein tagging | Preferably high turnover in the structure | Tolerance to multiple fusion proteins | Tolerance to multiple fusion proteins | |
| Data Acquisition: | Frame rate matching to fluorescence “on” times | Optimal frame rate to minimize ‘blurring’ of structure of interest | Near complete sampling of population | Low excitation power to minimize photobleaching |
| High frame numbers to sufficiently sample structure of interest | Maximize switching cycles for population | Large fields of view for high statistics | Fast frame rate to sample short time scale dynamics | |
| Maximize photon output per frame interval | Balance photon output with switching cycles |
The second process, involving emission of photons following excitation of the photoconverted FP, produces the signal used to detect the single molecule. The probability of detection of a single FP and its localization precision critically depends on the number of photons collected from the FP in excess of the background signal.28 Thus, FPs having greater photon output are better suited for such single FP detection. It should be noted that in addition to the overall photon budget, the rate of photon emission also influences the detection and localization efficiency. As mentioned above, this is because localization of a single molecule is achieved by mathematical fitting of the intensity profile (i.e., the image of the single molecule on the detector) obtained by integration of many photons emitted within a fixed interval of time spanning one image frame. Consequently, a FP with a higher photon emission rate can be localized with higher precision. High frequency blinking of photoconverted FPs (at a time scale shorter than that of an individual image frame) often adversely affects this photon emission rate by decreasing the number of productive fluorescent electronic transitions, leading to a net decrease in photon output per unit time. Optimal performance of PALM, therefore, requires use of FPs with higher molecular brightness, defined as the photon emission rate.
Photobleaching, the third process that a FP undergoes during image acquisition, performs the critical function of removing fluorescing FPs from the visible window as new FPs photconvert and fluoresce. This maintains an optimal density of fluorescing FPs in each image frame. Optimal image acquisition is achieved when a balance is struck between photobleaching and photoconversion.
In addition to photoconversion, emission and photobleaching processes, other factors impact successful PALM imaging. Background signal will significantly influence the detection and localization steps during PALM.28 PALM experiments involve detection of signal from a single photoconvertible FP molecule, which is substantially dimmer than the integrated signal from the ensemble of FPs. The background fluorescence value may be comparable to the specific signal from single FPs in these experiments, interfering with the detection process. An intrinsic photophysical parameter of the photconvertible FPs, called contrast ratio, contributes crucially to this background value.47 The contrast ratio is the ratio of photons emitted by the FP following photoconversion to those emitted before photoconversion. FPs with low contrast ratio (e.g., PAGFP) have a high background due to the contribution from the low intensity emission from unconverted neighboring FPs. This hampers the efficiency of single FP detection and degrades the localization precision. FPs with a high contrast ratio (e.g., mEos), therefore, are most effective for PALM.
Certain biochemical properties of FPs also influence their performance as probes in PALM. The detection of the protein-of-interest depends on proper folding and chromophore formation of its FP label at physiological temperatures. The maturation of the FP must occur synchronously with the folding and before trafficking of the protein under study. The topology of the FP-labeled chimeric protein can also influence the proper maturation of the FP. Certain photoconvertible FPs such as photoswitchable Cyan Fluorescent Protein 2 (PS-CFP2),48 for example, do not fold optimally when they are placed in the lumen of the ER or other intracellular organelles. Thus, PS-CFP2-labeled fusion complexes of transmembrane proteins are designed to position PS-CFP2 towards the cytoplasm.
Another consideration for selecting an appropriate photoconvertible FP for PALM is the FP's oligomerization characteristics. Many FPs have evolved to form homomeric complexes comprised of dimers and tetramers of the FP. These oligomers can perturb the fusion protein-of-interest by nucleating aggregates with altered function, by sequestering the protein in nonproductive aggregates, or by changing its dynamics. To overcome such problems, significant effort has been made to engineer monovalent fluorescent protein probe.49-51 Because such monovalent FPs are usually dimmer than their parent oligomeric forms, enhanced photon output has been achieved by engineering covalently attached tandem dimers of FP, which form intramolecular dimers and do not participate in any further oligomerization (i.e., tandem-dimer EOS, tdEos).52 Proteins that can accommodate such large FPs as fusion tags benefit from an increased localization precision due to the large photon output from the two chromophores per fusion molecule.
6. Obtaining meaningful biological information from PALM datasets
PALM generates a high-resolution map of fluorescent molecules comprised of precise localization coordinates of thousands of single molecules. These data sets require a substantial amount of post-experimental processing and analysis before meaningful biological information can be extracted from them. Only when rigorous statistical analysis of these datasets has been achieved can the spatial relationships between single FP-tagged proteins and the dynamics of these proteins be comprehended. Researchers employ different strategies for data acquisition, processing and analysis depending on whether an experiment is geared towards interrogation of nanoscale spatial organization,53,54 tracking structural movement,55 or monitoring single protein dynamics 56 (Table 1). For example, addressing structural organization benefits from dense sampling in each image frame, whereas performing single molecule tracking requires sparser sampling.
Understanding the performance level of PALM is another prerequisite for interpreting biological information. One way this can be accomplished is through imaging uniform biomolecular structures that can serve as molecular rulers. These structures can help define the performance of the superresolution microscope and method. A popular PALM structure analyzed for this purpose is the microtubule. Comprised of protein dimers that assemble into a hollow helical protofilament with a highly regular diameter of ∼25 nm (well below the diffraction limit), microtubules are an ideal performance ruler. They appear by conventional imaging like a rod-shaped structure with a diameter approximating the PSF of the microscope. Point-localization SR imaging effectively reduces the width of the microtubule image by replacing the bulk ‘point-spread’ of all molecules imaged simultaneously with single molecule sequential detection. Because the spatial position of each single molecule image is measured with higher precision compared to the PSF, the collection of these single molecule positions enables a reduction in the measured width of the microtubule. This is particularly helpful in resolving the close spatial overlap (< 200 nm) between microtubules in biological samples, which results in a blurring of individual tubules. Point-localization SR imaging in effect shrinks this blurring effect caused by the diffraction limit and can enable unambiguous tracing of closely spaced microtubule filaments (Fig. 3A). These assumptions of spatial resolution increase, however, are based upon sufficient sampling, as judged by the Nyquist-Shannon criterion 39 of individual molecules in a given area of a microtubule. Under-sampling of the underlying microtubule structure provides only highly localized single molecules, but lacks sufficient statistical information to have confidence in the dimensions of the structure. While using microtubules as biomolecular standards is useful, other cellular organelles with characteristic structures, such as mitochondria and focal adhesions, can also be used to validate spatial resolution, inform on protein labeling specificity, and other aspects of performance of the superresolution imaging setup.
Figure 3.
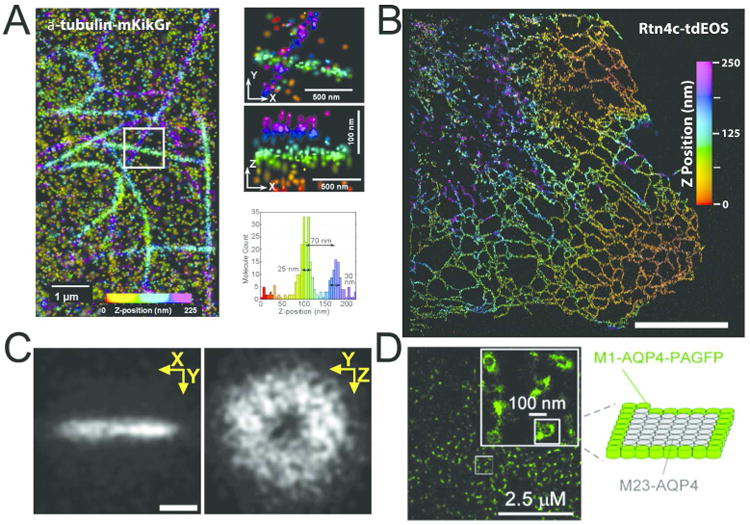
Imaging cellular structures using photoactivation localization microscopy techniques. (A) Three-dimensional (3D) reconstruction of microtubule structures using interferometric photoactivation localization microscopy (iPALM) shows the highly regular width of the microtubule structure (left panel). Overlapping microtubule structures are resolved along the optical (z) axis, highlighting the resolution performance of the iPALM method (right panels and histogram). Tubulin structures were labeled with mKikGr tagged α-tubulin and expressed in Ptk1 cells. Scale bar 200 nm. Adapted with permission from ref. 60. Copyright 2012 National Academy of Sciences. (B) iPALM reconstruction of tubulated endoplamsmic reticulum (ER) structures labeled with tdEOS tagged Rtn4c. Scale bar 1 μm. Image provided by Gleb Shtengel and Jennifer Gillette. (C) 3D reconstruction of the FtsZ disc structure in a single live E. Coli cell. Z-ring reconstruction reveals a hollow doughnut shaped organization, which closely juxtaposes the constriction plane of the membrane (not depicted). Single molecule coordinates were obtained using PALM-based acquisition and PSF astigmatism for z-position determination. Scale Bar 200 nm. Adapted with permission from ref. 71. Copyright 2012 Wiley VCH. (D) PALM image of aquaporin arrays covering a large portion of the surface of the plasma membrane. Magnified inset image shows the peripheral association of Aquaporin4-PAGFP molecules surrounding unlabeled Aquaporin subunits (model on right). Scale bar 2.5 μm, image inset 100 nm. Adapted with permission from ref. 61. Copyright 2012 The Company of Biologists.
7. Analyzing static nanoscale structures by PALM
As mentioned before, PALM and its related point-localization SR techniques do not directly generate an image, but provide precise localization information of thousands of single fluorophores. This collection of data sets provides single molecule coordinates that can be combined to reconstruct pointillistic images of subcellular structures at higher resolution than is possible with conventional optical microscopy. The resolution of such assimilated images is determined by the density of the points (representing the position of a single molecule) and can be as low as tens of nanometers. These pointillistic images can be used to study the finer structural details of steady-state architecture of organelles (Fig. 3B) and supramolecular aggregates,57,58 and to elucidate the structural dynamics of these molecular complexes over time.55
One area that has particularly benefited from “structural” PALM imaging is clarifying the nanoscale architecture of the cytoskeleton. For example, bacteria like Escherichia Coli harbor filamentous microtubule-like proteins to aid in cell division. The means by which the E. Coli microtubule-like protein FtsZ facilitates bacterial cell division, however, have been unclear. The E. Coli's size (∼1 μm in diameter) presents a challenge to directly observe subcellular organization using conventional light microscopy. Furthermore, electron microscopy (EM) approaches use harsh sample preparation of the microbial specimens and lack the molecular specificity that is necessary to interrogate specific machinery such as FtsZ filaments. To overcome these drawbacks, Fu, G. et al.,59 utilized PALM superresolution imaging to glimpse the organization states of FtsZ in intact E. Coli specimens. Expression of PAFP-tagged FtsZ in pre-divisional E. Coli cells revealed a diversity of organizational states within the same bacterial population. These diverse states shared a helical ‘Z-ring’ structure with strong FtsZ and membrane juxtaposition. The Z-ring structures differed in their helical degree and spatial organization, which the authors suggested is a result of the expression level of fluorescent protein-tagged FtsZ. Thus, the concentration of FtsZ protein produced within the cell likely regulates the organizational state and function of the Z-ring assembly.
Similar to the punctuated FtsZ structures observed in close proximity to the bacterial membrane, mammalian cells are highly reliant on an actin cytoskeleton to maintain and stabilize cell shape and scaffolding within tissues. An important linkage between the eukaryotic cytoskeleton of cells and the external world comes from focal adhesion receptors, referred to as integrins, which act to bridge extracellular matrix structures with intracellular structures such as actin. Recently, researchers employed the 3-D superresolution imaging technique called interferometric PALM (iPALM) 60 to visualize focal adhesion organization in three-dimensions.57 iPALM extracts three-dimensional coordinates from PALM data sets using interferometry.60 Images of focal adhesions acquired using iPALM revealed strong membrane deformations in the plasma membrane at sites of intimate substrate-focal adhesion contact.57 Moreover, iPALM images of integrin adaptor complexes that physically link integrins to the actin cytoskeleton at focal adhesion sites showed that the complexes were organized into ‘sandwich-like’ layers of individual protein complexes between actin fibers and the plasma membrane embedded integrin receptors.57 The high three-dimensional resolution (tens of nanometers) of iPALM made it possible to resolve these closely juxtaposed protein layers.
Although the self-organizing principles of the mammalian plasma membrane are likely guided by the cortical cytoskeleton, integral membrane protein complexes can maintain strong self-organization that is largely independent of nanoscale diffusion barriers imposed by the cytoskeleton. To explore this property, Rossi, A.M. et al., 61 visualized the self-organization of large aquaporin receptor arrays at the plasma membrane. Aquaporins play an important role in balancing cellular osmotic pressure by cycling between intracellular compartments and the plasma membrane to allow water transport through cells. Aquaporin protein 4 (AQP4) is produced by the cell as two major isoforms which self-associate and assemble with one another to create large arrays of aquaporin complexes on the cell surface. Rossi, A.M. et al. detailed the association of these isoforms and established that a specific isoform of AQP4 is required for the nanoscale shaping of aquaporin arrays on the cell surface. Superresolution imaging of this “shaping” AQP4 isoform showed a strong annular pattern around circular AQP4 arrays (Fig. 3D). This isoform was also required to maintain AQP4 circularity as overexpression of the enclosed AQP4 isoform led to a marked elongation of these arrays, an observation previously predicted by theoretical models.62
Biology is driven by interactions between constituents at the molecular level. Therefore, elucidating the spatial relationship of different molecules in the native biological context is crucial to obtain insights about how arrangement of molecules in space is coupled to biological function. Multicolor superresolution microscopy offers a promising approach to unearth such molecular relationships by mapping out the spatial distribution of multiple proteins at nanoscopic scales within the same image. Multicolor superresolution images often have sufficient spatial resolution for monitoring potential molecular interactions between differently labeled proteins. Such multicolor experiments can potentially be carried out by specifically targeting proteins of interest with distinct photocontrollable-FPs and imaging them with PALM. However, implementation of multicolor PALM is often hampered by dearth of optimal photocontrollable-FPs that can be combined to image multiple protein targets. Some of the factors that impose constraints on the choice of FPs for multicolor PALM include the limited palette of currently available photocontrollable-FPs, low contrast ratio of some of the photocontrollable-FPs, the propensity of some photocontrollable-FPs to misfold in certain cellular environments, and aggregation and mislocalization of certain proteins when tagged with photocontrollable-FPs. Initial two-color PALM experiments were performed using one of the following label-pairs: PS-CFP2-mEos2/mEos3, Dronpa-mEos2/mEos3, and PAGFP-PAmCherry.63,64 However, it was subsequently found that these probe pairs sometimes do not perform optimally when they are employed for two-color PALM. For example, PS-CFP2 does not fold properly when facing the lumen of ER, which sometimes precludes its use for two-color PALM experiments. The low contrast ratio and limited sampling of PAGFP often makes it a sub-optimal probe for PALM experiments. Tagging of proteins with mEos2 and some of the other FPs can lead to aggregation and mislocalization of the target proteins due to the FPs' tendency to dimerize at physiological concentrations. However, these obstacles to multicolor superresolution imaging, arising from FP- biochemical and photophysical properties, can be circumvented, at least in certain cases, by combining synthetic, organic dyes and photocontrollable-FPs as label-pairs. In this approach, one of the target proteins is labeled with organic dye labeled antibody, while the other protein is labeled with a spectrally distinct photocontrollable-FP. Antibody labeling should be used for target proteins that are prone to mislocalization when tagged with FPs. Labeling such proteins with organic dye-tagged antibodies prevents probe-induced aggregation and ensure their proper trafficking and localization. Use of organic dye also offers other advantages. Commonly used organic dyes (Alexa647and Cy5) usually have significantly larger photon budget than photocontrollable-FPs, and consequently, often provide better localization precision than FPs like PAGFP. Furthermore, organic dyes like Alexa647 and Cy5, with far-red emission, are spectrally distinct from the commonly used photocontrollable-FPs, whose photoconverted forms emit wither in the green or red spectral windows. Such far-red emission of organic dyes frees up the red and green channels and provides more flexibility in choosing the FP-labels, which can now be picked based on optimal photophysical properties (maximum photon budget and contrast ratio) without constraints imposed by bleed-through artifacts. These favorable factors have catalyzed the use of photocontrollable-FP/ organic dye label-pairs for multicolor superresolution imaging. One of the first examples of such a combinatorial approach used a Dronpa derivative in conjunction with Cy5 to obtain two-color superresolution images of clathrin-coated pits and microtubules.65 Subsequently, other researchers have used this approach to visualize nanoscale spatial organization of two or more proteins within biological structures. Recently, a combination of PALM and dSTORM was used to image mEos-labeled HIV Gag and Alexa647-antibody labeled HIV envelope and demonstrate that envelope recruitment to HIV assembly sites is dependent on its long cytoplasmic tail.66 These studies illustrate the usefulness of such a combined approach for visualizing multiple proteins when one particular labeling strategy cannot be used to highlight all the proteins under investigation.
With structural analysis methods ever advancing, characterization of intracellular structures using point-localization SR imaging techniques like PALM is continuing to improve. The use of single particle averaging techniques has been shown to enhance resolution by mitigating the effects of under sampling a structure-of-interest. A prime example of this is the reconstruction of components of the multicomponent nuclear pore complex using point-localization SR imaging.67,68 These studies utilized organic dyes and the dSTORM method 12 to detect the localization of NPC subunits, but their analysis methods can be directly applied to PALM and other point-localization SR imaging techniques.
8. Deciphering nanoscale structural dynamics
PALM and other point-localization SR methods are capable of imaging live specimens at the nanoscale, opening the possibility of visualizing the fine temporal dynamics of subcellular structures. This approach faces a challenge, however: it can only monitor events that occur on time scales slower than the time required to generate a superresolution image corresponding to a single time point. This is because the Shannon-Nyquist theorem 39 pertaining to spatial resolution also holds for temporal resolution. That is, if a biological structure is not sampled adequately in time then a ‘blurring’ of the temporal transitions will be observed. Point-localization SR techniques are thus limited to how fast a particular structure can be sufficiently resolved before the next time point is sampled. Currently, these techniques only allow for proper sampling of slowly moving structures within the cell (order of minutes). But, this limit is being pushed constantly through development of brighter probes and faster cameras.
The first use of PALM technology to address the nanoscale dynamics of biological structures documented focal adhesion complexes.55 Using live cells, the researchers were able to sample focal adhesion plaques to a sufficient density to observe their turnover and ‘treadmilling’ behavior. By combining the localizations of single focal adhesion probe molecules, they were able to sample these structures with ∼60 nm spatial resolution at 25 s time intervals. Optimizing the spatial and temporal sampling was critical for observing the dynamics of focal adhesion probes over the lifetime of the structure. This study demonstrated the ability of PALM to observe slowly varying cellular structures at sub-diffractive resolution. More recent work addressing the nanoscale dynamics of focal adhesions by Fuchs, J. et al., 69 utilized an engineered photoswitchable fluorescent protein for superresolution pulse-chase labeling of focal adhesion complexes. The authors performed ‘photohighlighting’ of a subset of focal adhesion complexes and then tracked the nanosacle dynamics of this population to obtain accurate estimation of adhesion turnover.
Live cell point-localization SR imaging techniques have also been used to study the dynamics of bacterial cytoskeleton proteins.70,71 The first of these studies demonstrated the capabilities of point-localization SR microscopy to reconstruct quasi-helical structures of the bacterial actin-like protein MreB within live C. Crecentus at a time resolution of approximately 5 seconds.70 This bacterial ‘relative’ has a unique crescent rod-like morphology when compared with E. Coli. The morphogenesis of this rod-like structure is believed to arise from specialized cytoskeleton proteins that are important for structural maintenance, chromosome segregation, and control of asymmetric bacterial division. The authors were able to localize single molecule blinking events using the standard enhanced yellow fluorescent protein (eYFP) by forcing the majority of eYFP-MreB probes to a temporary dark state and localizing only a few molecules per camera acquisition. This procedure resulted in the reconstruction of banded MreB structures conforming to the inner membrane of C. Crecentus that were stationary during the data acquisition period. Interestingly, the authors observed reorganization of eYFP-MreB structures into a single ‘ring’ band structure in predivisional bacteria, suggesting the data could be acquired with sufficient time resolution to differentiate between structural transition states required for bacterial rigidity and cell division. A related study defined the three-dimensional (3D) organization of FtsZ protein in live C. Crecentus using a double helix PSF approach.71 This study focused on live basal and pre-divisional bacteria and produced remarkable 3D images showing ‘doughnut’ shaped 150-300 nm ring openings and radially condensed, 150 nm full width, FtsZ structures, respectively (Figure 3C). An important strength of this study was that the 3D organization of FtsZ structures was not inferred from two-dimensional projections of imaged bacteria, but measured directly.
These studies have focused on cellular structures that show little dynamic behavior on the seconds time scale, allowing sufficient sampling of the structure to prevent blurring of dynamic transition states. Many biological structures in the cell, however, have faster dynamics on the milliseconds to seconds time scale. These structures, such as motor-driven vesicles shuttling throughout the cell, would display an artificially elongated structure if not sampled quickly enough to capture this rapid motion. Recently, Huang, F. et al. demonstrated one way of overcoming this challenge.72 They utilized next generation scientific-CMOS camera technology combined with point-localization SR imaging to produce faster image read-out speeds over large fields of view with comparable single molecule sensitivity when compared with traditional EMCCD technology. This improvement in imaging speed (as fast as 32 frames per second) together with use of noise correcting algorithms enabled the researchers to image highly dynamic structures in the cell using point-localization SR microscopy. These included microtubule growth, peroxisome dynamics, and mobile transferrin receptor clusters.72 As new camera technology and noise correcting algorithms continue to improve, it should become possible for faster objects to be imaged at the nanoscale. For this to occur, however, the photon output of fluorescent probes will also need to improve, since probe brightness ultimately limits the achievable spatial and temporal resolution of point-localization SR microscopy. The development of new reversibly photoswitchable proteins with improved photon budget, photostability and switching rates, such as mGeos,73 should help in realizing faster sampling rate in live PALM experiments.
9. Pinpointing the spatial configuration, number and stoichiometry of proteins in subcellular structures
The high precision positional information generated by PALM contains a wealth of information about the spatial organization of proteins in a native biological context. Analysis of these lists of molecular positions can provide important insights regarding how spatial configurations of complex protein assemblies modulate and dictate the processes in which they participate. For example, PALM data sets can be mined to obtain information about spatial distribution characteristics like density, absolute numbers and clustering of protein molecules, which are important physical parameters that modulate numerous physiological processes.47
A prerequisite for analyzing protein distribution characteristics in PALM is the precise identification of single molecules. A major factor affecting this identification is fluorescent ‘blinking’,74,75 which interferes with quantitative analysis of data sets by causing a single protein to appear as a cluster of points in the final superresolution image.53,76 Blinking is the reversible interconversion of a single fluorescent protein between a fluorescent and non-fluorescent state (Fig. 4A). Unlike permanent conversion of a FP to a dark state induced by photobleaching, blinking leads to temporary disappearance of an excited fluorescent protein, followed by reappearance after a short time. All photoconvertible proteins commonly used in point-localization SR microscopy exhibit such intermittent blinking.
Figure 4.
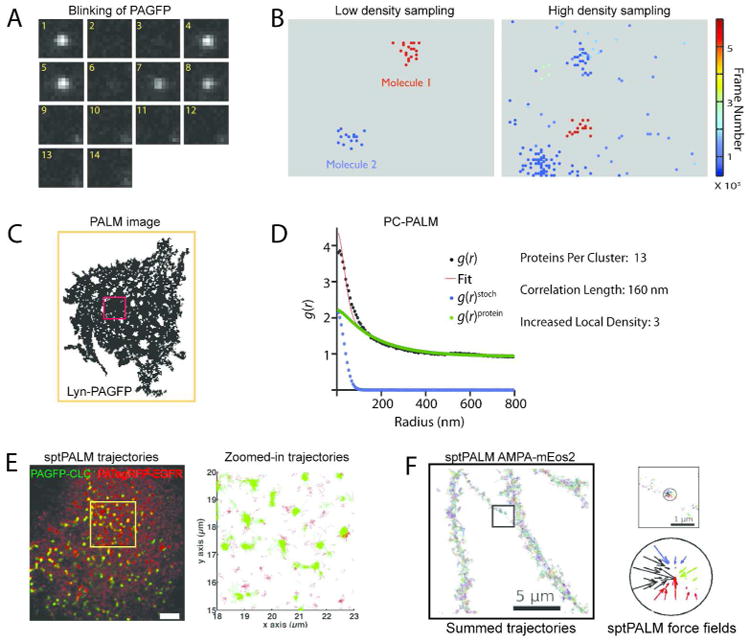
(A) During the fluorescence emission cycle, single fluorescent molecules undergo multiple blinking events (reversible switching between fluorescent and dark states) before being irreversibly photobleached. The micrograph illustrates the blinking behavior of a PAGFP molecule, as it reversibly transitions into dark states (Frames 2 and 3, and frame 4), and is finally photobleached at Frame 9. The images were collected at 10 frames per second. (B) The multiple appearances of a single molecule coupled with the stochastic uncertainty in position determination leads to a single molecule appearing as a cluster of points in a pointillist superresolution image (left panel). The two panels show the distribution of single molecule positions, with each point representing the position of a single molecule estimated from one of its appearance. The points are color coded according to the time of their appearance during the image acquisition. Peaks arising from a molecule can be correctly assigned based on spatial grouping only if molecules are sparsely distributed, as shown in the left panel. The clusters of points representing individual molecules are spatially separated, and can be grouped together to calculate the positional coordinates of the corresponding molecules. The right panel shows the complex spatial distribution of the positional coordinates of the multiple appearances of single molecules in a pointillist image with a high density of fluorescent molecules (often the case in biological samples). The close spacing of the various points in space and time prevents grouping of the points and assigning them to individual molecules. (C) Pointillist PALM image of the distribution of Lyn-PAGFP on the plasma membrane of COS-7 cells. Pair-corrleation analysis is performed on randomly chosen sub-sections of the pointillist image of the cell. (D) PC-PALM analysis of a subsection of the cell represented by the red box in (C). The red line represents the fit of the measured correlation function (black circles, g(r)) to a clustered model. The actual correlation function of the proteins (green circles in the center graph, g(r)protein) is estimated by subtracting the correlation function due to the multiple appearance of single fluorescent molecules (blue circles, g(r)stoch) from the total correlation function, g(r). The cluster occupancy, size and density can be estimated from the protein correlation function. Images A-D adapted with permission from ref. 47. Copyright 2012 John Wiley & Sons. (E) Two color sptPALM trajectories of EGFR-PAtagRFP and PAGFP-Clathrin light chain (PAGFP-CLC) on the plasma membrane of COS-7 cells. The panel on the right is a zoomed-in depiction of the single molecule trajectories within the yellow box on the cell surface in the left panel. The green punctae on the cell surface represents the confined motion of PAGFP-CLC within clathrin-coated pits at different stages of maturation. Close inspection of the two color trajectories reveals the dynamic interaction of the EGFR-PAtagRFP molecules with clathrin-coated pits. Adapted with permission from ref. 87. Copyright 2010 ACS. (F) Analysis of single molecule trajectories of mEos2 labeled AMPA receptors (AMPA-mEos2) gave insights about the receptor organization at the neuronal dendritic surface. Multiscale analysis of single receptor dynamics reveals that the receptors experience a local force field originating from local potential wells, with their trajectories converging towards the center of the potential well. The converging forces in a potential well present within a subsection of the dendrite surface (circle within the subsection represented by black box) are depicted in the right panel. This indicates that direct interaction between the receptors and some unidentified interacting partners modulates their nanoscale dynamics and spatial organization. Adapted with permission from ref. 88. Copyright 2012 National Academy of Sciences.
Blinking can occur over a wide range of time-scales, ranging from a few milliseconds to a few seconds. Therefore, it temporally disperses images from the same single molecule across multiple frames. Because the positions of the same fluorophore calculated from its multiple images do not exactly overlap due to the stochastic uncertainty in position determination, a single fluorophore appears as a cluster of peaks in the pointillistic image, with a single molecule represented as a cluster of molecules rather than one (Fig. 4B). This poses a serious problem to accurate reconstruction of superresolution images and their quantitative spatial analysis.53,54 In order to access the nanoscale quantitative spatial information contained in superresolution datasets, therefore, robust and objective analysis algorithms are required to tease out the true spatial information submerged in the complex point pattern of the raw data.
Because of the acute need for quantitative analysis methodologies, rapid advances in PALM analysis techniques geared towards rigorous, statistical analysis of the complex superresolution images have been catalyzed. To account for multiple appearances and ensure that a fluorescent molecule is represented only once in the final list of molecular positions, some of these techniques have employed clustering algorithms to group multiple localizations of a single protein based on their occurrence within certain distance and time thresholds. Such cluster-based protein assignment has been used, for example, to characterize the stoichiometry of asialoglycoprotein receptors on the surface of mammalian cells,77 as well as for examining the organization of proteins during T cell signaling.78,79 However, the cluster-based algorithms can sometimes lead to misassignment of single molecule appearances in dense biological samples, as explained below (Fig. 4B).
The distance threshold in PALM cluster-based algorithms is selected based on the average uncertainty of protein localization, and is mostly a reasonable estimate of the spatial spread of the localizations from a single molecule. Optimal choice of the time threshold in these algorithms is often hampered by the wide spread in blinking intervals of fluorescent proteins. A time threshold long enough to capture all the appearances of a molecule increases the probability of a second fluorescent protein appearing within the space circumscribed by the distance threshold. This can lead to misassignment of the second fluorescent protein image. A shorter time interval, on the other hand, risks the chance of missing some of the reappearances of the same protein after a long blinking interval, leading to over-counting and detection of artificial clustering. Thus, the empirically chosen time interval is often unable to accurately capture the spatial distribution of the fluorescent proteins. The inadequacies of this kind of clustering approach has prompted the development of various statistical approaches to deal with the demands of complex, information-dense PALM data sets.
One such recently proposed analysis technique, called pair correlation-PALM (PC-PALM) 53,54 (Fig. 4C-D), provides a statistical framework for overcoming the aforementioned artifacts associated with blinking induced multiple appearances of molecules. It uses a statistical pair correlation algorithm to analyze SR data sets based on the concept that the multiple localization positions from a single fluorescent molecule are distributed over the surface of a Gaussian function (representing the PSF of the SR technique) centered at the actual position of the molecule.53,80,81 In this approach, the specific spatial configuration of the localizations arising from blinking-induced multiple appearances (i.e., their distribution across a Gaussian function) is first used to estimate the overall correlation function. Following the removal of this contribution, the residual correlation function is then used to extract important characteristics of the underlying spatial distribution of the proteins (Fig. 4D). This approach successfully characterized the nanoscale spatial distribution of important signaling proteins like Lat and Lyn, a viral envelope protein and a GPI-anchored protein on the plasma membrane of mammalian cells. In addition, the clustering characteristics of other signaling complexes 82 and endocytic structures 64 have been evaluated with pair correlation-based approaches combined with PALM.
More recent approaches employing kinetic models also have been used to overcome molecular overcounting and to estimate the number of protein molecules present in PALM images.83,84 Following overcounting corrections, the molecular positions can be analyzed with different cluster analysis algorithms to identify individual molecular clusters and extract precise information about cluster size and occupancy. Recently, density-based spatial clustering of applications with noise (DBSCAN) analysis of PALM data was used to characterize the nanoscale organization of RNA polymerase (RNAP) in E. coli 85 and study the oligomerization of C-Raf serine/threonine protein kinase at mammalian plasma membrane.86 These studies underscore how the confluence of rigorous, statistical analysis with single molecule superresolution microscopy provides powerful tools to elucidate the nanoscale spatial organization of proteins in a native biological context.
10. Single molecule tracking using PALM
Besides the spatial organization of protein molecules, the dynamics of protein molecules also play an important role in their function. Biology is driven by physical interactions between mobile proteins. The rate and nature of diffusion of proteins, for example, determine the probability of collisional frequency among molecules, impacting their intermolecular interactions. The specific steady-state configuration of proteins inside cells is also dictated by the protein's dynamic properties. For instance, cellular signaling is often initiated by transition of the participatory receptor proteins to a different diffusive state. Thus, careful characterization of the dynamics of proteins can provide insights about the molecular mechanisms of such biological processes.
To elucidate the dynamic behavior of single proteins, PALM images from live cells are collected such that the molecular positions in consecutive frames depict the change in spatial positions of single molecules as they undergo diffusion in space. The fluorescence emission of a single photoactivated/ photoswitched molecule is often spread over a few consecutive image frames. The spatial coordinates of the molecule in each new frame give an updated estimate of its current position. By connecting these successive positional coordinates, it becomes possible to generate a high-resolution trajectory of the molecule's motion in space. This approach, called single particle tracking PALM (sptPALM), was first described for PALM imaging and data treatment in 2008.56 The trajectories generated from sptPALM experiments can be analyzed to monitor the movement of individual proteins on the plasma membrane and in the cytoplasm of live cells. Statistical analysis of such trajectories can be used to detect different diffusive states of the molecules and the rates of transition between these states. This information provides invaluable insights about the molecular mechanisms that modulate the motion of proteins and enable them to carry out their specific biological functions. Since its inception, sptPALM-based experiments have been used to interrogate such mechanisms as the clustering of cell surface receptors 87,88 (Fig. 4E) and the dynamics of actin in dendritic spines.89,90
Single particle tracking techniques like sptPALM involve the monitoring of particle motion across several image frames, during which the protein molecules, especially fast moving ones, can move over significant distances. With the position of the molecules constantly changing, it becomes paramount to correctly determine the successive positions of the molecule if multiple fluorescent molecules are detected in close proximity. In order to overcome this complication, early single particle tracking approaches used probes expressed at low density (e.g., quantum dots) to ensure that every molecule had enough space to be sampled with minimal risk of encountering another fluorescing molecule. Accurate trajectories then could be constructed by proper assignment of molecular positions. However, such experiments produced only a handful of tracks per experiment, and the small sampling statistics often precluded detection of dynamic heterogeneities. In addition, since single molecule events are stochastic by nature, the limited number of tracks could be insufficient to identify phenomenon important for understanding the mechanistic basis of the processes being studied.
Even though the requirement for well-spaced molecular trajectories hold true for sptPALM, the sequential activation and photobleaching scheme used in sptPALM allows the detection of thousands of single molecule trajectories without overcrowding of fluorescing molecules, and with the appearance of new fluorescing molecules being balanced by photobleaching of existing ones.56 Thus, sptPALM enables the capture of a vast number of single molecule trajectories from a single experiment, providing a large statistical repertoire for analysis of spatial and temporal heterogeneities in protein motion, and for detection of infrequent events. The large number of tracks in an sptPALM dataset also enables the probing of interactions between individual proteins,87 which has been difficult to carry out with traditional single particle tracking experiments because of the paucity of trajectories.
Soon after the development of sptPALM, it was realized that its huge number of short trajectories required different statistical treatment than the few, long trajectories obtained from traditional single particle experiments. This led to a burgeoning interest and focus on development of sophisticated techniques for robust and comprehensive analysis of dense fields of trajectories. These efforts have already started to bear fruits. For example, an analysis algorithm for sptPALM data has been recently developed that uses variational Bayesian methods to identify the distinct diffusive states of single protein molecules and the rate of their transition between such states.91 Another analysis technique used the local biophysical properties of protein diffusion to identify the presence of AMPA receptor clusters and to characterize the specific kind of interactions inducing such clustering 88 (Fig. 4F). This study highlights how, by careful analysis of the trajectories of molecules, it is possible to dissect the dynamic changes in protein diffusion across complex cellular landscapes and pinpoint the mechanisms at play.
11. Conclusions and Perspective
The renaissance in biological visualization fuelled by the recent advances in superresolution imaging techniques is poised to transform biological research. These techniques are not only promising to make various aspects of nanoscale biology accessible, but they have also stimulated advances in optics, probe development and quantitative analysis techniques. Despite this, the application of these superresolution techniques to address biology is still in its infancy. To mature, SR techniques like PALM will require new biologically compatible probes with optimal photophysics; optics and data acquisition protocols for faster image acquisition; computation facilities for handling and processing the huge data sets; and, statistical techniques for analysis of the unique data content. We are now transitioning through a phase where these challenges are gradually being met, paving the way for the interrogation of fundamental biological questions.
One potential impact of PALM and related point-localization techniques is in bridging the gap in knowledge of functional mechanisms of various biomolecules inside living cells versus under in vitro conditions. For example, in vitro studies over the last few decades have furnished detailed insights about the basic biophysical principles governing the working of molecular motors. Despite this, the complex regulatory mechanisms that modulate the functioning of these motor proteins inside the complex milieu of cells and tissues remain unclear. The high spatial resolution and specificity of PALM and related SR-techniques can be harnessed to study the molecular architecture and dynamics of these motors in their native biological context, detecting and measuring their interactions with other cellular proteins.
Pointillistic SR imaging techniques are also beginning to unravel the nanoscale functional architecture of the mammalian plasma membrane to gain details about cell surface receptor stoichiometry and how its organization regulates physiological processes such as cell signaling, cell migration and cell adhesion. Nanoscale insights about protein clustering and organization of molecular assemblies afforded by the point-localization SR techniques can also unearth novel insights about mechanisms of neurotransmission. Various pre- and post- synaptic specialized structures have sub-diffraction dimensions and are organized in crowded environments where adjacent synaptic structures are separated by tens of nanometer. Dynamic compartmentalization of a multitude of signaling, scaffolding and cytoskeletal proteins within these structures play crucial roles in the functioning of the neuronal system. PALM and related SR-techniques have the requisite spatial resolution to provide details about how spatial organization and dynamics of these proteins are coupled to synaptic transmission, molecular memory and synaptic plasticity.
Point-localization SR microscopy is also stimulating the introduction of microscopy techniques in biological disciplines where traditional imaging has been under-utilized. One such discipline is developmental biology. Organelle morphogenesis during development involves orchestrated cell migration mediated by dynamic remodeling of cytoskeletal structures and coordinated formation and reorganization of cellular adhesions and junctions. These subcellular structures are complex assemblies of proteins that undergo dynamic changes in composition, shape and size. Conventional optical techniques lack the spatial resolution to delineate the organization of proteins within these structures. The lack of protein specificity in EM, on the other hand, prevents detection of specific proteins in these molecular assemblies. Point-localization based SR techniques can be used to determine the molecular composition and the 3D spatial organization of proteins within these complexes. Cell differentiation, another central process in development, is triggered and modulated by transcriptional regulation of gene expression. One of the possible mechanisms for such regulation is spatial compartmentalization of genetic networks and their regulatory elements within the chromosomes. PALM and related point-localization techniques can be used to detect the presence of such spatially confined gene clusters, determine how they physically interact with their regulatory elements in nuclear space, and identify protein factors that mediate such interactions.
The examples discussed above represent a fraction of the biological questions that can be addressed with PALM and related SR imaging techniques. With the availability of commercial superresolution microscopes and data acquisition/processing software packages, in conjunction with rapid advances in probe technology, the application of point-localization based SR techniques for interrogating various fundamental biological questions is expected to rise exponentially. The marriage of the current point-localization SR imaging modules with sensitive biophysical techniques such as FRET77 and fluorescence lifetime imaging will further extend the scope of these techniques for addressing biophysical questions. Together, these developments should uncork the full potential of these techniques, helping us to experience biology unfettered by the diffraction-imposed boundaries.
Table 2. Photocontrollable-FP combinations for multicolor Photoactivated Localization Microscopy.
| Application | Probe Pairs | Probe Properties | Imaging Protocol |
|---|---|---|---|
| Nanoscale Structure (Fixed) | Dronpa/mGeos and tdEos | Multiple reappearances of probes ensures adequate sampling of structure High photon output of tdEos provides increased localization precision |
|
| Dronpa/mGeos and mEos3 | mEos3: Monomeric and smaller, can substitute tdEos if target protein is intolerant of bulky label | ||
| Assembly Stoichiometry | PS-CFP2 and PAmCherry1 | PSCFP2: High photon output and contrast ratio provides increased localization precision Little or no blinking PAmCherry1: Can be irreversibly bleached with low amount of blinking |
|
| PAGFP and PAmCherry1 | PAGFP: monomeric and folding is less sensitive to cellular environment Can be used in place of PS-CFP2 |
|
|
| Single Molecule Dynamics | PAGFP and PATagRFP | Dark to green (PAGFP) and dark to red (PATagRFP) photoconversions allow simultaneous imaging of two channels without crosstalk. PATagRFP: Bright and photostable, can be tracked over longer distances |
Simultaneous data acquisition required. Use beam-splitter to unmix fluorescence signal |
Biographies
Prabuddha Sengupta: Prabuddha Sengupta received his B.Sc. from Presidency College, Calcutta in India, and Ph.D. from Cornell University. His graduate research was focused on studying the biophysical principles underlying mammalian plasma membrane compartmentalization and the role of such compartmentalization in intracellular signaling. During his postdoctoral training at the National Institutes of Health, he developed quantitative analysis techniques for Photoactivated Localization Microscopy and related superresolution microscopy techniques. He is currently a Research Fellow at National Institutes of Health and uses superresolution microscopy techniques to study the nanoscale spatial remodeling and dynamics of plasma membrane components during retroviral budding and receptor mediated signaling.

Schuyler B. van Engelenburg: Schuyler B. van Engelenburg completed his B.S. in chemistry at Fort Lewis College in 2005. He received his Ph.D. in biochemistry from the University of Colorado, Boulder in 2010. His doctoral work focused on developing new microscopy methods for studying cellular microbiology, using the bacterial pathogen Salmonella as an infection model. He joined the Lippincott-Schwartz group in 2010 where his focus is on developing superresolution imaging methods to study host factors involved in HIV biogenesis.

Jennifer Lippincott-Schwartz: Jennifer Lippincott-Schwartz received her B.A. from Swarthmore College, her M.S. in Biology from Stanford University, and her Ph.D in Biochemistry from Johns Hopkins University. She did post-doctoral training at the National Institutes of Health (NIH) under the mentorship of Dr. Richard Klausner. Currently, she is Chief of the Section on Organelle Biology in the Cell Biology and Metabolism Program of the Eunice Kennedy Shriver National Institute of Child Health and Human Development at NIH and is recognized as Distinguished NIH Investigator.

References
- 1.Tsien RY. Annu Rev Biochem. 1998;67:509. doi: 10.1146/annurev.biochem.67.1.509. [DOI] [PubMed] [Google Scholar]
- 2.Lippincott-Schwartz J, Patterson GH. Science. 2003;300:87. doi: 10.1126/science.1082520. [DOI] [PubMed] [Google Scholar]
- 3.Giepmans BN, Adams SR, Ellisman MH, Tsien RY. Science. 2006;312:217. doi: 10.1126/science.1124618. [DOI] [PubMed] [Google Scholar]
- 4.Lippincott-Schwartz J. Annu Rev Biochem. 2011;80:327. doi: 10.1146/annurev-biochem-121010-125553. [DOI] [PMC free article] [PubMed] [Google Scholar]
- 5.Abbe E. Arch Mikroskop Anat. 1873;9:413. [Google Scholar]
- 6.Hell SW, Wichmann J. Opt Lett. 1994;19:780. doi: 10.1364/ol.19.000780. [DOI] [PubMed] [Google Scholar]
- 7.Gustafsson MG. J Microsc. 2000;198:82. doi: 10.1046/j.1365-2818.2000.00710.x. [DOI] [PubMed] [Google Scholar]
- 8.Gustafsson MG. Proc Natl Acad Sci U S A. 2005;102:13081. doi: 10.1073/pnas.0406877102. [DOI] [PMC free article] [PubMed] [Google Scholar]
- 9.Betzig E, Patterson GH, Sougrat R, Lindwasser OW, Olenych S, Bonifacino JS, Davidson MW, Lippincott-Schwartz J, Hess HF. Science. 2006;313:1642. doi: 10.1126/science.1127344. [DOI] [PubMed] [Google Scholar]
- 10.Hess ST, Girirajan TP, Mason MD. Biophys J. 2006;91:4258. doi: 10.1529/biophysj.106.091116. [DOI] [PMC free article] [PubMed] [Google Scholar]
- 11.Rust MJ, Bates M, Zhuang X. Nat Methods. 2006;3:793. doi: 10.1038/nmeth929. [DOI] [PMC free article] [PubMed] [Google Scholar]
- 12.Heilemann M, van de Linde S, Schuttpelz M, Kasper R, Seefeldt B, Mukherjee A, Tinnefeld P, Sauer M. Angew Chem Int Ed Engl. 2008;47:6172. doi: 10.1002/anie.200802376. [DOI] [PubMed] [Google Scholar]
- 13.Folling J, Bossi M, Bock H, Medda R, Wurm CA, Hein B, Jakobs S, Eggeling C, Hell SW. Nat Methods. 2008;5:943. doi: 10.1038/nmeth.1257. [DOI] [PubMed] [Google Scholar]
- 14.Lukyanov KA, Chudakov DM, Lukyanov S, Verkhusha VV. Nature Reviews Molecular Cell Biology. 2005;6:885. doi: 10.1038/nrm1741. [DOI] [PubMed] [Google Scholar]
- 15.Lippincott-Schwartz J, Patterson GH. Trends Cell Biol. 2009;19:555. doi: 10.1016/j.tcb.2009.09.003. [DOI] [PMC free article] [PubMed] [Google Scholar]
- 16.Patterson G, Davidson M, Manley S, Lippincott-Schwartz J. Annu Rev Phys Chem. 2010;61:345. doi: 10.1146/annurev.physchem.012809.103444. [DOI] [PMC free article] [PubMed] [Google Scholar]
- 17.Sengupta P, Van Engelenburg S, Lippincott-Schwartz J. Dev Cell. 2012;23:1092. doi: 10.1016/j.devcel.2012.09.022. [DOI] [PMC free article] [PubMed] [Google Scholar]
- 18.Kador L, Horne DE, Moerner WE. Journal of Physical Chemistry. 1990;94:1237. [Google Scholar]
- 19.Orrit M, Bernard J. Phys Rev Lett. 1990;65:2716. doi: 10.1103/PhysRevLett.65.2716. [DOI] [PubMed] [Google Scholar]
- 20.Shera EB, Seitzinger NK, Davis LM, Keller RA, Soper SA. Chemical Physics Letters. 1990;174:553. [Google Scholar]
- 21.Betzig E, Chichester RJ. Science. 1993;262:1422. doi: 10.1126/science.262.5138.1422. [DOI] [PubMed] [Google Scholar]
- 22.Funatsu T, Harada Y, Tokunaga M, Saito K, Yanagida T. Nature. 1995;374:555. doi: 10.1038/374555a0. [DOI] [PubMed] [Google Scholar]
- 23.Mehta AD, Rock RS, Rief M, Spudich JA, Mooseker MS, Cheney RE. Nature. 1999;400:590. doi: 10.1038/23072. [DOI] [PubMed] [Google Scholar]
- 24.Noji H, Yasuda R, Yoshida M, Kinosita K., Jr Nature. 1997;386:299. doi: 10.1038/386299a0. [DOI] [PubMed] [Google Scholar]
- 25.Yildiz A, Tomishige M, Vale RD, Selvin PR. Science. 2004;303:676. doi: 10.1126/science.1093753. [DOI] [PubMed] [Google Scholar]
- 26.Yildiz A, Selvin PR. Acc Chem Res. 2005;38:574. doi: 10.1021/ar040136s. [DOI] [PubMed] [Google Scholar]
- 27.Bobroff N. Review of Scientific Instruments. 1986;57:1152. [Google Scholar]
- 28.Thompson RE, Larson DR, Webb WW. Biophys J. 2002;82:2775. doi: 10.1016/S0006-3495(02)75618-X. [DOI] [PMC free article] [PubMed] [Google Scholar]
- 29.Betzig E. Opt Lett. 1995;20:237. doi: 10.1364/ol.20.000237. [DOI] [PubMed] [Google Scholar]
- 30.van Oijen AM, Kohler J, Schmidt J, Muller M, Brakenhoff GJ. Chemical Physics Letters. 1998;292:183. [Google Scholar]
- 31.Heilemann M, Herten DP, Heintzmann R, Cremer C, Muller C, Tinnefeld P, Weston KD, Wolfrum J, Sauer M. Anal Chem. 2002;74:3511. doi: 10.1021/ac025576g. [DOI] [PubMed] [Google Scholar]
- 32.Patterson GH, Lippincott-Schwartz J. Science. 2002;297:1873. doi: 10.1126/science.1074952. [DOI] [PubMed] [Google Scholar]
- 33.Wiedenmann J, Ivanchenko S, Oswald F, Schmitt F, Rocker C, Salih A, Spindler KD, Nienhaus GU. Proc Natl Acad Sci U S A. 2004;101:15905. doi: 10.1073/pnas.0403668101. [DOI] [PMC free article] [PubMed] [Google Scholar]
- 34.Sharonov A, Hochstrasser RM. Proc Natl Acad Sci U S A. 2006;103:18911. doi: 10.1073/pnas.0609643104. [DOI] [PMC free article] [PubMed] [Google Scholar]
- 35.Simonson PD, Rothenberg E, Selvin PR. Nano Lett. 2011;11:5090. doi: 10.1021/nl203560r. [DOI] [PMC free article] [PubMed] [Google Scholar]
- 36.Burnette DT, Sengupta P, Dai Y, Lippincott-Schwartz J, Kachar B. Proc Natl Acad Sci U S A. 2011;108:21081. doi: 10.1073/pnas.1117430109. [DOI] [PMC free article] [PubMed] [Google Scholar]
- 37.Gelles J, Schnapp BJ, Sheetz MP. Nature. 1988;331:450. doi: 10.1038/331450a0. [DOI] [PubMed] [Google Scholar]
- 38.Kubitscheck U, Kuckmann O, Kues T, Peters R. Biophys J. 2000;78:2170. doi: 10.1016/S0006-3495(00)76764-6. [DOI] [PMC free article] [PubMed] [Google Scholar]
- 39.Shannon CE. Proceedings of the Institute of Radio Engineers. 1949;37:10. [Google Scholar]
- 40.Holden SJ, Uphoff S, Kapanidis AN. Nat Methods. 2011;8:279. doi: 10.1038/nmeth0411-279. [DOI] [PubMed] [Google Scholar]
- 41.Huang F, Schwartz SL, Byars JM, Lidke KA. Biomed Opt Express. 2011;2:1377. doi: 10.1364/BOE.2.001377. [DOI] [PMC free article] [PubMed] [Google Scholar]
- 42.Smith CS, Joseph N, Rieger B, Lidke KA. Nat Methods. 2010;7:373. doi: 10.1038/nmeth.1449. [DOI] [PMC free article] [PubMed] [Google Scholar]
- 43.Quan T, Zhu H, Liu X, Liu Y, Ding J, Zeng S, Huang ZL. Opt Express. 2011;19:16963. doi: 10.1364/OE.19.016963. [DOI] [PubMed] [Google Scholar]
- 44.Cox S, Rosten E, Monypenny J, Jovanovic-Talisman T, Burnette DT, Lippincott-Schwartz J, Jones GE, Heintzmann R. Nat Methods. 2012;9:195. doi: 10.1038/nmeth.1812. [DOI] [PMC free article] [PubMed] [Google Scholar]
- 45.Wang Y, Quan T, Zeng S, Huang ZL. Opt Express. 2012;20:16039. doi: 10.1364/OE.20.016039. [DOI] [PubMed] [Google Scholar]
- 46.Zhu L, Zhang W, Elnatan D, Huang B. Nat Methods. 2012;9:721. doi: 10.1038/nmeth.1978. [DOI] [PMC free article] [PubMed] [Google Scholar]
- 47.Sengupta P, Lippincott-Schwartz J. Bioessays. 2012;34:396. doi: 10.1002/bies.201200022. [DOI] [PMC free article] [PubMed] [Google Scholar]
- 48.Chudakov DM, Verkhusha VV, Staroverov DB, Souslova EA, Lukyanov S, Lukyanov KA. Nat Biotechnol. 2004;22:1435. doi: 10.1038/nbt1025. [DOI] [PubMed] [Google Scholar]
- 49.McKinney SA, Murphy CS, Hazelwood KL, Davidson MW, Looger LL. Nat Methods. 2009;6:131. doi: 10.1038/nmeth.1296. [DOI] [PMC free article] [PubMed] [Google Scholar]
- 50.Zhang M, Chang H, Zhang Y, Yu J, Wu L, Ji W, Chen J, Liu B, Lu J, Liu Y, Zhang J, Xu P, Xu T. Nat Methods. 2012;9:727. doi: 10.1038/nmeth.2021. [DOI] [PubMed] [Google Scholar]
- 51.Stepanenko OV, Stepanenko OV, Shcherbakova DM, Kuznetsova IM, Turoverov KK, Verkhusha VV. Biotechniques. 2011;51:313. doi: 10.2144/000113765. [DOI] [PMC free article] [PubMed] [Google Scholar]
- 52.Nienhaus GU, Nienhaus K, Hölzle A, Ivanchenko S, Renzi F, Oswald F, Wolff M, Schmitt F, Röcker C, Vallone B, Weidemann W, Heilker R, Nar H, Wiedenmann J. Photochem Photobiol Sci. 2006;82:351. doi: 10.1562/2005-05-19-RA-533. [DOI] [PubMed] [Google Scholar]
- 53.Sengupta P, Jovanovic-Talisman T, Skoko D, Renz M, Veatch SL, Lippincott-Schwartz J. Nat Methods. 2011;8:969. doi: 10.1038/nmeth.1704. [DOI] [PMC free article] [PubMed] [Google Scholar]
- 54.Sengupta P, Jovanovic-Talisman T, Lippincott-Schwartz J. Nat Protoc. 2013;8:345. doi: 10.1038/nprot.2013.005. [DOI] [PMC free article] [PubMed] [Google Scholar]
- 55.Shroff H, Galbraith CG, Galbraith JA, Betzig E. Nat Methods. 2008;5:417. doi: 10.1038/nmeth.1202. [DOI] [PMC free article] [PubMed] [Google Scholar]
- 56.Manley S, Gillette JM, Patterson GH, Shroff H, Hess HF, Betzig E, Lippincott-Schwartz J. Nat Methods. 2008;5:155. doi: 10.1038/nmeth.1176. [DOI] [PubMed] [Google Scholar]
- 57.Kanchanawong P, Shtengel G, Pasapera AM, Ramko EB, Davidson MW, Hess HF, Waterman CM. Nature. 2010;468:580. doi: 10.1038/nature09621. [DOI] [PMC free article] [PubMed] [Google Scholar]
- 58.York AG, Ghitani A, Vaziri A, Davidson MW, Shroff H. Nat Methods. 2011;8:327. doi: 10.1038/nmeth.1571. [DOI] [PMC free article] [PubMed] [Google Scholar]
- 59.Fu G, Huang T, Buss J, Coltharp C, Hensel Z, Xiao J. PLoS One. 2010;5:e12682. doi: 10.1371/journal.pone.0012680. [DOI] [PMC free article] [PubMed] [Google Scholar]
- 60.Shtengel G, Galbraith JA, Galbraith CG, Lippincott-Schwartz J, Gillette JM, Manley S, Sougrat R, Waterman CM, Kanchanawong P, Davidson MW, Fetter RD, Hess HF. Proc Natl Acad Sci U S A. 2009;106:3125. doi: 10.1073/pnas.0813131106. [DOI] [PMC free article] [PubMed] [Google Scholar]
- 61.Rossi A, Moritz TJ, Ratelade J, Verkman AS. J Cell Sci. 2012;125:4405. doi: 10.1242/jcs.109603. [DOI] [PMC free article] [PubMed] [Google Scholar]
- 62.Jin BJ, Rossi A, Verkman AS. Biophys J. 2011;100:2936. doi: 10.1016/j.bpj.2011.05.012. [DOI] [PMC free article] [PubMed] [Google Scholar]
- 63.Shroff H, Galbraith CG, Galbraith JA, White H, Gillette J, Olenych S, Davidson MW, Betzig E. Proc Natl Acad Sci U S A. 2007;104:20308. doi: 10.1073/pnas.0710517105. [DOI] [PMC free article] [PubMed] [Google Scholar]
- 64.Subach FV, Patterson GH, Manley S, Gillette JM, Lippincott-Schwartz J, Verkhusha VV. Nat Methods. 2009;6:153. doi: 10.1038/nmeth.1298. [DOI] [PMC free article] [PubMed] [Google Scholar]
- 65.Bock H, Geisler C, Wurm CA, Von Middendorff C, Jakobs S, Schonle A, Egner A, Hell SW, Eggeling C. Applied Physics B-Lasers and Optics. 2007;88:161. [Google Scholar]
- 66.Muranyi W, Malkusch S, Muller B, Heilemann M, Krausslich HG. PLoS Pathog. 2013;9:e1003198. doi: 10.1371/journal.ppat.1003198. [DOI] [PMC free article] [PubMed] [Google Scholar]
- 67.Loschberger A, van de Linde S, Dabauvalle MC, Rieger B, Heilemann M, Krohne G, Sauer M. J Cell Sci. 2012;125:570. doi: 10.1242/jcs.098822. [DOI] [PubMed] [Google Scholar]
- 68.Szymborska A, de Marco A, Daigle N, Cordes VC, Briggs JA, Ellenberg J. Science. 2013;341:655. doi: 10.1126/science.1240672. [DOI] [PubMed] [Google Scholar]
- 69.Fuchs J, Bohme S, Oswald F, Hedde PN, Krause M, Wiedenmann J, Nienhaus GU. Nat Methods. 2010;7:627. doi: 10.1038/nmeth.1477. [DOI] [PubMed] [Google Scholar]
- 70.Biteen JS, Thompson MA, Tselentis NK, Bowman GR, Shapiro L, Moerner WE. Nat Methods. 2008;5:947. doi: 10.1038/NMETH.1258. [DOI] [PMC free article] [PubMed] [Google Scholar]
- 71.Biteen JS, Goley ED, Shapiro L, Moerner WE. Chemphyschem. 2012;13:1007. doi: 10.1002/cphc.201100686. [DOI] [PMC free article] [PubMed] [Google Scholar]
- 72.Huang F, Hartwich TM, Rivera-Molina FE, Lin Y, Duim WC, Long JJ, Uchil PD, Myers JR, Baird MA, Mothes W, Davidson MW, Toomre D, Bewersdorf J. Nat Methods. 2013;10:653. doi: 10.1038/nmeth.2488. [DOI] [PMC free article] [PubMed] [Google Scholar]
- 73.Chang H, Zhang M, Ji W, Chen J, Zhang Y, Liu B, Lu J, Zhang J, Xu P, Xu T. Proc Natl Acad Sci U S A. 2012;109:4455. doi: 10.1073/pnas.1113770109. [DOI] [PMC free article] [PubMed] [Google Scholar]
- 74.Dickson RM, Cubitt AB, Tsien RY, Moerner WE. Nature. 1997;388:355. doi: 10.1038/41048. [DOI] [PubMed] [Google Scholar]
- 75.Schwille P, Kummer S, Heikal AA, Moerner WE, Webb WW. Proc Natl Acad Sci U S A. 2000;97:151. doi: 10.1073/pnas.97.1.151. [DOI] [PMC free article] [PubMed] [Google Scholar]
- 76.Annibale P, Vanni S, Scarselli M, Rothlisberger U, Radenovic A. Nat Methods. 2011;8:527. doi: 10.1038/nmeth.1627. [DOI] [PubMed] [Google Scholar]
- 77.Renz M, Daniels BR, Vamosi G, Arias IM, Lippincott-Schwartz J. Proc Natl Acad Sci U S A. 2012;109:E2989. doi: 10.1073/pnas.1211753109. [DOI] [PMC free article] [PubMed] [Google Scholar]
- 78.Owen DM, Rentero C, Rossy J, Magenau A, Williamson D, Rodriguez M, Gaus K. J Biophotonics. 2010;3:446. doi: 10.1002/jbio.200900089. [DOI] [PubMed] [Google Scholar]
- 79.Rossy J, Owen DM, Williamson DJ, Yang Z, Gaus K. Nat Immunol. 2013;14:82. doi: 10.1038/ni.2488. [DOI] [PubMed] [Google Scholar]
- 80.Veatch SL, Machta BB, Shelby SA, Chiang EN, Holowka DA, Baird BA. PLoS One. 2012;7:e31457. doi: 10.1371/journal.pone.0031457. [DOI] [PMC free article] [PubMed] [Google Scholar]
- 81.Veatch SL, Chiang EN, Sengupta P, Holowka DA, Baird BA. J Phys Chem B. 2012;116:6923. doi: 10.1021/jp300197p. [DOI] [PMC free article] [PubMed] [Google Scholar]
- 82.Sherman E, Barr V, Manley S, Patterson G, Balagopalan L, Akpan I, Regan CK, Merrill RK, Sommers CL, Lippincott-Schwartz J, Samelson LE. Immunity. 2011;35:705. doi: 10.1016/j.immuni.2011.10.004. [DOI] [PMC free article] [PubMed] [Google Scholar]
- 83.Annibale P, Vanni S, Scarselli M, Rothlisberger U, Radenovic A. PLoS One. 2011;6:e22678. doi: 10.1371/journal.pone.0022678. [DOI] [PMC free article] [PubMed] [Google Scholar]
- 84.Lee SH, Shin JY, Lee A, Bustamante C. Proc Natl Acad Sci U S A. 2012;109:17436. doi: 10.1073/pnas.1215175109. [DOI] [PMC free article] [PubMed] [Google Scholar]
- 85.Endesfelder U, Finan K, Holden SJ, Cook PR, Kapanidis AN, Heilemann M. Biophys J. 2013;105:172. doi: 10.1016/j.bpj.2013.05.048. [DOI] [PMC free article] [PubMed] [Google Scholar]
- 86.Nan X, Collisson EA, Lewis S, Huang J, Tamguney TM, Liphardt JT, McCormick F, Gray JW, Chu S. Proc Natl Acad Sci U S A. 2013;110:18519. doi: 10.1073/pnas.1318188110. [DOI] [PMC free article] [PubMed] [Google Scholar]
- 87.Subach FV, Patterson GH, Renz M, Lippincott-Schwartz J, Verkhusha VV. J Am Chem Soc. 2010;132:6481. doi: 10.1021/ja100906g. [DOI] [PMC free article] [PubMed] [Google Scholar]
- 88.Hoze N, Nair D, Hosy E, Sieben C, Manley S, Herrmann A, Sibarita JB, Choquet D, Holcman D. Proc Natl Acad Sci U S A. 2012;109:17052. doi: 10.1073/pnas.1204589109. [DOI] [PMC free article] [PubMed] [Google Scholar]
- 89.Frost NA, Shroff H, Kong H, Betzig E, Blanpied TA. Neuron. 2010;67:86. doi: 10.1016/j.neuron.2010.05.026. [DOI] [PMC free article] [PubMed] [Google Scholar]
- 90.Tatavarty V, Kim EJ, Rodionov V, Yu J. PLoS One. 2009;4:e7724. doi: 10.1371/journal.pone.0007724. [DOI] [PMC free article] [PubMed] [Google Scholar]
- 91.Persson F, Linden M, Unoson C, Elf J. Nat Methods. 2013;10:265. doi: 10.1038/nmeth.2367. [DOI] [PubMed] [Google Scholar]