Abstract
Composite electrodes made of the polysaccharide agarose and carbon nanotube fibers (A-CNE) have shown potential to be applied as tissue-compatible, micro-electronic devices. In the present work, A-CNEs were functionalized using neuro-relevant proteins (laminin and alpha-melanocyte stimulating hormone) and implanted in brain tissue for 1 week (acute response) and 4 weeks (chronic response). Qualitative and quantitative analysis of neuronal and immunological responses revealed significant changes in immunological response to implanted materials depending on the type of biomolecule used. The potential to manipulate tissue response through the use of an anti-inflammatory protein, alpha-melanocyte stimulating hormone, was shown in the reduction of astroglia presence near the implant site during the glial scar formation. These results suggest that A-CNEs, which are soft, flexible, and easily made bioactive, have the ability to modify brain tissue response through surface modification as a function of the biomolecule used.
INTRODUCTION
Bioactive and biomimetic materials have been investigated with the goal to induce desired tissue responses. Employing the appropriate chemical and physical cues on implantable devices can result in improved tissue growth and reduced inflammation, a basic requirement for biomaterials intended for tissue engineering and regeneration.1-8 Suggested strategies to promote cellular attachment, growth, and morphogenesis have included modifying bulk and surface chemistries, applying structural motifs ranging from the micro to the nano scale, and tailoring of the mechanical properties of implants to match those of the surrounding tissue.1-7,9
A similar approach can be specifically applied to the field of cortical neural prosthetics.10,11 Neural prosthetics are implantable electronic devices aimed at recording electrical activity from brain tissue.12-15 We have developed composites of carbon nanotubes and agarose in wire-like constructs (A-CNEs) aimed for use as penetrating probes used for recording of single neuron action potentials. A-CNEs were designed with the intention to circumvent the biological and mechanical mismatch of current neural prosthetics, which produce a sustained immunological response (gliosis).10,11,16-18 A-CNEs are fabricated using (i) the natural polymer agarose, a soft, cell and protein repellant (in vitro) polysaccharide hydrogel19-21 and (ii) carbon nanotubes which are dispersed within the agarose matrix to provide the required electrical conductivity.
To mimic the protein expression on cell membranes in the manner of a glycocalyx,8,22-24 A-CNEs are surface modified through conjugation of biological moieties to the available free hydroxyl groups of agarose. The result is a polymer based carbon nanotube fiber-like electrode, that exhibits electrical conductivity close to that of doped silicon (130-160 S cm−1) with a soft structure (Young's modulus of 867 ± 247 MPa when dry, and 85.6 ± 12.8 MPa when hydrated).16
In this work, we used A-CNEs to probe the in vivo effect of functionalized neural implants using a brain tissue-response model. A-CNEs were functionalized by conjugating the biomolecules laminin and alpha-melanocyte stimulating hormone (αMSH). Laminin is an extracellular matrix protein, which has been shown to reduce glial responses25 whereas αMSH is a potent anti-inflammatory peptide.26 After implantation, the effect of implanted devices on astrocyte, microglia and neuronal responses was quantified using immunohistochemistry. Clear evidence of the effect of molecular tethering was obtained. Once the chronic glial response was given time to evolve, the αMSH-conjugated A-CNEs showed a significant reduction of astrocytic reactive response compared to the other groups, suggesting a potential path for future development of chronically implanted A-CNEs.
EXPERIMENTAL
A-CNE fabrication and functionalization was performed as previously described.16 Briefly, a dispersion containing 1 wt% of single walled nanotubes (Nanoledge, France) and 2 wt% agarose (Invitrogen, Grand Island, NY) in distilled water was prepared using a horn sonicator (Misonix S400, Farmingdale, NY). The dispersion was injected into a 1 mm diameter tube, allowed to gel, flushed out with water, and then dried, resulting in a semi-cylindrical device of approximately 200 μm width and 4 mm length. A cross-sectional view of the formed device is shown in the supplementary information (Figure S1). Laminin (Sigma, St. Louis, MO) and αMSH (Bachem, Torrance, CA) at 50 μg/mL were attached using cyanylating agent (CDAP). In the control A-CNEs no proteins were added. Verification of protein attachment was performed via immunohistochemical techniques16 using 1:100 dilutions of polyclonal antibodies (rabbit anti αMSH (Pierce Scientific, Rockford, IL), rabbit anti Laminin (Millipore, Billerica, MA)). Conjugated secondary antibodies were used to visualize the attachment of proteins (goat anti-rabbit Alexa 488 (Invitrogen, Grand Island, NY)). A-CNEs were incubated with antibodies and then imaged using an inverted fluorescent microscope (Axio Observer-D1, Carl Zeiss MicroImaging) with a 10X objective. Fluorescent imaging permitted observation of whether or not functionalization had occurred.
In vivo characterization was prepared as previously reported.16,27 Animal procedures were performed under the approval of the Wadsworth Center Institutional Animal Care and Use Committee (IACUC). Briefly, 4 mm long A-CNEs were first inserted into a 24G × 3/4″ clipped catheter (Terumo Somerset, NJ). The use of catheter tubes allowed for controlled and precise insertion of the implants. Catheters were placed in self-sealing sterilizable pouches, and sterilized with ethylene oxide gas (Anderson Products, Haw River, NC). It is important to note that we evaluated the effect of sterilization on physical properties of the A-CNE with no observed changes. Male Sprague–Dawley rats weighing 150-200 g were anesthetized using isoflurane maintained at 2% (in oxygen) for the duration of the procedure (approximately 60 min), and placed in a stereotaxic holder. Four craniotomy sites were drilled (two on each side of midline, one posterior to bregma and one anterior to lambda). The dura was transected at the area of interest. Catheter tubes with A-CNEs were placed above the insertion site, and lowered to the tissue surface using controlled arm of the stereotaxic holder. The complete insertion of the device itself was performed manually through the push of the needle section of the catheter (see supplementary information in reference 16). Cellulose dialysis film (Fisher Scientific, Waltham, MA) adhered to the skull was used to cover the insertion site and the skin was closed using staples. At 7 or 28 d after implantation, animals were perfused with 4% paraformaldehyde and the brain was removed and placed in 4% paraformaldehyde at 20°C for 24 hrs. After 24 hrs the brains were stored at 20°C in Hepes Hank's buffer containing sodium azide. Horizontal tissue slices, 80 μm thick were cut using a vibratory microtome. The sliced sections where inclusive of the implanted devices. Once sectioning was completed, A-CNEs remaining in the intact tissue were gently removed and processed similarly to the brain slices. Immunohistochemistry was performed on two sections 900–1100 μm down from the dorsal surface of the brain and results were compared for each experimental modification and at both time points. Three animals were studied for each time point. For each A-CNE type, two sections from each animal resulted in a total of six sections analyzed. Immunohistochemistry was performed using primary antibodies: 1) Astrocytes, rat anti-GFAP (Invitrogen, Grand Island, NY), 2) Microglia and macrophages, rabbit anti-Iba1 (Wako, Richmond, VA), 3) Neurons, mouse anti-neuron-specific protein (NeuN, Millipore, Billerica, MA). Secondary antibodies were (1) Goat anti-rabbit (Alexa Flour 488, Invitrogen, Grand Island, NY), (2) Goat anti-rat (Alexa Flour 594, Invitrogen, Grand Island, NY), (3) Goat anti-mouse (Alexa Fluor 546, Invitrogen, Grand Island, NY). Sections were mounted on glass slides with anti-fade reagent (Prolong Gold, Invitrogen, Grand Island, NY) for confocal imaging. Histological images were collected in the form of 3D data sets using a Leica SP2 confocal laser scanning inverted microscope with a 10x (NA 0.4) dry objective at a 2 μm step size (40 scans per area). Images were stacked into X, Y projections of the entire Z dimension from each sample, which allowed for evaluation of the cellular population surrounding the insertion sites. Magnified images were taken using a 40x (NA 0.8) dry objective. Changes in immunohistochemistry immediately around the insertion sites and in 25 μm increments up to 150 μm away (the distance at which normal morphology was exhibited) were quantified using image J (NIH) as described elsewhere.27 Briefly, individual channels were converted to 8 bit, and the background and intensity were corrected. For GFAP and Iba1, radial profile plots of normalized integrated intensities from the implant site as a function of distance from the fiber center were calculated. The averaged intensity gradients were plotted along with the standard deviation. For the NeuN channel, additional processing was performed. Images were processed with thresholding and watershedding methods, and the analyze particles plugin was used to count the number of NeuN positive cells at fixed distance increments (100 μm bands) measured from the implant surface. Cell numbers from bands at 0-100 μm (the critical distance for recording28) and 300-400 μm (control distance) are shown. Collected data was normalized to the control region of the control implant. The identity of the samples was concealed until after all analyses were performed.
Statistical analysis was performed using Addinsoft statistical software. For comparisons involving multiple conditions, standard analysis of variance (ANOVA) was used to evaluate independent quantitative effects of conjugated protein, implantation period (1 and 4 weeks), and distance from implant. When a significant difference was found between groups, Tukey's Honesty Significant Difference (HSD) post-hoc test was utilized to identify pair-wise differences. A p-value of less than 0.01 was considered significant.
RESULTS
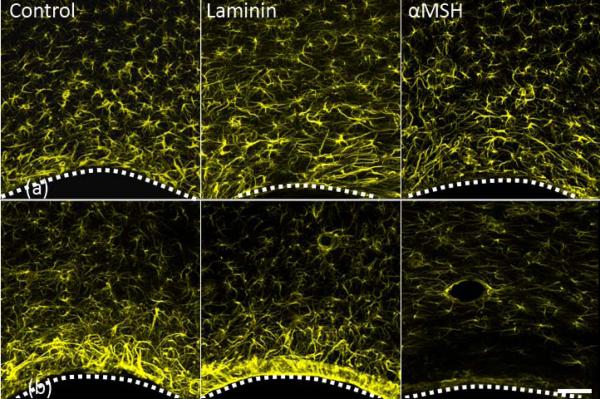
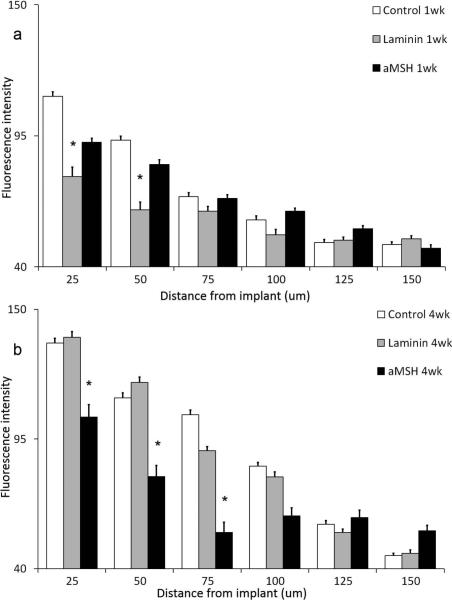
Figures 1a and 1b show representative micrographs of the astrocyte (GFAP) response after 1 and 4 weeks of A-CNEs implantation. The A-CNEs surface is at the bottom of each image. The corresponding quantified response is illustrated in Figure 2a and 2b. Although it is difficult to visually distinguish between groups after 1 week (Figure 1a), quantitative analyses reveal that the astroglial reactive response seen adjacent to the insertion site (up to 50 μm) was least intense for the laminin conjugate (Figure 2a). At 75 μm and farther out, the measured GFAP response for all samples was equivalent to the controls. These data agree with previous findings where laminin exhibited reduction in astrocyte response during the acute phase.16
Figure 1.
Projected confocal images of GFAP positive cells (astrocytes) response to implanted A-CNEs (control, laminin, and α-SMH). (a) one week after insertion. (b) four weeks after insertion. A dotted white line illustrates the A-CNE (in black)-tissue interface. A significant reduction in astrocyte activity near the implant surface is observed for α-SMH A-CNE at 4 weeks. Small circular features surrounded by astrocytes (laminin and α-SMH at 4 weeks) are blood vessels. Scale bar 50 μm.
Figure 2.
Astrocyte quantitative profile analysis expressed by the fluorescence intensity as a function of distance from A-CNEs surface (mean + s.e.m). (a) After 1 week, (b) after 4 weeks. Significant difference between treatments within each distance is marked with “*”.
The acute response evolves into a chronic response over the course of 4 weeks. At the 4-week time point, differences between the treatment groups can be observed both qualitatively and quantitatively. Figure 1b illustrates the differences among the treatment groups. A reduction is evident in reactive astrocyte response at the area immediately adjacent to the A-CNE that is functionalized with αMSH compared to the other samples. Quantitative analysis (Figure 2b) reveals that at the implant vicinity a significant increase in the GFAP intensity is observed after 4 weeks as compared to 1 week for all but the A-CNEs conjugated with αMSH. The αMSH treated sample exhibit a temporal reduction in astrocyte response. When comparing intensity values between time points (Figure 2a compared to Figure 2b), αMSH treated A-CNEs display sustained (25 μm) and even reduced (50 μm and 75 μm) intensity during the chronic phase, while the control and laminin samples exhibit an increased temporal intensity.
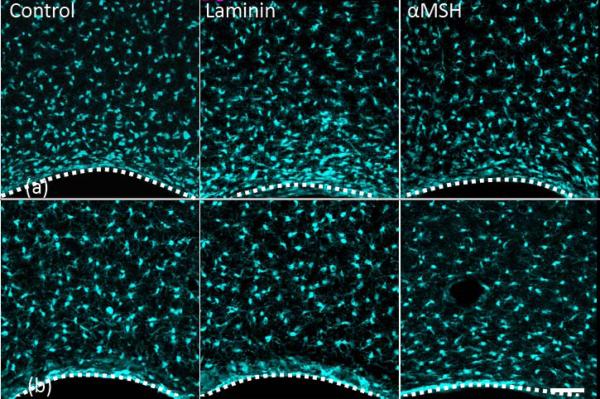
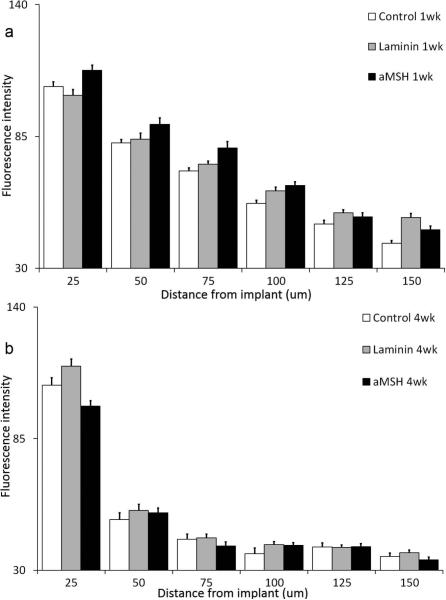
Figure 3 provides data for microglia (Iba1). Figures 3a and 3b show the response after 1 and 4 weeks of A-CNEs implantation, respectively. Amoeboid microglia (reactive state) morphology is found at the tissue-A-CNE interface, compared to the resting microglia state seen farther away. Figures 4a and 4b provide a quantitative analysis of the images shown in Figures 3a and 3b. For all conjugates, a decrease in Iba1 expression is observed from the early to the later time point.
Figure 3.
Projected confocal images of Iba-1 positive cells (microglia) response to implanted A-CNEs (control, laminin, and α-SMH). (a) one week after insertion. (b) four weeks after insertion. A dotted white line illustrates the A-CNE (in black)-tissue interface (laminin and α-SMH at 4 weeks) are blood vessels Scale bar 50 μm.
Figure 4.
Microglia quantitative profile analysis expressed by the fluorescence intensity as a function of distance from A-CNEs surface (mean + s.e.m). (a) After 1 week, (b) after 4 weeks.
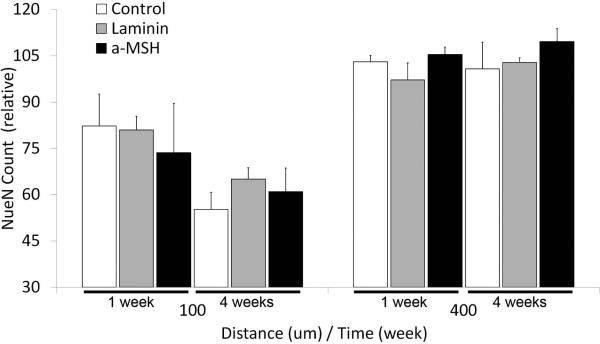
Micrographs showing neuronal somas are shown in Figures 5a and 5b. The average number of neurons counted in bands that are at distances of 0-100 μm or 300- 400 μm away from the A-CNE surface are shown in Figure 6. The band closer to the A-CNE surface (0 to 100 μm) is slightly affected by the implant, while we assume that the distant region (300 to 400 μm) neuron number appears to be unaffected by the insertion of the A-CNE. A reduced number of neurons is observed for all the 0-100 μm bands when compared to the 300-400 μm bands, regardless of the treatment.
Figure 5.
Projected confocal images of A-CNEs (control, laminin, α-MSH). (a) one week after insertion, (b) four weeks after insertion. Images are overlay of all three channels (astrocytes-yellow, microglia – cyan, and neurons-magenta). A dotted white line illustrates the A-CNE (in black)-tissue interface. Small circular features surrounded by astrocytes (laminin and α-SMH at 4 weeks) are blood vessels Scale bar 50 μm.
Figure 6.
Normalized neuronal soma count as a function of distance from A-CNEs surface after 1 and 4 weeks of implantation (mean + s.e.m).
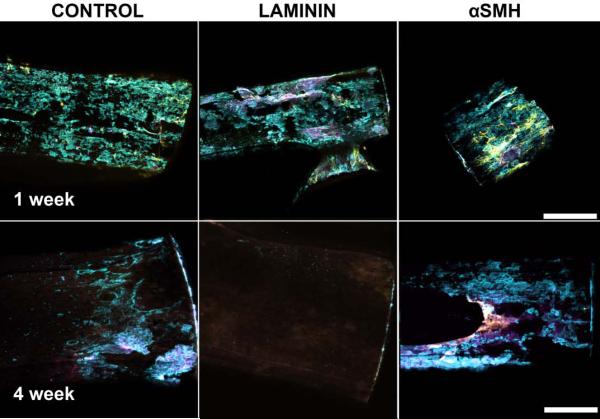
Once sectioning was completed, the remaining implanted A-CNEs were removed from the tissue, then stained and imaged as described above. This allowed a qualitative evaluation of the cellular population on the surface of individual A-CNEs (Figure 7). After 1 week, all samples exhibited cellular attachment. The most prevalent cells were microglia. Astrocytes were less prevalent, and neurons were least prevalent. After 4 weeks, the total number of cells attached to the implants was significantly reduced compared to the 1 week time point; laminin treated A-CNE samples exhibited virtually no cellular attachment. The αMSH treated A-CNEs displayed mostly microglia attachment, with little expression of astrocytes and neurons.
Figure 7.
Projection confocal images of A-CNEs extracted from brains after 1 week (top) and 4 weeks (bottom). Astrocytes (GFAP) appear in yellow, microglia ( Iba-1) appear in cyan, and neurons (NeuN) appear in magenta. (Scale bar 100 μm).
DISCUSSION
The formation of a continuous electrically conductive carbon nanotube structure using agarose, a naturally available polysaccharide, as the polymeric constituent, results in a new type of electrode. This material may be useful for various applications in tissue engineering and regenerative therapies.16 In this study we investigated whether surface functionalization of ACNEs enhances their potential to perform as implantable devices.
A-CNEs were functionalized by the attachment of laminin or αMSH. For both types of modified A-CNE, we observed a time-dependent change of the tissue response. This is in agreement with previous literature reports.17,29
Within 4 weeks, a sufficient period for the development of a chronic glial response,17,29 a significant difference was observed between the αMSH conjugated A-CNEs and the rest of the implant groups. This finding is based both on qualitative (visual) inspection of the GFAP micrographs (Figures 1a and 1b), and on quantitative data analysis. The control and laminin ACNEs exhibited an increase in astrocyte intensity at the implant vicinity. This is an expected outcome for brain implants.29 The αMSH implants prompted a reduced astrocytic response (Figures 2a and 2b). The thickness of the astrocyte sheath can be measured in accordance to return to normal astrocyte intensity levels (about 60 A.U). The αMSH implants returned to normal levels within 50 μm, while the control and laminin samples returned to normal levels after 100 μm. It is commonly agreed that indwelling brain implants lead to increased GFAP intensity over time, specifically at the implant-tissue interface, resulting in a dense astrocyte layer at the implant surface (“glial scar”).29-31 Thus, control and laminin conjugated A-CNEs conform to this pattern, while αMSH seems to reduce astrocyte response, possibly due to its potential to act as an inhibitor of pro-inflammatory cytokines.26,32,33
Initially, laminin treated A-CNEs elicited a less intense astrocyte response than any of the other treatment groups. This initial observation is in agreement with our previous finding that laminin reduced the astrocyte response during the first 2 weeks after implantation.16 However, this trend did not last, and by 4 weeks, the astrocyte response of laminin A-CNEs was no longer different from that of the control A-CNEs. It is possible that the continuous availability of laminin, when tethered to the A-CNE, resulted in continuous astroglial stimulation.34
Brain implants are normally associated with stagnation30 or a slight reduction35 over time in activated microglia at the implant interface. The microglia reaction to all the A-CNEs is in agreement with these observations (Figures 3 and 4).
Relative neuronal numbers, expressed by NeuN count, decreased in the vicinity (0-100 μm) of the implant regardless of the A-CNE type (Figures 5 and 6). This localized neurodegeneration is expected when active microglia and astrocytes are present at the implant site.30 However, in this study, the extent of activation of microglia and astrocytes could not be directly correlated to neuronal numbers. It has been suggested that neural loss, mediated by neurotoxic and inhibitory molecules, is a progressive process that could continue long after the activation of glial cells.36 Thus, it is possible that within the 4 week period of the study, a difference in neuronal numbers between groups cannot be observed. Additionally, the dissociation of the neuronal count form the astroglial and microglial responses through the use of mechanically compatible implants has been proposed.37 When an astroglial scar surrounds an implanted electrode, it directly increases its local electrical impedance .38,39 Since neural loss is (to various extents) expected, the reduction of both scar formation and the impedance due to decreasing astrocytes at the implant vicinity could result in an electrode with longer endurance and better overall performance.
The explanted A-CNEs (Figure 7) exhibited noticeable cell attachment after 1 week. Observed cells are mostly microglia, but some evidence of neuronal and astrocytic cells is observed. Within 4 weeks, the αMSH explants seemed to exhibit more microglia attachment than the other samples. Spataro et al.,40 have found no correlation between cell attachment to implanted devices and the attenuation of the glial response achieved using dexamethasone. Evidence exists to the potential positive outcome of attachment of inflammatory cells to an implanted device through reduction in cytokine production,26 and providing an environment for cell attachment that does not promote formation of a foreign body reaction. Yet this phenomenon needs to be further studied specifically through the careful analysis of the microglia phenotype.
CONCLUSIONS
The types of biomolecules employed to functionalize the A-CNE surface can be used to direct the tissue response in vivo. This observation opens the door to the systematic exploration of various surface modifications of nanocarbon-based electrodes to improve the performance of implantable neural devices. Promising results were obtained when αMSH was bound to the A-CNE surface. With further development, the technological platform provided by surface modified A-CNEs could advance the field of invasive neural interfaces. Two approaches could apply, either through surface-modified A-CNEs used as microwire electrodes, or through functionalized A-CNEs coatings for already existing neural prosthetics.
Supplementary Material
ACKNOWLEDGEMENTS
This work was supported by RESBIO (Integrated Technology Resource for Polymeric Biomaterials), funded by National Institutes of Health (NIBIB and NCMHD) under grants P41 EB001046 and R01 EB007467, and the Graduate Assistance in Areas of National Need (GAANN) in pharmaceutical engineering. We also acknowledge support from the New Jersey Center for Biomaterials at Rutgers University and the Rutgers NFS SOPS Engineering Center. The content is solely the responsibility of the authors and does not necessarily represent the official views of the NIH, NSF, or GAANN.
Footnotes
(Additional Supporting Information may be found in the online version of this article)
REFERENCES
- 1.Dvir T, Timko BP, Kohaneand DS, Langer R. Nat Nano. 2011;6:13–22. doi: 10.1038/nnano.2010.246. [DOI] [PMC free article] [PubMed] [Google Scholar]
- 2.Mitragotriand S, Lahann J. Nat Mater. 2009;8:15–23. doi: 10.1038/nmat2344. [DOI] [PMC free article] [PubMed] [Google Scholar]
- 3.Place ES, Evansand ND, Stevens MM. Nat Mater. 2009;8:457–470. doi: 10.1038/nmat2441. [DOI] [PubMed] [Google Scholar]
- 4.Henchand LL, Thompson I. Journal of The Royal Society Interface. 2010;7:S379–S391. doi: 10.1098/rsif.2010.0151.focus. [DOI] [PMC free article] [PubMed] [Google Scholar]
- 5.Lutolfand MP, Hubbell JA. Nat Biotech. 2005;23:47–55. doi: 10.1038/nbt1055. [DOI] [PubMed] [Google Scholar]
- 6.Langerand R, Vacanti JP. Science. 1993;260:920–926. doi: 10.1126/science.8493529. [DOI] [PubMed] [Google Scholar]
- 7.Henchand LL, Polak JM. Science. 2002;295:1014–1017. doi: 10.1126/science.1067404. [DOI] [PubMed] [Google Scholar]
- 8.Holland NB, Qiu Y, Ruegseggerand M, Marchant RE. Nature. 1998;392:799–801. doi: 10.1038/33894. [DOI] [PubMed] [Google Scholar]
- 9.Bridgesand AW, Garcia AJ. J Diabetes Sci Technol. 2008;2:984–994. doi: 10.1177/193229680800200628. [DOI] [PMC free article] [PubMed] [Google Scholar]
- 10.Marinand C, Fernandez E. Front Neuroengineering. 2010;3:8. doi: 10.3389/fneng.2010.00008. [DOI] [PMC free article] [PubMed] [Google Scholar]
- 11.Reichert WM. Indwelling neural implants : strategies for contending with the in vivo environment. CRC Press; Boca Raton: 2008. [PubMed] [Google Scholar]
- 12.Hochberg LR, Serruya MD, Friehs GM, Mukand JA, Saleh M, Caplan AH, Branner A, Chen D, Pennand RD, Donoghue JP. Nature. 2006;442:164–171. doi: 10.1038/nature04970. [DOI] [PubMed] [Google Scholar]
- 13.Moritz CT, Perlmutterand SI, Fetz EE. Nature. 2008;456:639–642. doi: 10.1038/nature07418. [DOI] [PMC free article] [PubMed] [Google Scholar]
- 14.Velliste M, Perel S, Spalding MC, Whitfordand AS, Schwartz AB. Nature. 2008;453:1098–1101. doi: 10.1038/nature06996. [DOI] [PubMed] [Google Scholar]
- 15.Normann RA. Nat Clin Pract Neuro. 2007;3:444–452. doi: 10.1038/ncpneuro0556. [DOI] [PubMed] [Google Scholar]
- 16.Lewitus DY, Landers J, Branch JR, Smith KL, Callegari G, Kohnand J, Neimark AV. Advanced Functional Materials. 2011;21:2624–2632. doi: 10.1002/adfm.201002429. [DOI] [PMC free article] [PubMed] [Google Scholar]
- 17.Polikov VS, Trescoand PA, Reichert WM. J Neurosci Methods. 2005;148:1–18. doi: 10.1016/j.jneumeth.2005.08.015. [DOI] [PubMed] [Google Scholar]
- 18.Shain W, Spataro L, Dilgen J, Haverstick K, Retterer S, Isaacson M, Saltzmanand M, Turner JN. 2003:186–188. doi: 10.1109/TNSRE.2003.814800. [DOI] [PubMed] [Google Scholar]
- 19.Mercey E, Obeïd P, Glaise D, Calvo-Muñoz M-L, Guguen-Guillouzoand C, Fouqué B. Biomaterials. 2010;31:3156–3165. doi: 10.1016/j.biomaterials.2010.01.020. [DOI] [PubMed] [Google Scholar]
- 20.Luoand Y, Shoichet MS. Nat Mater. 2004;3:249–253. doi: 10.1038/nmat1092. [DOI] [PubMed] [Google Scholar]
- 21.Sapsfordand KE, Ligler FS. Biosensors and Bioelectronics. 2004;19:1045–1055. doi: 10.1016/j.bios.2003.10.002. [DOI] [PubMed] [Google Scholar]
- 22.Yang Q, Kauland C, Ulbricht M. Langmuir. 2010;26:5746–5752. doi: 10.1021/la903895q. [DOI] [PubMed] [Google Scholar]
- 23.Guillame-Gentil O, Semenov O, Roca AS, Groth T, Zahn R, Vörösand J, Zenobi-Wong M. Advanced Materials. 2010;22:5443–5462. doi: 10.1002/adma.201001747. [DOI] [PubMed] [Google Scholar]
- 24.Mager MD, LaPointeand V, Stevens MM. Nat Chem. 2011;3:582–589. doi: 10.1038/nchem.1090. [DOI] [PubMed] [Google Scholar]
- 25.He W, McConnelland GC, Bellamkonda RV. Journal of Neural Engineering. 2006;3:316–326. doi: 10.1088/1741-2560/3/4/009. [DOI] [PubMed] [Google Scholar]
- 26.Go DP, Palmer JA, Grasand SL, O'Connor AJ. Journal of Biomedical Materials Research Part A. 2012;100A:507–517. doi: 10.1002/jbm.a.33299. [DOI] [PubMed] [Google Scholar]
- 27.Lewitus DY, Smith KL, Shain W, Bolikaland D, Kohn J. Biomaterials. 2011;32:5543–5550. doi: 10.1016/j.biomaterials.2011.04.052. [DOI] [PMC free article] [PubMed] [Google Scholar]
- 28.Henze DA, Borhegyi Z, Csicsvari J, Mamiya A, Harrisand KD, Buzsáki G. Journal of Neurophysiology. 2000;84:390–400. doi: 10.1152/jn.2000.84.1.390. [DOI] [PubMed] [Google Scholar]
- 29.Szarowski DH, Andersen MD, Retterer S, Spence AJ, Isaacson M, Craighead HG, Turnerand JN, Shain W. Brain Res. 2003;983:23–35. doi: 10.1016/s0006-8993(03)03023-3. [DOI] [PubMed] [Google Scholar]
- 30.McConnell GC, Rees HD, Levey AI, Gutekunst CA, Grossand RE, Bellamkonda RV. Journal of Neural Engineering. 2009;6:056003. doi: 10.1088/1741-2560/6/5/056003. [DOI] [PubMed] [Google Scholar]
- 31.Turner JN, Shain W, Szarowski DH, Andersen M, Martins S, Isaacsonand M, Craighead H. Experimental neurology. 1999;156:33–49. doi: 10.1006/exnr.1998.6983. [DOI] [PubMed] [Google Scholar]
- 32.Zhongand YH, Bellamkonda RV. Journal of Controlled Release. 2005;106:309–318. doi: 10.1016/j.jconrel.2005.05.012. [DOI] [PubMed] [Google Scholar]
- 33.He W, McConnell GC, Schneiderand TM, Bellamkonda RV. Advanced Materials. 2007;19:3529–3533. [Google Scholar]
- 34.Panickarand KS, Norenberg MD. Glia. 2005;50:287–298. doi: 10.1002/glia.20181. [DOI] [PubMed] [Google Scholar]
- 35.Winslow BD, Christensen MB, Yang WK, Solzbacherand F, Tresco PA. Biomaterials. 2010;31:9163–9172. doi: 10.1016/j.biomaterials.2010.05.050. [DOI] [PubMed] [Google Scholar]
- 36.Zhongand Y, Bellamkonda RV. Brain Research. 2007;1148:15–27. doi: 10.1016/j.brainres.2007.02.024. [DOI] [PMC free article] [PubMed] [Google Scholar]
- 37.Harris JP, Capadona JR, Miller RH, Healy BC, Shanmuganathan K, Rowan SJ, Wederand C, Tyler DJ. Journal of Neural Engineering. 2011;8:066011. doi: 10.1088/1741-2560/8/6/066011. [DOI] [PMC free article] [PubMed] [Google Scholar]
- 38.McConnell GC, Buteraand RJ, Bellamkonda RV. Journal of Neural Engineering. 2009;6:055005. doi: 10.1088/1741-2560/6/5/055005. [DOI] [PubMed] [Google Scholar]
- 39.Williams JC, Hippensteel JA, Dilgen J, Shainand W, Kipke DR. Journal of Neural Engineering. 2007;4:410–423. doi: 10.1088/1741-2560/4/4/007. [DOI] [PubMed] [Google Scholar]
- 40.Spataro L, Dilgen J, Retterer S, Spence AJ, Isaacson M, Turnerand JN, Shain W. Experimental neurology. 2005;194:289–300. doi: 10.1016/j.expneurol.2004.08.037. [DOI] [PubMed] [Google Scholar]
Associated Data
This section collects any data citations, data availability statements, or supplementary materials included in this article.


