

Abstract
Cigarette smoking is a major global public health issue and the leading cause of preventable death in the United States. Toward a goal of designing better smoking cessation treatments, system identification techniques are applied to intervention data to describe smoking cessation as a process of behavior change. System identification problems that draw from two modeling paradigms in quantitative psychology (statistical mediation and self-regulation) are considered, consisting of a series of continuous-time estimation problems. A continuous-time dynamic modeling approach is employed to describe the response of craving and smoking rates during a quit attempt, as captured in data from a smoking cessation clinical trial. The use of continuous-time models provide benefits of parsimony, ease of interpretation, and the opportunity to work with uneven or missing data.
Keywords: continuous-time identification, behavioral science, statistical mediation, smoking cessation, self-regulation
1 Introduction
Cigarette smoking is a major global public health issue. Approximately 10 million annual global deaths are expected to result from smoking by 2020 (Fish and Bartholomew 2007), and the global smoking population is expected to surpass 1.7 billion by 2025 (Erhardt 2009). In the U.S., cigarette smoking is the leading cause of premature death and $157B in economic loss is attributed to tobacco use annually (Centers for Disease Control and Prevention 2010, Killeen 2011). 40 years of decreases in smoking rates have recently stalled in the U.S., where one in five adults is an active smoker (Centers for Disease Control and Prevention 2012). This smoking rate persists despite the fact that nearly 70% of smokers have expressed a desire to quit (Centers for Disease Control and Prevention 2011). Largely due to the chronic, relapsing nature of cigarette smoking (Fiore et al. 2008), over 88% of attempts to quit smoking fail (American Cancer Society 2012).
Interventions play an important role in smoking prevention and cessation. Generally speaking, interventions for behavioral health disorders seek to reduce unhealthy behaviors and promote healthy ones through prevention or treatment, and are used to address many public health concerns in addition to smoking such as other substance abuse, obesity, sexually transmitted infections, and cancer screening, and can be pharmacological or behavioral in nature (Collins 2012, Baker et al. 2011). Traditionally, these interventions are “fixed,” meaning they are not systematically operationalized, and the composition and dosage of an intervention component is given to all individuals receiving the intervention and do not vary over time (Collins et al. 2004). The effectiveness of existing fixed smoking cessation interventions is limited. Counseling alone, for example, has a reported success rate below 15% (Fiore et al. 2008, Fish and Bartholomew 2007). Pharmacological interventions (e.g., nicotine replacement therapies such as Nicorette®) have individual one-year abstinence rates below 35% (Fish and Bartholomew 2007), which may be lower at longer term follow-up (Irvin and Brandon 2000, Irvin et al. 2003). Such low success rates are particularly troubling given the gravity of cigarette smoking as a public health issue.
To address the limitations of fixed interventions, recent efforts in behavioral health have centered around development of so-called “adaptive” interventions, where treatment components and dosage vary according to participant response (Collins et al. 2004). These interventions consist of closed-loop dynamical systems and may be more effective behavioral health interventions as they essentially seek to optimally adapt to the changing needs of a patient (Rivera et al. 2007, Nandola and Rivera 2013). Control systems engineering principles offer an appealing framework for developing algorithms that implement these optimized, time-varying smoking cessation interventions. However, the impact of using control engineering concepts in the design of time-varying smoking cessation interventions is tied to the reliability of the smoking behavior change models upon which the algorithms are based (Nandola and Rivera 2013, Rivera 2012, Riley et al. 2011).
The development of reliable models has been greatly enhanced by increased access to intensive longitudinal data (ILD). ILD in behavioral settings is loosely defined as quantitative or qualitative measurements recorded frequently over time, and is more readily available due to increasing use of mobile and computerized technologies in behavioral trials (Walls and Schafer 2006). ILD facilitates the dynamic modeling of behavior, and generally provides a means for improved analysis of inter- and intra-individual variability (Collins 2006). In the context of cigarette smoking, ILD offers an opportunity to study the dynamics of smoking behavior change (e.g., daily smoking rate, average craving level) during a quit attempt. Whereas traditional quantitative modeling methodologies from behavioral science (e.g., structural equation models, SEMs) are static in nature (Bollen 1989), dynamical systems modeling and system identification offer a framework for more comprehensive characterization of dynamic behavioral relationships and how smoking cessation interventions affect these dynamics (Timms et al. 2012). Recently, similar models have been used for improved evaluation of gestational weight gain and fibromyalgia interventions; these models also offer an appealing basis for development of optimized, time-varying interventions that draw from control systems engineering principles (Dong et al. 2013, Nandola and Rivera 2013, Rivera 2012, Deshpande et al. 2011). In terms of smoking cessation, an intervention based in controller design methods could feature feedback in order to systematically assign medication dosages based on patient reports of withdrawal symptoms, for example (Timms et al. 2013). Given the gravity of cigarette smoking as a public health issue and the modest effectiveness of even the most efficacious treatments available, an improved ability to inform and evaluate behavioral health interventions warrants development of dynamic models of smoking cessation.
In this article, smoking cessation is described as a process of behavior change, and this process is represented via continuous-time models. A continuous-time approach is particularly appealing in behavioral health settings (Timms et al. 2012, Rivera 2012). Notably, for low order dynamics (which appears to be the case for many dynamic behaviors; Timms et al. 2012, in press, Deshpande et al. 2011, Rivera 2012), continuous-time models estimated from discrete-time data result in parsimonious expressions through which important dynamic features are more easily discerned. Consequently, insight into behavioral phenomena and intervention effects may be more easily interpretable with continuous-time models. As will be demonstrated, continuous-time models that capture inverse response in craving during a quit attempt can be easily identified with a right half plane zero term, the estimated value of which may shed light on underlying dynamic phenomena (Timms et al. 2012, 2013). Similarly, the parameters in continuous-time models are more meaningful in terms of understanding a process, as such models more transparently describe the continuous nature of actual physical systems of interest. An a priori understanding of a system can also be more easily preserved with continuous-time models, whereas discrete-time models of a second order system, for example, may introduce additional parameters due to sampling. Furthermore, discrete-time models estimated at fixed sampling rates may not be representative of process dynamics observed under different sampling rates (Garnier et al. 2008). This may be an important consideration given the range of time scales of interest to behavioral scientists (e.g., short term, long term, non-standard time periods such as pubertal time scales; Collins et al. 2004). Additionally, missing data and irregular sampling intervals are characteristic of self-reported behavioral health experiments, whether intentional or not; this supports the appeal of a continuous-time modeling approach, which will not have parameters that are a function of the sampling time, and therefore inherently manage the issue of non-ideal data measurement. Consequently, continuous-time models of discrete data collected at a sufficiently fast sampling rate can produce models that accurately represent the overall dynamics of behavioral phenomena, while avoiding challenges associated with missing data and inconsistent sampling intervals in discrete-time modeling (Garnier et al. 2008).
Behavioral scientists often rely on behavior change theories to guide intervention design, evaluation, and delivery (Riley et al. 2011). In the context of cigarette smoking, the concepts of statistical mediation and self-regulation have been of particular interest (Timms et al. 2012, in press, McCarthy et al. 2008b, Piper et al. 2008, Velicer et al. 1992, Walls and Rivera 2009). Statistical mediation is a modeling paradigm central to the social and behavioral sciences, describing a multivariate causal relationship in which an independent variable affects a mediator variable and an outcome variable, with the mediator also affecting the outcome (MacKinnon 2008). Self-regulation theory within smoking considers a process in which nicotine levels, behavioral state, or emotional state set points are regulated by smoking activity (Velicer et al. 1992, Walls and Rivera 2009, Solomon and Corbit 1974, Timms et al. 2013, in press). However, the utility of models that describe these behavior change theories for the purposes of development of optimized, time-varying interventions has been limited; this is largely a consequence of the static nature of traditional behavioral science models and the difficulties historically associated with intensive collection of behavioral data (Riley et al. 2011). This article employs a modeling framework that leverages ILD and continuous-time system identification in order to describe smoking cessation as a mediational and self-regulatory process.
This article is organized as follows. First, a clinical trial of bupropion and counseling as aids to smoking cessation is outlined; this study was conducted at the University of Wisconsin Center for Tobacco Research and Intervention (UW-CTRI) and funded by the Transdisciplinary Tobacco Use Research Centers (TTURC; McCarthy et al. 2008a). Behavioral signals for treatment group averages and two single subject examples from the clinical trial are then presented. The features of the signals of interest in this article—Craving, average daily craving level, and Cigsmked, total daily smoking—are discussed in general terms. Statistical mediation is first presented in conceptual terms and the connection to dynamic model development is then outlined. The iterative procedure used for model estimation is then described and the resulting empirical dynamic mediation models are discussed. Next, self-regulatory smoking cessation models are presented, estimated, and compared. In examination of both the mediation and self-regulation models, parameter estimates and model simulations are analyzed for treatment group averages. Following this, examples of single subject models are briefly discussed. Finally, conclusions and recommendations are presented.
2 Smoking Cessation Intervention Overview
Dynamic models are obtained in a secondary analysis of a TTURC-funded study conducted by the UW-CTRI. In this double-blinded, placebo-controlled, randomized clinical trial, 101 subjects received both active bupropion and counseling as treatment (the “AC” group), 101 received active bupropion and no counseling (“ANc”), 100 received a placebo and counseling (“PC”), and 101 received a placebo and no counseling (“PNc”). Participants receiving bupropion took 150 mg per day starting one week prior to the quit date and 300 mg per day from four days prior to quit to eight weeks post-quit. Bupropion SR (Zyban SR) is commonly prescribed as a smoking cessation treatment (Fish and Bartholomew 2007, Fiore et al. 2008), although the exact mechanism that makes it an effective smoking treatment is debated (Horst and Preskorn 1998, Warner and Shoaib 2005). Generally, bupropion is thought to interfere with nicotine dependence mechanisms (Warner and Shoaib 2005), and has been shown to alleviate withdrawal symptoms, including craving (McCarthy et al. 2008a). In lieu of active bupropion, the PC and PNc groups took placebo medication. Subjects receiving counseling completed two pre-quit counseling sessions, one quit-date session, and five sessions over the following four weeks post-quit. Sessions focused on preparation, coping, motivation, and relapse prevention. In lieu of counseling, the ANc and PNc groups spoke with staff about medication use adherence and received general encouragement (McCarthy et al. 2008a).
For the two weeks prior to and four weeks immediately following the target quit date, participants were instructed to complete assessments through personal digital assistants (PDAs) each day immediately after waking up, before going to bed, and four to seven times throughout the day as prompted by the PDA at pseudo-random intervals. These self-reports generally collected data on smoking frequency and withdrawal symptoms. Although data from each set of reports or a combination of reports could be used to model the smoking process, the Evening Report (ER) is the focus of this article’s efforts. The ER featured questions on a 10 point Likert scale covering topics such as withdrawal symptoms (McCarthy et al. 2008a), positive affect (generally, the degree to which an individual feels enthusiastic and alert), negative affect (generally, the degree to which an individual feels anger, disgust, guilt, fear, and nervousness; Watson et al. 1988), and motivation to abstain. Table 1 provides a selection of items from the ER (McCarthy et al. 2008a). The relationship between Craving and Cigsmked variables is the focus of this article, as was done in a statistical study of the same ILD by McCarthy et al. (2008b). Craving is defined as the sum of Urge, Cigonmind, Thinksmk, and Bother. Cigsmked is the total number of cigarettes smoked per day.
Table 1.
Representative subset of questions from the Evening Report.
| Code | Question | Scale |
|---|---|---|
| Urge | Since last ER on average—Bothered by urges? | 1-11, No!!…Yes!! |
| Cigonmind | Since last ER on average—Cigarettes on my mind? | 1-11, No!!…Yes!! |
| Thinksmk | Since last ER on average—Thinking about smoking a lot? | 1-11, No!!…Yes!! |
| Bother | Since last ER on average—Bothered by desire to smoke? | 1-11, No!!…Yes!! |
| Enthus | Since last ER on average—Enthusiastic? | 1-11, No!!…Yes!! |
| Tense | Since last ER on average—Tense or anxious? | 1-11, No!!…Yes!! |
| Sad | Since last ER on average—Sad or depressed? | 1-11, No!!…Yes!! |
| Anger | Since last ER on average—Bothered by anger/irritability? | 1-11, No!!…Yes!! |
| Excellent | Since last ER on average—Concentration was excellent? | 1-11, No!!…Yes!! |
| Happy | Since last ER on average—Happy and content? | 1-11, No!!…Yes!! |
| Food | Since last ER on average—Thinking about food a lot? | 1-11, No!!…Yes!! |
| Confidence | Since last ER on average—Confidence in ability to quit? | 1-11, Low!!…High!! |
| Motive | Since last ER on average—Motivation to quit/stay quit? | 1-11, Low!!…High!! |
| Cigsmked | Total number of cigarettes smoked since the last ER? | 0-99 |
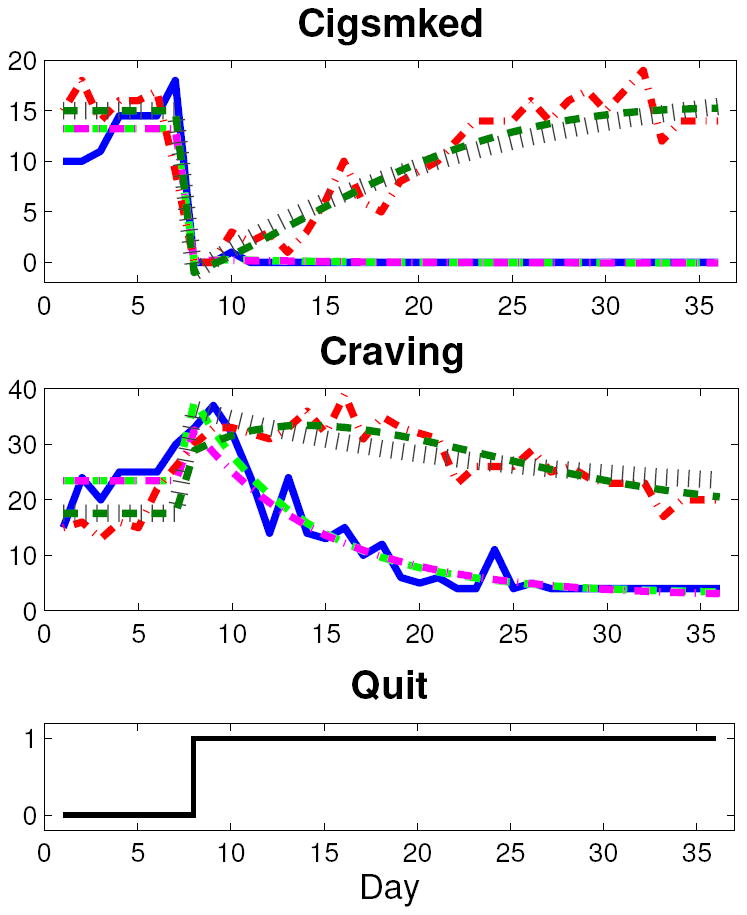
Both nomothetic (group level) and idiographic (single participant) models are of general interest to behavioral scientists. In this article, treatment group average models are the primary focus. To produce the group average signal, each report item was averaged across all members in a group for each relative day over the week prior to and four weeks immediately following the target quit date. This filtering that occurs by averaging the data across all single subject data points in a group, and putting the time series in deviation variable form, was the only data preprocessing done prior to group average model estimation. While the continuous-time approach employed here can effectively model data with missing samples or non-constant sampling, missing ER data for the two single subject examples was interpolated for straightforward use of standard MATLAB estimation routines. Interpolation consisted of averaging adjacent measured values or extending the adjacent measured value to the appropriate boundary. For the single subject example from the AC group, eight days of data points were imputed. Seven days of data points were imputed for the single subject example from the PNc group. Although single subject data sets are often noisier than corresponding group average data, no filtering was done on these data prior to idiographic model estimation. Figure 1 depicts the Craving and Cigsmked ILD for two group averages (solid blue, AC; dashed green, PNc) and two single subject examples (dash-dot magenta, AC; dotted red, PNc).
Figure 1.
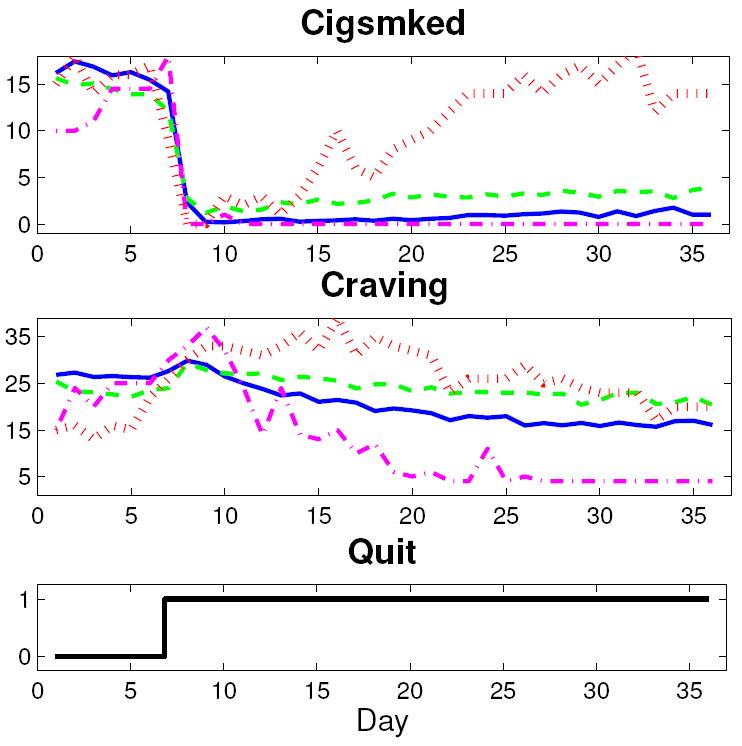
Plots of two group average (solid blue, AC; dashed green, PNc) and two single subject (dash-dot magenta, AC; dotted red, PNc) data sets.
As seen in Figure 1, the group average Craving signals feature quit-induced inverse response. With a continuous-time modeling approach, a priori knowledge that the groups’ Craving signals features a right half plane zero is more easily preserved (Garnier et al. 2008). The group average Cigsmked signals feature a dramatic quit-day drop, followed by a relatively small and slow resumption of smoking. The single subject data sets display greater variability. In Figure 1, the PNc single subject does not feature a net reduction in craving. The AC subject has little resumption in smoking—reflecting a successful quit attempt—while the PNc subject features significant resumption to approximately pre-quit levels.
3 Statistical Mediation Modeling
The concept of statistical mediation is a prominent model of change in the social and behavioral sciences. As previously described, mediation defines a causal relationship in which an independent variable, X, affects a mediator, M, and an outcome, Y, with M also contributing to Y (MacKinnon 2008). Behavioral scientists use path diagrams to depict this type of process (MacKinnon 2008, Bollen 1989). A mediational model path diagram—not to be confused with a block diagram—is depicted in Figure 2(a): a, b, and c′ represent gains for the X to M, M to Y, and X to Y pathways, respectively (MacKinnon 2008). Structural Equation Model (SEM) representations of mediation are found in Equations 1 and 2.
| (1) |
| (2) |
Figure 2.
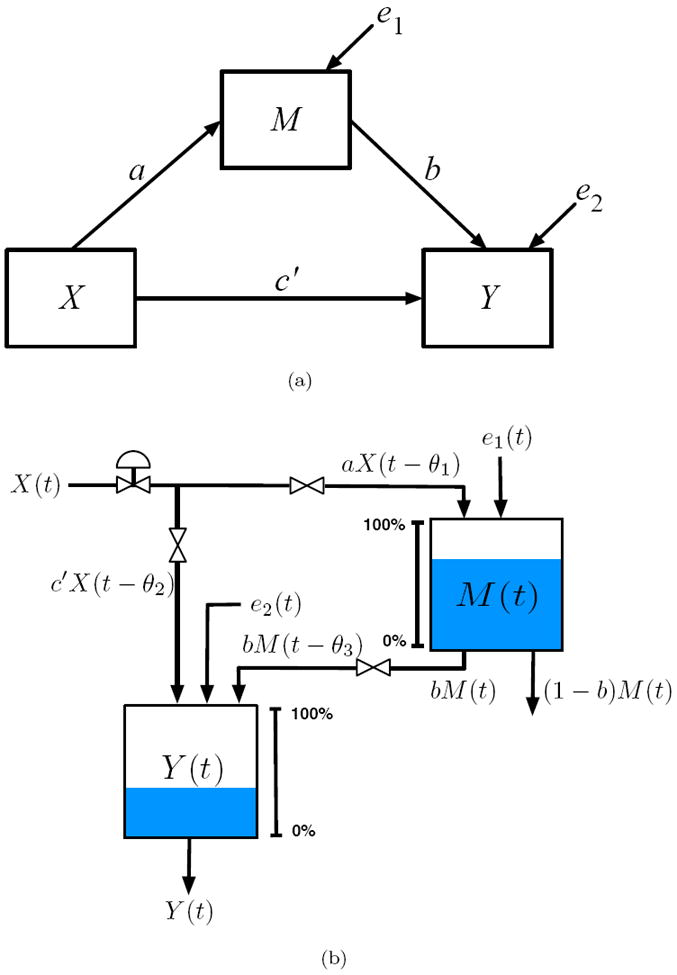
(a) Path diagram, used in structural equation modeling (SEM) to describe the relationship between variables, for a classic mediational model. (b) Fluid analogy for mediated behavior change developed from production inventory management models in supply chains.
Historically, Equations 1 and 2 have characterized mediation thought to be captured within cross-sectional studies; X typically codes the presence or absence of an intervention and M and Y data are collected at a small number of time points (MacKinnon 2008).
A dynamical framework is developed in this manuscript according to a more general definition of mediation described in Collins et al. (1998). Collins et al. (1998) underscores a temporal relationship between X, M, and Y, where a change in an independent variable at some time is said to result in lagged changes in the mediator and outcome (Collins et al. 1998). The SEMs in Equations 1 and 2 still apply under the Collins et al. (1998) definition, but the variables are a function of specific, discrete times.
Prior work by Navarro-Barrientos et al. (2011) established how path diagrams in SEM correspond to steady-state process models; from these, fluid analogies can be constructed which lead to dynamical systems amenable to estimation via system identification methods. Drawing from techniques used in production inventory management in supply chains, fluid analogies describe dynamic behaviors according to a structural relationship defined by a behavioral model (Schwartz et al. 2006). The fluid analogy in Figure 2(b) depicts a physical system analogous to behavior change according to a mediational mechanism. Here, the independent variable corresponds to the exogenous input to the system, and the endogenous quantities in the path diagram (M and Y in Figure 2(a)) are represented as inventories. Dynamic, mediated behavior change models are obtained when each inventory is considered in the context of a general conservation principle:
| (3) |
A system of basic, first order differential equations results from the application of Equation 3 to Figure 2(b):
| (4) |
| (5) |
where the derivative terms describe the changing levels of the inventory, a, b, and c′ are the system gains, τ1 and τ2 are the inventory time constants, and θ1, θ2, and θ3 are the time delays. It can be shown that at steady-state, Equations 4 and 5 simplify to the structural models in Equations 1 and 2.
Higher order differential equations could be used to describe more complex dynamic behavior while still adhering to relationships depicted in Figure 2(b). While this simple fluid analogy reflects structural relationships defined by Equations 1 and 2, the resulting differential equations are relatively restrictive. Specifically, the outcome inventory dynamics are bound by a single time constant, despite the fact that the inventory accepts contributions from both the independent variable input and the mediator inventory outlet. This restriction is not necessary in a behavioral setting. Figure 3(a) is a less restrictive fluid analogy that describes mediated behavior change. In this analogy, each pathway from Figure 2(a) is represented by an inventory, each with its own characteristic dynamics. Figure 3(b) is the corresponding block diagram and highlights the fact that Y is the result of two processes, where YD accounts for the outcome change that is a direct result of the input variable change, and YI accounts for the outcome change that is an indirect result of the input variable change via the mediator variable change. Figure 3(b) also highlights the parallel-cascade nature of time-varying behaviors in a mediational relationship. Equations 6 and 7 are the corresponding Laplace-domain models:
| (6) |
| (7) |
Figure 3.
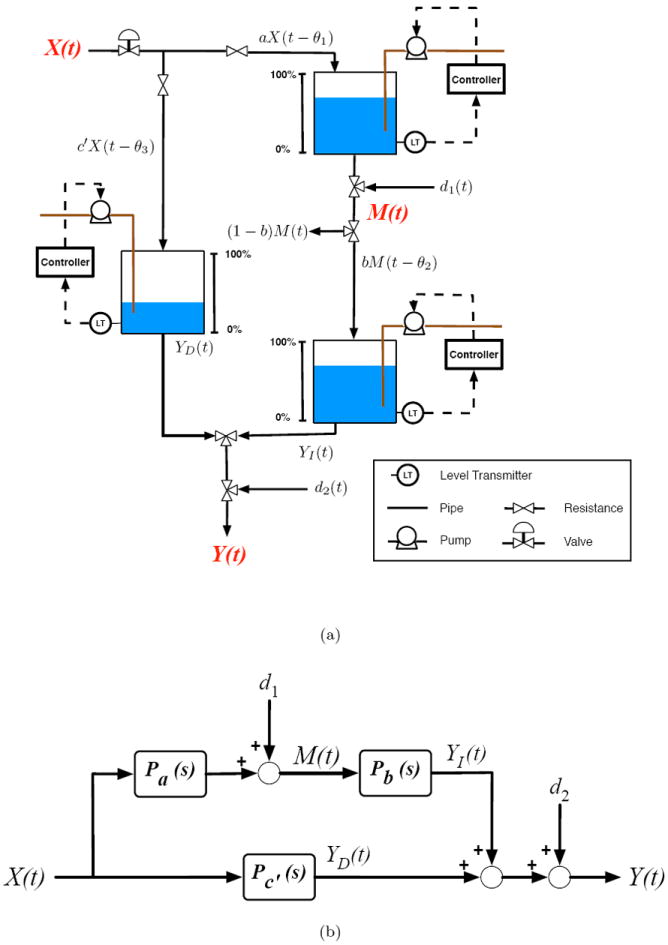
(a) Generalized fluid analogy for a mediated behavioral intervention developed from production inventory management models in supply chains. (b) Block diagram of statistical mediation.
In accordance with McCarthy et al. (2008b), this article primarily treats Craving and Cigsmked as the mediator and outcome, respectively. The independent variable input, Quit, is modeled as a unit step occurring on the quit date and corresponds to a transition from not attempting to quit smoking to attempting to quit. d1 and d2 in Equations 6 and 7 represent process disturbances, as opposed to measurement noise. In this framework, they represent un-modeled factors that influence the mediator and outcome. In this context, d1 represents factors other than the initiation of a quit attempt that contribute to, or mitigate, Craving, such as negative or positive life events (i.e., changes in Stress); d2 represents factors other than the initiation of a quit attempt or changing Craving levels that influence Cigsmked, such as the accessibility or inaccessibility of cigarettes. If these process disturbances are measured and uncorrelated with the inputs to Pa(s), Pb(s), and Pc′(s), they could be explicitly modeled (Ljung 1999). In behavioral health settings, explicitly modeling disturbances is challenging, as additional influences that are truly independent and exogenous are often not obvious. Consequently, accurate measurement and estimation of reliable models presents significant practical and related estimation issues. In the following, it is assumed that process disturbances are uncorrelated with the inputs and not of significant influence. The group averaging likely effectively filters out uncontrolled disturbances, suggesting these assumptions are reasonable. Ultimately, reliable identification and characterization of possible process disturbances would require novel identification experiments. With novel clinical trial data, measurements of hypothesized disturbances could be included in estimation of Equations 6 and 7 and validated (e.g., through cross-validation); future validation of a time-varying disturbance could significantly contribute to development of an improved—engineering-based or otherwise—smoking intervention, as it would ultimately offer tobacco treatment practitioners an additional degree-of-freedom on which to intervene.
In fitting the Laplace-domain models in Equations 6 and 7 to the Craving and Cigsmked signals, a prediction-error approach is used to estimate continuous-time linear models from sampled data (Ljung 2009). Model estimation initially employed the lowest order equation structure possible (a gain), as preliminary visual inspection of the data indicated low order dynamic phenomena; transfer function structures with gradually increased complexity were evaluated as necessary according to the following iterative estimation and validation procedure:
Estimation of Pa(s) as a single-input single-output (SISO) system with Quit as the input and Craving as the output according to a given low order transfer function structure.
Simultaneous estimation of Pb(s) and Pc′(s) as a multi-input single-output (MISO) system with Craving and Quit as the inputs and Cigsmked as the output according to given low order transfer function structures for Pb(s) and Pc′(s).
Simulation of the Craving and Cigsmked responses to Quit according to the estimated Pa(s), Pb(s) and Pc′(s) expressions.
- Evaluation of Craving and Cigsmked goodness-of-fit on a 0 to 100% scale, calculated according to the following criterion:
where y(t) is the data to which the model is fit, ỹ(t) is the simulated output, and ȳ is the average of all y values.(8)
This procedure was implemented in MATLAB through a custom graphical user interface (GUI) built for flexible model estimation. Using the GUI, the four steps were repeated for different combinations of Pa(s), Pb(s), and Pc′(s) transfer function structures with parameter estimation relying on the pem command from the System Identification Toolbox in MATLAB. To use this routine, the input and output data was defined as an iddata object and the structure of the model to be estimated was defined as an idproc model object. For specification of the idproc model structure, the process models notation was used in which a single-output continuous-time model transfer function structure is specified and can feature one to three poles, an integrator, a zero, and a time-delay (Ljung and Singh 2012). The idproc and process models functionality employs an indirect continuous-time estimation approach in which discrete-time estimation methods are first used before the resulting discrete-time representation is transformed into the equivalent continuous-time model. This two-step approach has the advantage of drawing from established discrete-time estimation methods to produce consistent and statistically efficient parameter estimates, and still results in continuous-time models that parsimoniously represent complex behaviors and can more easily be interpreted (Garnier et al. 2008). In the iterative four step procedure used here, a set of model estimates were ultimately identified as appropriate representations of the behavioral dynamics for each group average and the single subject examples according to goodness-of-fit values, a concern for model parsimony, evaluation of parameter realizability, and through simulation.
Table 2 contains the parameter estimates, settling times (in days), and goodness-of-fit values for the mediation models; ILD and model outputs are shown in Figures 4 and 5. The iterative estimation procedure’s employment of low order structures where complexity was increased only as necessary, the associated high goodness-of-fit values, and the corresponding simulations, which appear to accurately model the dynamic features observed in the ILD, suggest the following transfer function structures adequately represent cessation as a Craving-mediated process:
| (9) |
| (10) |
| (11) |
Table 2.
Mediation model parameter estimates and goodness-of-fit values.
| Treatment Data Set | AC Avg | ANc Avg | PC Avg | PNc Avg | AC Sgl | PNc Sgl |
|---|---|---|---|---|---|---|
| Mediator Fit [%] | 87.77 | 78.88 | 77.80 | 64.72 | 69.44 | 44.80 |
| Outcome Fit [%] | 89.17 | 83.06 | 91.49 | 84.38 | 77.09 | 58.98 |
| ab | 0.94 | 1.96 | 1.45 | 1.17 | -0.24 | 19.34 |
| ab + c′ | -14.07 | -11.17 | -12.05 | -9.07 | -13.29 | 3.55 |
| Mediator Settling Time [Days] | 35.69 | 35.91 | 35.82 | 35.90 | 26.34 | 33.87 |
| Outcome Settling Time [Days] | 34.56 | 35.26 | 35.60 | 35.29 | 10.64 | 33.86 |
| a | -11.10 | -8.38 | -7.12 | -3.90 | -20.38 | 3.10 |
| τa | -2.28 | -4.60 | -14.18 | -24.21 | -4.23 | 100.00 |
| τ1 | 7.74 | 10.99 | 18.34 | 17.13 | 6.01 | 16.47 |
| b | -0.08 | -0.23 | -0.20 | -0.30 | 0.01 | 6.25 |
| τ3 | 4.59 | 2.89 | 0.42 | 1.89 | 1.29 | 95.53 |
| c′ | -15.10 | -13.13 | -13.50 | -10.42 | -13.05 | -15.99 |
Figure 4.
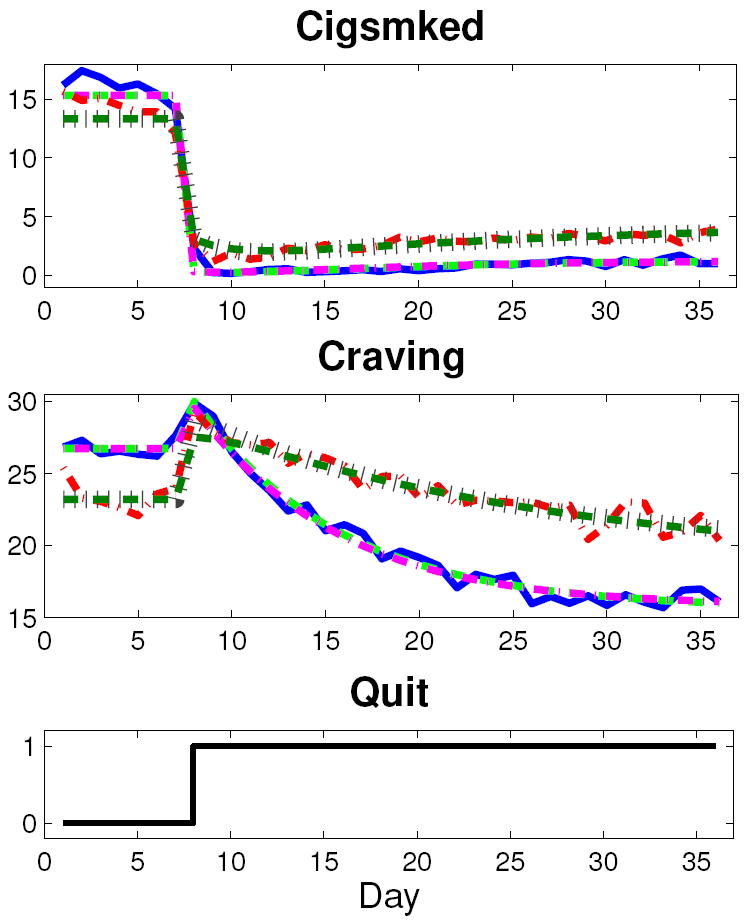
Craving and Cigsmked data and models for AC and PNc group averages (solid blue, AC data; dashed light green, AC mediation model; dash-dot magenta, AC self-regulation model; dash-dot red, PNc data; dotted brown, PNc mediation model; dashed dark green, PNc self-regulation model).
Figure 5.
Craving and Cigsmked data and models for AC and PNc single subject examples (solid blue, AC data; dashed light green, AC mediation model; dash-dot magenta, AC self-regulation model; dash-dot red, PNc data; dotted brown, PNc mediation model; dashed dark green, PNc self-regulation model).
The estimated models feature high fit percentages according to Equation 8 for the group averages. The low order of the structures indicate that over-parameterization is not taking place. In general, the high signal-to-noise ratios of the group average data sets are conducive to model estimation with high goodness-of-fit values, regardless of the transfer function structure. The lower mediator fit value for the PNc group supports this assertion, as this group’s Craving appears to have a lower signal-to-noise ratio than its counterparts.
The net decrease in Craving is greatest in the AC group, smallest in the PNc group, and follows a logical relationship to treatment condition (a is -11.10 for AC, -8.38 for ANc, -7.12 for PC, and -3.90 for PNc). As indicated by the negative system zeroes, the group average craving signals feature pronounced inverse response. It is known that a zero term in a dynamical systems model can result from two lower-order subprocesses in parallel. Because inverse response in Craving results from a unit step (Quit), it can be deduced that Pa(s) reflects parallel subprocesses in competition with each other. The first subprocess has a positive gain and faster speed of response than the second, negative-gained subprocess. The positive-gained subprocess corresponds to the immediate, quit-induced increase in Craving while the negative-gained subprocess corresponds to the post-quit settling of Craving to below baseline levels. For the case that Pa(s) is described by the differential equation structure in Equation 9, Pa(s) = Pa1(s) + Pa2(s); Pa1(s) = Ka1 and Pa2(s) = Ka2/(τ1s + 1), where the time constant is equal to that for the overall Pa(s) function. It follows that Ka1 = −aτa/τ1 and Ka2 = a − Ka1, where a is the Pa(s) gain, τa is the Pa(s) zero, and τ1 is the Pa(s) time constant. This notion of competing parallel processes within the overall smoking cessation process agrees with the observation that quitting smoking involves delayed and immediate gratification motives (executive and impulsive neurological processes, respectively) that compete during a quit attempt (Bickel et al. 2007). Such insight into the nature of these underlying subprocesses highlights the utility of a continuous-time system identification approach, as the implications of the Pa(s) transfer function’s first order with zero structure were easily identified.
For the group average Cigsmked models, there is a dramatic quit-date drop in smoking followed by a relatively small and slow resumption. This dramatic quit-date smoking reduction is modeled by Pc′(s). Considering the treatment group averages, the magnitude of the initial drop is largest for the AC group, a 15.01 cigarette per day decrease, and smallest for the PNc group, a 10.42 cigarette per day decrease. For each model corresponding to the parameter estimates in Table 2, the direct contribution of the quit attempt to Cigsmked is immediate, and the YD signal in Figure 3 acts as a step of magnitude c′. The resumption of smoking is modeled by the mediated pathway, specifically Pb(s). For the group averages, the speed of resumption is small, as the Pb(s) time constant, τ3, is under five days for the groups. The speed of resumption of smoking does not strictly adhere to an expected relationship with respect to treatment condition: the AC group features the largest τ3 and the PC group has the smallest. The magnitude of resumption during a quit attempt is quantified with ab, and is relatively small for the groups. Comparing ab and ab + c′ values, the mediated pathway and net outcome gains, respectively, it is apparent that the mediated pathway’s contribution to the net effect of the quit attempt is consistently small for all of the group averages. Interestingly, the mediated pathways’ relative contribution to the outcome does not follow a natural progression in terms of relationship to treatment; the mediated pathway’s contribution to the outcome is 6.3% for the AC group, 14.9% for ANc, 10.7% for PC, and 13.0% for PNc.
As seen in Figure 5, the AC single subject example appears to successfully quit smoking. The estimated mediation model for this subject is consistent with this observation. Specifically, the magnitude of resumption is near zero (ab equal to -0.24), and the speed at which quit success is achieved is significantly faster than that of the group average counterparts, as the outcome settling time is 10.64 days. Conversely, the PNc single subject example appears to fully relapse (comparatively large b estimate) and does not feature inverse response (positive values for both the a and τa values).
The estimated single subject models are generally less accurate, particularly the PNc subject models. This can be attributed to greater variance in the single subject data. The greater degree of variance is evident in Figure 1: both subjects’ baseline signals are very noisy, feature Craving signals with lower signal-to-noise ratios, and the PNc subject’s resumption also shows greater variance. These data quality issues are typical when considering single subject data and consequently pose a significant challenge to optimization of smoking interventions given that patient-specific models would ideally act as the basis for development of personalized smoking cessation treatments. As parameters in continuous-time models are not a function of the sampling time, a continuous-time system identification approach is appealing in terms of managing data quality issues such as missing data and non-constant measurement intervals—both common characteristics of self-reported behavioral data (McCarthy et al. 2008a, Timms et al. 2012). Discussed in more detail in Section 5, future estimation of reliable single subject smoking cessation models may benefit from data collected in clinical trials designed with system identification in mind (Ljung 1999, Deshpande et al. 2012, Rivera 2012).
Using an iterative estimation procedure similar to that previously described, models for the “reverse” mediation scenario were also estimated, where Cigsmked was the mediator and Craving the outcome (models not shown). This similarly resulted in models with high goodness-of-fit values and corresponding simulations that appeared to accurately represent the Craving and Cigsmked dynamics. This suggests that a Craving-Cigsmked interrelationship captured in the clinical trial ILD is not fully described by a single mediation model. This significantly motivated identification of an alternative description of the smoking cessation process that accounts for this interrelationship in a parsimonious manner.
4 Self-Regulation Model
One of the greatest opportunities afforded by ILD is the ability to study self-regulating and self-exciting phenomena (negative and positive feedback, respectively) within behavior change processes (Collins 2006). Regulatory behaviors have historically been of significant interest in terms of characterizing addiction generally and smoking behaviors specifically (Carver and Scheier 1998, Solomon 1977, Solomon and Corbit 1974, Velicer et al. 1992). The Nicotine Regulation Model, for example, proposes that smoking is done in an attempt to maintain a smoker’s blood nicotine set point, where deviations from this set point are the result of environmental conditions (e.g., cigarettes not readily available; Velicer et al. 1992). More complicated but conceptually similar mechanisms propose that cigarettes are smoked in order to regulate emotional states or an Urge set point (Velicer et al. 1992, Solomon 1977, Solomon and Corbit 1974, Walls and Rivera 2009, Timms et al. 2013, in press); these emotional states may be directly affected by environmental factors unrelated to the act of smoking (Velicer et al. 1992). However, the ability of such theories to inform effective treatment strategies, such as time-varying adaptive interventions, has been limited. This is largely due to the historically significant challenges associated with effective measurement and mathematical modeling of behavioral dynamics (Riley et al. 2011).
Figure 6 depicts a block diagram of the smoking cessation process that features self-regulation. Generally, Figure 6 suggests that cigarette smoking is done in order to maintain a Craving set point and an attempt to quit smoking is a disturbance on this self-regulatory relationship. Essentially, this block diagram reflects an intuitive process: over time, an increasing desire to smoke leads to smoking activity, which then reduces that desire in the short-term. Specifically, Figure 6 describes a feedback loop in which a biochemical or psychological controller, C(s), responds to the deviation, e, between a craving set point, rcrav, and the actual measured craving signal (e = rcrav − Craving). Cigsmked is a sum of the outputs from C(s), the craving self-regulator, and Pd(s), the effect of the quit attempt; Cigsmked then acts as an input to P(s), producing Craving. The associated closed-loop transfer function structures are:
| (12) |
| (13) |
Figure 6.
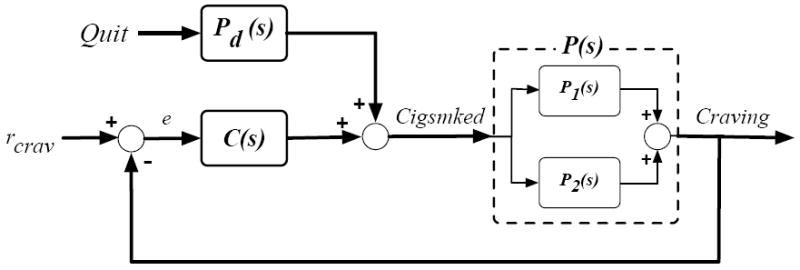
Block diagram depicting a smoking cessation self-regulation model relating Craving and Cigsmked.
As the output of P(s) is Craving, this function will require a system zero, which stems from the sum of two subprocesses in parallel. Figure 6 depicts these underlying, competing processes. Mapping the self-regulatory relationship in Figure 6 to a generalized description of self-regulating behaviors described in Carver and Scheier (1998), P(s) and C(s) correspond to “Effect on Environment” and “Behavior” processes, respectively.
As in the case of the mediation models, estimating the self-regulation models employed a prediction-error approach to obtain continuous-time linear models from sampled data (Ljung 2009). The system identification procedure is similar to that previously described:
Estimation of P(s) as a single-input single-output (SISO) system with Cigsmked as the input and Craving as the output according to a given low order transfer function structure.
Simultaneous estimation of C(s) and Pd(s) as a multi-input single-output (MISO) system with e = rcrav − Craving and Quit as the inputs and Cigsmked as the output according to given low order transfer function structures for C(s) and Pd(s).
Simulation of the Craving and Cigsmked responses to Quit according to the estimated P(s), C(s) and Pd(s) expressions.
Calculation of Craving and Cigsmked goodness-of-fit according to the criterion in Equation 8.
This procedure was implemented in MATLAB through the previously described custom GUI that relied on the pem routine, an idproc model object, and the process models notation for estimation (Ljung and Singh 2012). The four steps were repeated for different combinations of transfer function structures, beginning with the lowest order (gain-only) equation structure, with structural complexity increased as necessary. Similarly, various craving set points were examined: baseline Craving level, a linearly decreasing Craving function, and absolute Craving equal to zero. In assessing the group average and single subject candidate model estimates for goodness-of-fit, model parsimony, parameter realizability, and through simulation, the appropriate rcrav value was found to equal the baseline Craving level, and the following transfer function structures were found to appropriately represent the observed cessation dynamics:
| (14) |
| (15) |
| (16) |
The parameter estimates and goodness-of-fit percentages are tabulated for the treatment group averages and the single subjects in Table 3. The corresponding model outputs are depicted in Figures 4 and 5.
Table 3.
Self-regulation model parameter estimates and goodness-of-fit values.
| Treatment Data Set | AC Avg | ANc Avg | PC Avg | PNc Avg | AC Sgl | PNc Sgl |
|---|---|---|---|---|---|---|
| Craving Fit [%] | 87.33 | 77.65 | 77.51 | 62.25 | 66.90 | 57.59 |
| Cigsmked Fit [%] | 89.16 | 83.03 | 91.44 | 84.12 | 77.09 | 62.99 |
| P(s) K1 | 0.77 | 0.74 | 0.50 | 0.52 | 1.57 | -2.21 |
| P(s) τa | -1.99 | -3.76 | -14.34 | -21.90 | -3.05 | 3.45 |
| P(s) τ1 | 8.22 | 14.23 | 18.70 | 26.75 | 6.88 | 10.76 |
| C(s) Kc | 0.08 | 0.23 | 0.20 | 0.30 | -0.01 | -6.25 |
| C(s) τc | 4.59 | 2.89 | 0.42 | 1.89 | 1.29 | 95.53 |
| Pd(s) Kd | -15.01 | -13.13 | -13.50 | -10.24 | -13.05 | -15.99 |
As evident in Table 3 and Figures 4 and 5, high goodness-of-fit values and high fidelity simulations are obtained with low order transfer function structures. As before, the negative system zero, τa, indicates P(s) represents the sum of two competing subprocesses in parallel. Whereas the group average mediation models suggest the subprocess with the faster speed of response is positive-gained, it is now the negative-gained subprocess that has an immediate speed of response (P1(s) = Kp1, where Kp1 < 0); conversely, it is the positive-gained function that has the slower speed of response (P2(s) = Kp2/(τp2 s + 1), where Kp2 > 0 and τp2 equals τ1 from Equation 14 and Table 3). The negative value of Kp1 corresponds to the initial increase in Craving that results from the quit-induced, step-like initial decrease in Cigsmked. The positive value of Kp2 corresponds to the settling of Craving to below baseline levels that results from the dramatic reduction in the group average Cigsmked signals. As the group average estimates in Table 3 for K1 are positive, it follows that the magnitude of Kp2 is greater than that of Kp1. As previously described, the sum of two subprocesses agrees with the concept of dual impulsive and executive neurological processes that compete during a quit attempt (Bickel et al. 2007). Altogether, the craving reduction per unit decrease in daily cigarettes smoked is larger for the active drug groups versus the placebo groups: K1 equal to 0.77 for the AC group, 0.74 for ANc, 0.50 for PC, and 0.52 for PNc.
The Pd(s) model corresponds to the initial quit-day reduction in Cigsmked, and the magnitude of this drop is largest for the AC group (Kd = -15.01) and smallest for the PNc group (Kd = -10.24). As the C(s) function models the post-quit smoking resumption for all of the estimated expressions, it follows that the feedback pathway is responsible for relapse. A distinct advantage of the continuous-time modeling approach is that the nature of the craving self-regulator can be reverse-engineered, as interpretation of the estimated continuous-time C(s) function is straightforward. Evident in Equation 16, C(s) is described by a first order differential equation for both the group average and single subject models. Consequently, the craving self-regulator can be classified as a proportional-with-filter controller. This is significant, as such a controller allows offset, and therefore C(s) does not necessarily track the set point (pre-quit baseline Craving levels), effectively allowing the model to capture possible quit attempt success as well as failure. The filter component, 1/(τcs + 1), serves to attenuate the influence of frequent changes in e on resumption, and suggests that the influence of unmeasured disturbances that lead to the apparent noise in e is suppressed on average. This may support the notion in behavioral science that Craving dynamics induced by abstaining from smoking is the dominant factor in determining relapse versus cessation success (McCarthy et al. 2008b, Piper et al. 2008). In general, the connection between a fundamental control paradigm (PID control) and a mechanism of change central to behavioral science (self-regulating smoking behavior) makes a case for the potential utility of system identification techniques to behavioral health settings in the future (Ogunnaike and Ray 1994, Carver and Scheier 1998, Solomon and Corbit 1974, Solomon 1977, Velicer et al. 1992, Timms et al. in press). Comparing Kc and τc estimates in Table 3 for the group average models, the craving self-regulator appears to provide a relatively small and slow contribution to the net change in Cigsmked. Interestingly, the overall influence of the feedback pathway on cessation dynamics may be diminished by the combined active drug and counseling treatment, as Kc is approximately 63% smaller for the AC group compared to the ANc and PC groups, and is approximately 73% smaller compared to the PNc group.
The single subject self-regulation models generally have lower goodness-of fit values as compared to the group average models. This was expected, as the ILD from which both mediation and self-regulation models were estimated feature significant variance. (Experimental design options that can mitigate the data quality issue typical of single subject behavioral data is discussed in Section 5.) Interestingly, the PNc single subject’s Craving and Cigsmked goodness-of-fit values are approximately 10% greater for the self-regulation model compared to the mediation model. This supports the case for self-regulation as a better description of the smoking process.
Focusing on the single subject model estimates specifically, the successful quit attempt for the AC single subject is appropriately represented by the self-regulation model. Although the PNc subject’s P(s), Pd(s), and C(s) dynamics are adequately described by the same low order differential equation structures as the group average models, the characteristics of the corresponding parameter estimates contrast those of the group averages. This is due to the subject’s failed quit attempt, which is characterized by a full resumption in Cigsmked and a lack of inverse response in Craving. Whereas the group average model estimates feature Kc estimates that are positive and small in magnitude, the PNc subject’s Kc equals -6.25. This large, negative value reflects the significant resumption evident in the subject’s Cigsmked signal, which is the response to e, the input to C(s) that is essentially the inverted Craving signal (e = rcrav − Craving, where rcrav is the baseline Craving level). The PNc subject’s K1 estimate is also negative, contrasting the other models’ K1 values; this estimated P(s) model reflects the subject’s increase in Craving that results from the initial drop in smoking and the subsequent settling to approximately pre-quit levels that results from the apparent relapse. In terms of the underlying subprocesses, where P(s) = P1(s) + P2(s) with P1(s) = Kp1 (Kp1 < 0) and P2(s) = Kp2/(τp2 s + 1) (Kp2 also negative and τp2 = τ1 = 10.76 days, per Table 3). The relative signs of these subprocess gains are a departure from the relationship inferred for the other models examined.
The feedback nature of the self-regulation model suggests that Craving and Cigsmked are fundamentally related and a change in one variable results in a change in the other. In other words, the self-regulation models describe a Craving-Cigsmked interrelationship that cannot be accounted for by classic mediation. This is significant as a Craving-Cigsmked interrelationship was originally suggested by the fact that both the mediation models presented and the reverse mediation models (not shown) have high goodness-of-fit values and high fidelity simulations. Altogether, smoking cessation behavior change is more appropriately and parsimoniously represented as a self-regulatory process as opposed to a mediational relationship. Furthermore, very poor models result from estimation of reverse self-regulation models, where P(s) is said to accept Craving as the input, producing Cigsmked as the output, etc. This supports the case that Figure 6 is a more appropriate representation of the Craving and Cigsmked relationship (i.e., Craving is the variable being regulated).
5 Conclusions and Recommendations
Drawing from intensive longitudinal data collected from a clinical trial of bupropion and counseling as aids to smoking cessation, system identification models were developed to describe smoking cessation as mediational and self-regulatory processes. Ultimately, these models differ in how they each describe the resumption of smoking: for mediation, resumption is the result of daily changes in Craving (via Pb(s)); for self-regulation, resumption is the result of a craving self-regulator. Analysis of both sets of models highlight the utility of continuous-time system identification in behavioral health settings. Specifically, continuous-time system identification facilitates estimation of parsimonious expressions that accurately represent complex dynamic features within the smoking cessation process. Furthermore, these continuous-time expressions are conducive to straightforward identification and interpretation of the dynamics—in this article, shedding light on the nature of the two competing subprocesses that together form Craving, and that the craving self-regulator is a proportional-with-filter controller on average. Altogether, the models developed suggest that self-regulation more appropriately describes the process of smoking cessation. Regardless of structure, parameter values estimated from the group average data, which are signals with high signal-to-noise ratios, suggest both bupropion and counseling have some effect on craving and reduction of smoking behavior.
This article has effectively shown that system identification is useful in analysis of smoking cessation interventions and for comprehensively describing the process of smoking cessation. The dynamical modeling strategy used here could be further applied to the clinical trial data examined here in order to study alternate signal relationships and behavioral mechanisms. Notably, participants in the UW-CTRI clinical trial completed up to seven self-reports at pseudo-random intervals throughout the day (McCarthy et al. 2008a). These reports assessed environmental factors as well as behavioral states as experienced by the participant at the time the report was completed (whereas the ER focused on a participant’s average behavioral state over the previous 24 hours). Behavioral data collected in this fashion is said to reflect the influence of an individual’s natural environment, and may measure such influences. Continuous-time models estimated using data from these reports could provide some insight into environmental sources of inter-individual variability, and consequently may act as the basis for more reliable idiographic model estimation. However, the generalizability of such models would still be limited due to the secondary nature of the analysis. In the future, more informative single subject data sets—and ultimately more reliable patient-specific smoking cessation models—could be obtained through a novel smoking cessation clinical trial that draws from experimental design techniques in system identification. Such a trial may vary intervention dosage over time (e.g., bupropion dose, counseling frequency), use self-reports more conducive to measurement of nuanced behavioral dynamics (e.g., Craving assessed on a 0 to 100 point scale), or feature a longer self-reporting protocol. However, the medical, practical, and ethical concerns associated with human subjects would also have to be addressed simultaneously. A smoking cessation clinical trial designed to produce more informative single subject data sets would involve experimental design strategies similar to those described in Deshpande et al. (2012) and Deshpande and Rivera (2013). Specifically, Deshpande et al. (2012) and Deshpande and Rivera (2013) propose optimization-based approaches for the design of periodic, deterministic input signals that facilitate cross-validation, constraint handling, and altogether “patient-friendly” operation.
Ultimately, self-regulatory models similar to those estimated here could inform novel treatment strategies (Timms et al. 2013, Rivera 2012, Nandola and Rivera 2013, Riley et al. 2011). Although accurate models of patient-specific behavioral dynamics would ideally be used to personalize interventions, a more practical intervention design approach may rely on a self-regulatory model described in the block diagram in Figure 6, but is parameterized to reflect a representative failed quit attempt—full resumption in Cigsmked, inverse-free Craving, and no net change in Cigsmked or Craving. A representative model of a failed quit attempt could be similar to the PNc single subject model examined here. Timms et al. (2013) presents such an example of a representative model of quit attempt failure. For designing an adaptive smoking cessation intervention, such a representative model could be used in conjunction with controller-design principles to develop an algorithm that defines intervention adjustment (e.g., medication dosage increases), based on a patient’s baseline conditions, self-reported smoking and withdrawal symptoms (e.g., daily Craving and Cigsmked reports), and environmental or other disturbances (e.g., Stress). A Hybrid Model Predictive Control approach is appealing as it can simultaneously manage manipulated variables that are on discrete scales (e.g., discrete medication dosage) and constraints (e.g., medication toxicity levels) in an optimal manner (Nandola and Rivera 2013, Rivera 2012, Timms et al. 2013). Figure 7 depicts the general form of this control scheme. An optimized, adaptive smoking intervention designed in an HMPC framework could also include features of other well-known control approaches. For example, variables that are effectively non-time-varying but may be relevant to the cessation process, such as the presence of a genetic variant in a patient’s nicotine metabolism genes (Chen et al. 2012), could act as scheduling variables in an intervention featuring gain-scheduled Model Predictive Control (Chisci et al. 2003). Finally, event-based control offers controller capabilities that may be appropriate for intervention design. Specifically, event-based control concepts offer a way to mitigate relapse that may otherwise result from time-varying cues to smoke (e.g., proximity to smokers) or other disturbances (Pawlowski et al. 2012), and would be particularly appealing for interventions that draw from models of cessation dynamics on shorter time scales (e.g., within-day dynamic models).
Figure 7.
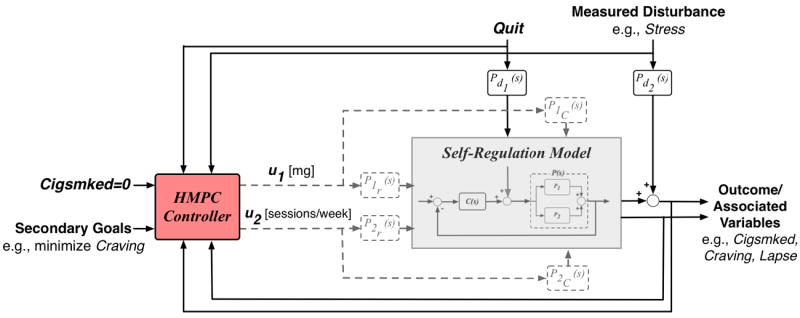
Block diagram of a Hybrid Model Predictive Control approach to design of an optimal, adaptive smoking cessation intervention.
Acknowledgments
This work was supported by an award from the American Heart Association, a National Research Service Award from the National Institute on Drug Abuse at the National Institutes of Health (F31 DA035035), and the Office of Behavioral and Social Sciences Research and the National Institute on Drug Abuse at the National Institutes of Health (K25 DA021173, R21 DA024266, P50 DA10075). The content is solely the responsibility of the authors and does not necessarily represent the views of the NIH.
References
- American Cancer Society. Guide to Quitting Smoking. 2012 [PubMed] [Google Scholar]
- Baker T, Mermelstein R, Collins L, Piper M, Jorenby D, Smith S, Christiansen B, Schlam T, Cook J, Fiore M. New Methods for Tobacco Dependence Treatment Research. Annals of Behavioral Medicine. 2011;41:197–207. doi: 10.1007/s12160-010-9252-y. [DOI] [PMC free article] [PubMed] [Google Scholar]
- Bickel W, Miller M, Yi R, Kowal B, Lindquist D, Pitcock J. Behavioral and neuroeconomics of drug addiction: Competing neural systems and temporal discounting processes. Drug and Alcohol Dependence. 2007;90:S85–S91. doi: 10.1016/j.drugalcdep.2006.09.016. [DOI] [PMC free article] [PubMed] [Google Scholar]
- Bollen K. Wiley Series in Probability and Mathematical Statistics. New York: John Wiley and Sons; 1989. Structural Equations with Latent Variables. [Google Scholar]
- Carver C, Scheier M. On the Self-Regulation of Behavior. New York City, New York: Combridge University Press; 1998. [Google Scholar]
- Centers for Disease Control and Prevention. Vital signs: current cigarette smoking among adults aged ≥ 18 years – United States, 2009. MMWR. 2010;59:1135–1140. [PubMed] [Google Scholar]
- Centers for Disease Control and Prevention. The Great American Smokeout. 2011 [Google Scholar]
- Centers for Disease Control and Prevention. Trends in Current Cigarette Smoking Among High School Students and Adults, United States, 1965–2011. 2012 [Google Scholar]
- Chen L, Baker T, Grucza R, Wang J, Johnson E, Breslau N, Hatsukami D, Smith S, Saccone N, Saccone S, Rice J, Goate A, Bierut L. Dissection of the phenotypic and genotypic associations with nicotinic dependence. Nicotine and Tobacco Research. 2012;14:425–433. doi: 10.1093/ntr/ntr231. [DOI] [PMC free article] [PubMed] [Google Scholar]
- Chisci L, Falugi P, Zappa G. Gain-scheduling MPC of nonlinear systems. International Journal of Robust and Nonlinear Control. 2003;13:295–308. [Google Scholar]
- Collins L. Analysis of Longitudinal Data: The Integration of Theoretical Model, Temporal Design, and Statistical Model. Annual Review of Pscychology. 2006;57:505–528. doi: 10.1146/annurev.psych.57.102904.190146. [DOI] [PubMed] [Google Scholar]
- Collins L. Unpacking the black box: engineering more potent interventions to improve public health. Evan G and Helen G Pattishall Outstanding Research Achievement Award lecture presented at Penn State University. 2012 [Google Scholar]
- Collins L, Graham J, Flaherty B. An Alternative Framework for Defining Mediation. Multivariate Behavioral Research. 1998;33:295–312. doi: 10.1207/s15327906mbr3302_5. [DOI] [PubMed] [Google Scholar]
- Collins L, Murphy S, Bierman K. A conceptual framework for adaptive preventive interventions. Prevention Science. 2004;5:185–196. doi: 10.1023/b:prev.0000037641.26017.00. [DOI] [PMC free article] [PubMed] [Google Scholar]
- Deshpande S, Nandola N, Rivera D, Younger J. Control Engineering Approach for Designing an Optimized Treatment Plan for Fibromyalgia. Proceedings of the 2011 American Control Conference; San Francisco, CA. 2011. pp. 4798–4803. [DOI] [PMC free article] [PubMed] [Google Scholar]
- Deshpande S, Rivera D. Optimal input signal design for data-centric estimation methods. Proceedings of the 2013 American Control Conference; Washington, DC. 2013. pp. 3930–3935. [DOI] [PMC free article] [PubMed] [Google Scholar]
- Deshpande S, Rivera D, Younger J. Towards Patient-Friendly Input Signal Design for Optimized Pain Treatment Interventions. Proceedings of the 16th IFAC Symposium on System Identification; Brussels, Belgium. 2012. pp. 1311–1316. [Google Scholar]
- Dong Y, Rivera D, Downs D, Savage J, Thomas D, Collins L. Hybrid Model Predictive Control for optimizing gestational weight gain behavioral interventions. Proceedings of the 2013 American Control Conference; Washington, DC. 2013. pp. 1970–1975. [DOI] [PMC free article] [PubMed] [Google Scholar]
- Erhardt L. Cigarette Smoking: An Undertreated Risk Factor for Cardiovascular Disease. Atherosclerosis. 2009;205:23–32. doi: 10.1016/j.atherosclerosis.2009.01.007. [DOI] [PubMed] [Google Scholar]
- Fiore M, Jaen C, Baker T, Bailey W, Benowitz N, C S, et al. Clinical practice guideline. U.S. Department of Health and Human Services; Rockville, MD: 2008. Treating Tobacco Use and Dependence: 2008 Update. [Google Scholar]
- Fish J, Bartholomew J. Cigarette Smoking and Cardiovascular Disease. Current Cardiovascular Risk Reports. 2007;1:384–390. [Google Scholar]
- Garnier H, Wang L, Young P. Advances in Industrial Control. Identification of Continuous-Time Models From Sampled Data. London, England: Springer-Verlag London Limited; 2008. Direct Identification of Continuous-time Models from Sampled Data: Issues, Basic Solutions and Relevance; pp. 1–29. [Google Scholar]
- Horst W, Preskorn S. Mechanisms of action and clinical characteristics of three atypical antidepressants: venlafaxine and nefazodone and bupropion. Journal of Affective Disorders. 1998;51:237–254. doi: 10.1016/s0165-0327(98)00222-5. [DOI] [PubMed] [Google Scholar]
- Irvin J, Brandon T. The Increasing Recalcitrance of Smokers in Clinical Trials. Nicotine and Tobacco Research. 2000;2:79–84. doi: 10.1080/14622200050011330. [DOI] [PubMed] [Google Scholar]
- Irvin J, Hendricks P, Brandon T. The Increasing Recalcitrance of Smokers in Clinical Trials II: Pharmacotherapy Trials. Nicotine and Tobacco Research. 2003;5:27–35. doi: 10.1080/1462220031000070534. [DOI] [PubMed] [Google Scholar]
- Killeen P. Markov model of smoking cessation. PNAS. 2011;108(Supplement 3):15549–15556. doi: 10.1073/pnas.1011277108. [DOI] [PMC free article] [PubMed] [Google Scholar]
- Ljung L. System Identification: Theory for the User. 2. Englewood Cliffs, NJ: Prentice-Hall, Inc; 1999. [Google Scholar]
- Ljung L. Technical report. Automatic Control at Linkopings Universitet; SE-581 83 Linkoping, Sweden: 2009. Experiments with identification of continuous time models. [Google Scholar]
- Ljung L, Singh R. Version 8 of the System Identification Toolbox. Proceedings of the 16th IFAC Symposium on System Identification; Brussels, Belgium. 2012. pp. 1826–1831. [Google Scholar]
- MacKinnon D. Introduction to Statistical Mediation Analysis. Routledge Academic; 2008. [Google Scholar]
- McCarthy D, Piasecki T, Lawrence D, Jorenby D, Shiffman S, Baker T. Psychological mediators of bupropion sustained-release treatment for smoking cessation. Addiction. 2008b;103:1521–1533. doi: 10.1111/j.1360-0443.2008.02275.x. [DOI] [PMC free article] [PubMed] [Google Scholar]
- McCarthy D, Piasecki T, Lawrence D, Jorenby D, Shiffman S, Fiore M, Baker T. A randomized controlled clinical trial of bupropion SR and individual smoking cessation counseling. Nicotine and Tobacco Research. 2008a;10:717–729. doi: 10.1080/14622200801968343. [DOI] [PubMed] [Google Scholar]
- Nandola N, Rivera D. An Improved formulation of Hybrid Model Predictive Control with application to production-inventory systems. IEEE Transactions on Control Systems Technology. 2013;21:121–135. doi: 10.1109/TCST.2011.2177525. [DOI] [PMC free article] [PubMed] [Google Scholar]
- Navarro-Barrientos J, Rivera D, Collins L. A dynamical model for describing behavioural interventions for weight loss and body composition change. Mathematical and Computer Modelling of Dynamical Systems. 2011;17:183–203. doi: 10.1080/13873954.2010.520409. [DOI] [PMC free article] [PubMed] [Google Scholar]
- Ogunnaike B, Ray W. Process dynamics, Modeling, and Control. New York City, NY: Oxford University Press; 1994. [Google Scholar]
- Pawlowski A, Guzman J, Normey-Rico J, Berenguel M. A practical approach for Generalized Predictive Control within an event-based framework. Computers and Chemical Engineering. 2012;41:52–66. [Google Scholar]
- Piper M, Federman E, McCarthy D, Bolt D, Smith S, Fiore M, Baker T. Using mediational models to explore the nature of tobacco motivation and tobacco treatment effects. Journal of Abnormal Psychology. 2008;117:94–105. doi: 10.1037/0021-843X.117.1.94. [DOI] [PubMed] [Google Scholar]
- Riley W, Rivera D, Atienza A, Nilsen W, Allison S, Mermelstein R. Health behavior models in the age of mobile interventions: are our theories up to the task? Translational Behavioral Medicine. 2011;1:53–71. doi: 10.1007/s13142-011-0021-7. [DOI] [PMC free article] [PubMed] [Google Scholar]
- Rivera D. Optimized Behavioral Interventions: What Does System Identification and Control Systems Engineering Have to Offer?. Proceedings of the 16th IFAC Symposium on System Identification; Brussels, Belgium. 2012. pp. 882–893. [Google Scholar]
- Rivera D, Pew M, Collins L. Using engineering control principles to inform the design of adaptive interventions: A conceptual introduction. Drug and Alcohol Dependence. 2007;88:S31–S40. doi: 10.1016/j.drugalcdep.2006.10.020. [DOI] [PMC free article] [PubMed] [Google Scholar]
- Schwartz J, Wang W, Rivera D. Simulation-based optimization of process control policies for inventory management in supply chains. Automatica. 2006;42:1311–1320. [Google Scholar]
- Solomon R. Psychopathology: Experimental Models. San Francisco, CA: W.H. Freeman; 1977. An Opponent-Process Theory of Acquired Motivation: The Affective Dynamics of Addiction; pp. 66–103. [Google Scholar]
- Solomon R, Corbit J. An Opponent-Process Theory of Motivation: I. Temporal Dynamics of Affect. Psychological Review. 1974;81:119–145. doi: 10.1037/h0036128. [DOI] [PubMed] [Google Scholar]
- Timms K, Rivera D, Collins L, Piper M. Control Systems Engineering for Understanding and Optimizing Smoking Cessation Interventions. Proceedings of the 2013 American Control Conference; Washington, DC. 2013. pp. 1967–1972. [DOI] [PMC free article] [PubMed] [Google Scholar]
- Timms K, Rivera D, Collins L, Piper M. A dynamical systems approach to understand self-regulation in smoking cessation behavior change. Nicotine and Tobacco Research. doi: 10.1093/ntr/ntt149. in press. [DOI] [PMC free article] [PubMed] [Google Scholar]
- Timms K, Rivera D, Collins L, Piper ME. System Identification Modeling of a Smoking Cessation Intervention. Proceedings of the 16th IFAC Symposium on System Identification; Brussels, Belgium. 2012. pp. 786–791. [Google Scholar]
- Velicer W, Redding C, Richmond R, Greeley J, Swift W. A Time Series Investigation of Three Nicotine Regulation Models. Addictive Behaviors. 1992;17:325–345. doi: 10.1016/0306-4603(92)90039-x. [DOI] [PubMed] [Google Scholar]
- Walls T, Rivera D. Control Engineering-Based Approaches to Modeling Substance Abuse Data. Washington, D.C.. 17th Annual Meeting of the Society for Prevention Research.2009. May, [Google Scholar]
- Walls T, Schafer J, editors. Models for Intensive Longitudinal Data. Cary, NC, USA: Oxford University Press; 2006. [Google Scholar]
- Warner C, Shoaib M. How Does Bupropion Work as a Smoking Cessation Aid? Addiction Biology. 2005;10 doi: 10.1080/13556210500222670. [DOI] [PubMed] [Google Scholar]
- Watson D, Clark L, Tellegen A. Development and Validation of Brief Measures of Positive and Negative Affect: The PANAS Scales. Journal of Personality and Social Psychology. 1988;54:1063–1070. doi: 10.1037//0022-3514.54.6.1063. [DOI] [PubMed] [Google Scholar]