

Abstract
The blood-brain barrier (BBB) is a monolayer of endothelial cells that is regulated by the proximity of a unique basement membrane and a tightly controlled molecular interaction between specialized subsets of cells including pericytes, astrocytes, and neurons. Working together, these cells form a neurovascular unit (NVU) that is dedicated to the local regulation of vascular function in the brain and BBB integrity. Accordingly, the intrinsic complexity of the cell–matrix–cell interactions of the NVU has made analyzing gene function in cell culture, tissue explants, and even animal models difficult and the inability to study gene function in the BBB in vivo has been a critical hurdle to advancing BBB research.
Zebrafish has emerged as a premier vertebrate organism to model and analyze complex cellular interactions in vivo and genetic mechanisms of embryonic development. To this end, we provide a technical overview of the procedures that can be used in Zebrafish to analyze BBB integrity with a focus on the cerebrovasculature of adult fish where the BBB is now defined. The techniques that are used to measure the functional integrity, the cell biology, and the ultrastructure of the BBB include permeability assays, fluorescent imaging of reporter genes, and electron microscopy, respectively. Each can be applied to the functional analysis of mutant fish in ways that characterize the molecular sequelae to pathological insults that compromise BBB integrity. Due to the highly conserved nature of both the genetics and cell biology of zebrafish when compared with higher vertebrates, drug discovery techniques can be used in zebrafish models to complement drug development studies in other model systems.
Keywords: Blood-brain barrier, Blood vessel, Vascular permeability, Drug screening, Genetic analyses, Zebrafish
1. Introduction
The blood-brain barrier (BBB) is a highly regulated multicellular partition separating blood from the brain parenchyma. Because of intrinsic difficulties in studying complex cellular interactions in vivo, preclinical studies of the BBB have focused on its pathophysiology, whereas cell biology techniques have been the primary tool to study the control of drug delivery in the central nervous system. Unfortunately, the in vitro cell culture techniques that have been developed to date have severe limitations that preclude a full understanding of the molecular control of barrier function let alone its physiological homeostasis. The development of multicellular coculture methods to mimic barriers has significantly increased our understanding of cell–cell interactions, but strategies to analyze the BBB in intact animal models have been limited.
In recent years, zebrafish have emerged as an ideal animal model system to study complex biological processes as, for example, the biology of development and growth. Specifically, the power of using forward and reverse genetics in zebrafish combined with the ease of generating large numbers of optically transparent embryos has resulted in the generation of large collections of mutant and transgenic reporter lines of fish that can be exploited to dissect the functional roles of specific cell types in vivo. As the smallest vertebrate model with a functional BBB and an endothelial cell-based vasculature, the range of genetic tools available to study Zebrafish are comparable to those available to study mice and make zebrafish a nearly ideal model to examine the cell–cell interactions in vivo.
An analysis of brain blood vessels in vertebrate reveals that there is a widely distributed and evolutionarily conserved requirement for a functional barrier between the lumen of blood vessels and the parenchyma of the brain. For example, in the case of teleost fish, the presence of tight junctions was inferred by electron microscopy (EM) and established by the restricted permeability of their BBB to classical markers of BBB function like horseradish peroxidase and sulfosuccinimidyl-biotin, which are consistent with the presence of tight junctions between endothelial cells. In addition, immunohistochemical markers localize specific molecular components of functional BBBs in the Zebrafish brain microvasculature including the tight junction proteins zonula occludens-1 and claudin 5 and association of astrocyte markers with endothelium (1). In addition to these histological and ultrastructural similarities between the BBB of zebrafish, rodents, and man, the methods discussed in this chapter describe an application of classic BBB tracers such as Evans blue dye to demonstrate the restricted permeability of brain blood vessels when compared to the fenestrated endothelium of zebrafish gills. Taken together, the findings are all consistent with the original observations of Paul Ehrlich (2) who first suggested the existence of a BBB that protects the brain of vertebrates.
While immunohistochemistry and transgenic reporter models are available to monitor the function of the vasculature in zebrafish embryos, there are simpler techniques that can be applied such as the endogenous alkaline phosphatase (AP) activity that is present in the endothelium and electron microscopy. While this staining technique has less resolution than required for most applications, it is inexpensive, straightforward, and rapid making it useful for screens, large scale applications, and teaching labs. Although non-endothelial cells also have endogenous AP activity, it was first described in human arterial endothelial cells and amphibian blood vessels (3, 4) and using a modified protocol (5–7), it provides a useful approach for examining developing vasculature.
2. Materials
2.1. Ex Vivo Tracking of Permeability Tracers in Zebrafish Adult Tissues
Zebrafish (Zebrafish International Resource Center, Eugene, OR; http://zebrafish.org/zirc).
1 L Tank.
Tricaine: 0.4% in water (3-aminobenzoic acid ethyl ester, Cat No. 5040, Sigma-Aldrich, St. Louis, MO) with 1% Na2HPO4•2H20, pH 7.2. 6 mL of 0.4% solution is used per 100 mL of swimming water.
Evans blue dye: 1% in water prepared fresh daily (Cat No. E2129, Sigma-Aldrich).
2.2. In Vivo Tracking of Permeability Tracers in Live Zebrafish Embryos
Depression Slide (Cat No. 48339-009, VWR, West Chester, PA).
Olympus SZX 10 stereoscope (Lehigh Valley, PA) with appropriate filter cubes.
Olympus BX61 fluorescence microscope equipped with the Fluoview 1000 laser scanning confocal imaging system.
2.3. Endothelial Cell Staining
50× stock 1-phenyl-2-thiourea (PTU) 0.01 M in water.
Fixatve solution: 3.7 % paraformaldehyde in PBS.
Permeabilization buffer: 100% methanol at −20°C.
Nitro blue tetrazolium (NBT)/5-Bromo-4-chloro-3-indoyl-phosphate (BCIP) stock solution: 18.75 mg/mL NBT + 9.4 mg/mL BCIP in 67% dimethyl sulfoxide (Cat No. 11 681 451 001 Boehringer Mannheim, Mannheim Germany).
Developing buffer: 0.1 M Tris-HCl, pH 9.5, 0.1 M NaCl and 0.05 M MgCl2.
NBT/BCIP substrate solution: 200 μL of NBT/BCIP stock solution in 9.8 mL developing buffer.
2.4. Electron Microscopy
EM fixative: 2% paraformaldehyde, 2% glutaraldehyde in 0.1 M sodium cacodylate, pH 7.4.
Osmium tetroxide solution: 1% osmium tetroxide and 0.5 % potassium ferrocyanide.
Ethanol: 70, 95, and 100%.
Propylene oxide.
Embed 812 Resin (Electron Microscopy Sciences, Hatfield, PA)
2% Uranyl acetate (Ted Pella, Redding, CA)
Reynolds Lead citrate: 2.66 g lead citrate, 3.52 g sodium citrate to 150 mL boiled water followed by addition of 0.8 g sodium hydroxide (Electron Microscopy Sciences, Hatfield, PA)
Zeiss 10C Electron Microscope, 100 kV (Zeiss, Peabody, MA).
3. Methods
3.1. Ex Vivo Tracking of Permeability Tracers in Zebrafish Adult Tissues
In several instances, it is useful to characterize the BBB in transgenic fish or in animals where function has been genetically modified. In these instances, we use permeability tracers that can be injected into anesthetized zebrafish and the tissues are analyzed ex vivo. This protocol is amenable to modifications with other fluorescent tracers (see Notes 1 and 2); however, here we focus on a classical marker of BBB breakdown due to the capacity of Evans blue dye to bind to serum albumin.
Anesthetize adult zebrafish in tricaine added to the swimming water to immobilize them.
Positioning the zebrafish to expose the ventral aspect, inject 50 μL of 1% Evans blue dye into the sinus venosus with a 30-gauge needle attached to a 0.5 mL syringe.
Return the zebrafish to the swimming water to recover for 10 min.
Anesthetize adult zebrafish in tricaine by immersion in a dish for 5 min, dissect anterior, and mount head and gill arches, remove the gill plate with care, and place it on a glass slide.
Cover the tissue with a 24 × 50 mm cover slip supported on each end by a stack of 22 × 22 mm cover slips to match the height of the specimen.
Add PBS as needed to the edges of the cover slip with a transfer pipette to prevent drying of the tissue.
Image fluorescence of the Evans blue dye with a 568 nm or equivalent filter set using a fluorescence stereoscope, upright fluorescence compound microscope or upright confocal microscope.
3.2. In Vivo Tracking of Permeability Tracers in Live Zebrafish Embryos
The capacity to analyze large numbers of zebrafish embryos combined with markers of BBB integrity is a novel approach focused on the identification of BBB components based on forward or reverse genetic screens.
Transfer 48–168 h embryos to 3–4 wells of a 24 well dish.
Add Evans blue dye to the swimming water at a range of recommended concentrations (0.01, 0.1 and 1%), dependent on age and desired intensity of stain and incubate for 20 min.
Carefully remove the dye-labeled water with a transfer pipette, leaving embryos in the well.
Wash 5–10 times with swimming water to remove excess dye until the swimming water is clear.
Anesthetize to immobilize for imaging by the addition of tricaine to swimming water.
Transfer embryos to a depression slide for imaging on a fluorescence stereoscope, microscope or CCD imaging system (see Notes 3 and 4).
Embryos may be returned to normal swimming water for at least 48 h further if imaging time is kept to a minimum and the dose of tricaine minimized to avoid overdose.
3.3. Endothelial Cell Staining
In cases where it is necessary to identify general vascular structure in intact fish, the following staining protocol is a useful and practical technique without having to rely on immunohistochemistry or transgenic models.
Treat embryos at 24 h postfertilization with PTU to prevent melanization and facilitate imaging by addition to swimming water
Fix in fixative solution overnight at 4°C.
Place in permeabilization buffer for at least 1 h at −20°C. Embryos may be stored at this point in 100% methanol at −20°C if needed.
Wash in Developing buffer twice for 10 min each.
Incubate in NBT/BCIP substrate solution for 15–30 min, monitoring color for development.
Before the sample overdevelops, wash three times in Developing buffer, 5 min each.
Fix in fixative solution for at least 30 min and store at 4°C.
Mount on depression slide and image using a stereoscope (Fig. 1).
Fig. 1.
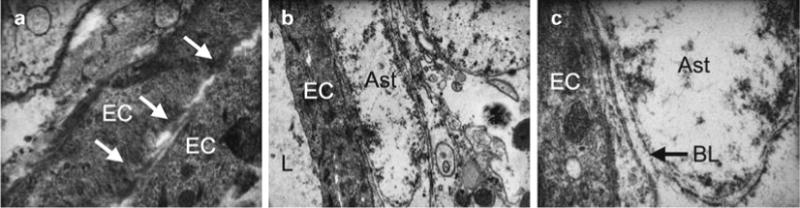
Electron micrographs show the blood-brain barrier in zebrafish. Adult zebrafish brains were fixed, embedded, and sectioned using standard techniques and imaged using a transmission electron microscope. (a) The junctions formed between overlapping edges of brain endothelial cells (EC) are shown (arrows). (b) The presence of an astrocyte (Ast) endfoot adjacent to an endothelial cell and the lumen (L) are indicated. (c) The basal lamina (BL) constituting the extracellular matrix component of the blood-brain barrier found in higher vertebrates is shown between the astrocyte endfoot and endothelial cell. (a) ×25,000; (b) ×12,000; (c) ×50,000.
3.4. Electron Microscopy
To characterize the ultrastructure of capillaries and associated basal lamina and astrocytes, electron microscopy is necessary (Fig. 2).
Anesthetize intact zebrafish in tricaine for 5 min.
For embryos, fix intact embryos in EM fixative, and for adults, remove the brains first and then fix for 12–16 h.
Rinse embryos in PBS three times, and fix in osmium tetroxide buffer for 1 h followed by alcohol dehydration 10 min each with 70% ethanol, 95% ethanol, and three changes of 100% ethanol.
Incubate dehydrated embryos in two changes of 100% propylene oxide for 15 min each.
Infiltrate tissue in a 50% mixture of resin in 50% propylene oxide for 18 h, followed by 1 h in 100% resin, and a final 100% resin incubation. Polymerize for 18 h in a 60°C oven.
The block is ready for 60 nm thin sectioning.
Stain ultrathin sections with uranyl acetate for 30 min and Reynold’s lead citrate for 15 min and examine using a transmission electron microscope.
Fig. 2.
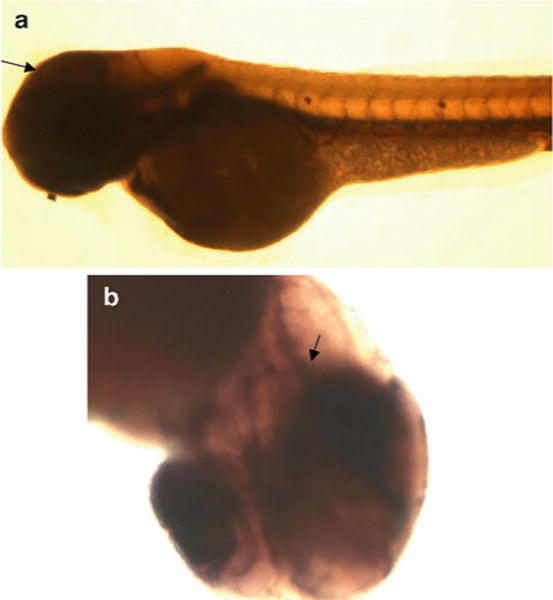
Alkaline phosphatase staining of blood vessels in intact zebrafish embryos is shown. Seventy-two hour zebrafish embryos were fixed and subjected to incubation with NBT/BCIP alkaline phosphatase substrate to localize blood vessels. The image was acquired with an Olympus SZX10 stereoscope and CCD camera. Lateral (a) and ventral (b) images of cranial blood vessels (arrows) are shown.
Acknowledgments
This work was supported by grants from the NIH. The authors thank the contribution of Alexandra Borboa and Montha Pao toward several of these protocols.
Footnotes
For the imaging of fluorescent tracers, a wide array of various wavelengths and of various molecular weights are commercially available (Invitrogen, Carlsbad, CA). See also the following URL: http://www.invitrogen.com/site/us/en/home/References/Molecular-Probes-The-Handbook/Fluorescent-Tracers-of-Cell-Morphology-and-Fluid-Flow/Fluorescent-and-Biotinylated-Dextrans.html#head6.
The choice of fluorescent tracer is dependent on the hardware limitations of the available instrumentation. Selection of different molecular weights will affect the rate and bulk transfer of a given tracer in a specific vascular bed. Using the technique described in Subheading 3.2, in a 24-well dish format various tracers can be optimized based on molecular weight, concentration, and incubation time.
The methods described in this chapter are compatible with multiphoton confocal systems and spinning disk confocal, each generally optimized for superior imaging depth/resolution and faster kinetics, respectively.
Imaging with a deep cooled CCD imaging system was performed with a Lumina imaging system (Caliper Life Sciences, Hopkinton, MA) equipped with appropriate fluorescence filter cubes, background subtraction, and image integration software. This system is especially compatible with plate format screening of fluorescent and luminescent tracers.
References
- 1.Jeong JY, Kwon HB, Ahn JC, Kang D, Kwon SH, Park JA, Kim KW. Functional and developmental analysis of the blood-brain barrier in zebrafish. Brain Res Bull. 2008;75:619–628. doi: 10.1016/j.brainresbull.2007.10.043. [DOI] [PubMed] [Google Scholar]
- 2.Ehrlich P. Gesammelte Arbeiten zur Immunitaetsforschung. Hirschwald; Berlin: 1904. Ueber die beziehungen von chemischer constitution, verteilung und pharmakologischer wirkung. [Google Scholar]
- 3.Bannister RG, Romanul FC. The localization of alkaline phosphatase activity in cerebral blood vessels. J Neurol Neurosurg Psychiatry. 1963;26:333–340. doi: 10.1136/jnnp.26.4.333. [DOI] [PMC free article] [PubMed] [Google Scholar]
- 4.Stolk A. Localized areas of high alkaline phosphatase activity in the endothelium of arteries in the axolotl. Experientia. 1963;19:21. doi: 10.1007/BF02135334. [DOI] [PubMed] [Google Scholar]
- 5.Childs S, Chen JN, Garrity DM, Fishman MC. Patterning of angiogenesis in the zebrafish embryo. Development. 2002;129:973–982. doi: 10.1242/dev.129.4.973. [DOI] [PubMed] [Google Scholar]
- 6.Schulte-Merker S. Looking at Embryos. Oxford University Press; New York: 2002. [Google Scholar]
- 7.Kamei M, Isogai S, Weinstein BM. Imaging blood vessels in the zebrafish. Methods Cell Biol. 2004;76:51–74. doi: 10.1016/s0091-679x(04)76004-5. [DOI] [PubMed] [Google Scholar]