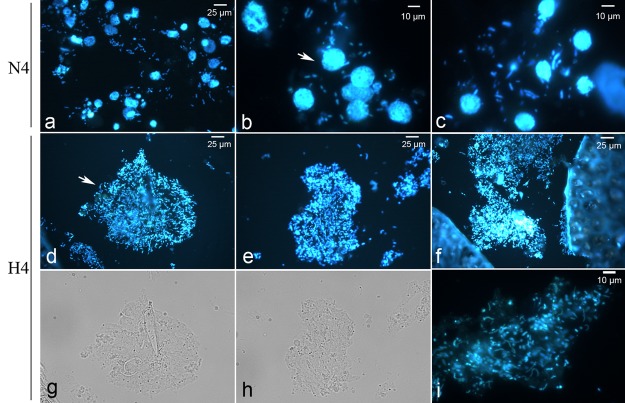
FIG 5 .
Microscopic observation of bacteria and sponge cells in control (N4, a to c) and treated (H4, d to f) samples following DAPI staining. Sponge cells (indicated by the arrow in panel b) and bacteria were stained blue. Bacteria in the treated samples aggregated (indicated by the arrow in panel d) and were distributed in the matrix (i). Novel bacterial morphotypes (vibrios) appeared in the bacterial aggregates (i). Panels g and h show bright-field images corresponding to those in panels d and e, respectively.

