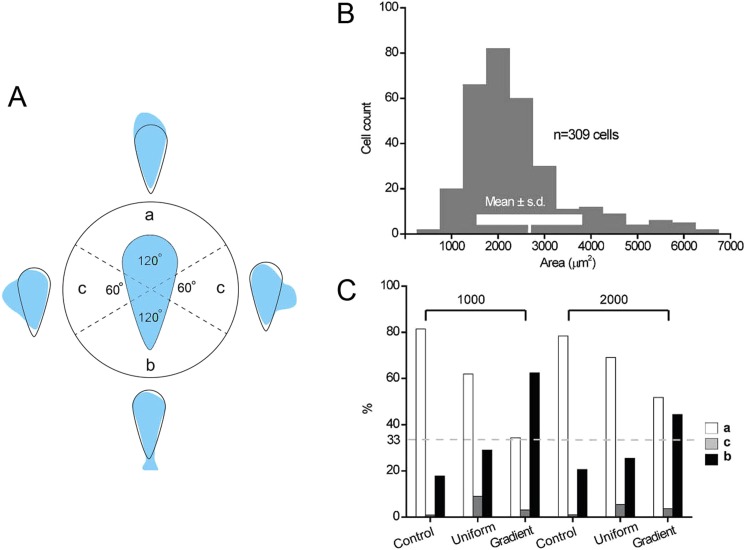
FIG. 2.
(a) The statistics of the ends from which teardrop shape confined cells initially move. a, b, and c represent cells moving from: the blunt end, sharp end, or the sides of the teardrop, respectively. (b) The areas of individual MDA-MB-231 cells cultured freely on culture dish were measured by phase contrast microscopy and calculated by Image-Pro Plus. Within the histogram, the mean area ± one standard deviation is shown. (c) The polarity of teardrop shape confined cells in different chemical environments. Cell numbers counted from left to right was 133, 155, 27, 102, 110, and 32, respectively. All the data were collected from at least 3 individual experiments.

