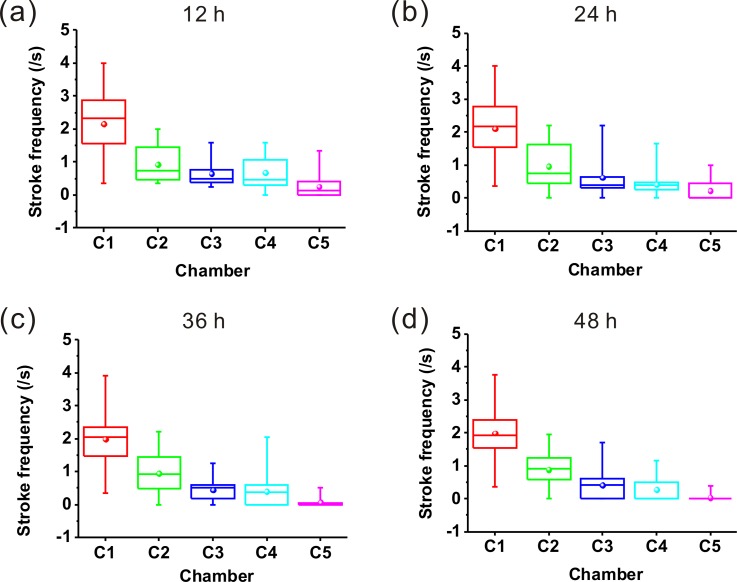
FIG. 5.
Stroke frequencies of worms in chamber 1–5 exposed to MnCl2 for (a) 12 h, (b) 24 h, (c) 36 h, (d) 48 h. The bottom and top of each box correspond to the 25th and 75th percentiles, respectively, while the horizontal line inside the box denotes the median. The ends of whiskers are the minimum and maximum values of the data set. And the sphere indicates the mean. 20 worms used in each chamber.

