Abstract
Mutations in the photoreceptor-specific gene peripherin-2 (PRPH-2, also known as retinal degeneration slow/RDS) cause incurable retinal degeneration with a high degree of phenotypic variability. Patient phenotypes range from retinitis pigmentosa to various forms of macular and pattern dystrophy. Macular and pattern dystrophy in particular are associated with complex, poorly understood disease mechanisms, as severe vision loss is often associated both with defects in the photoreceptors, as well as the choroid and retinal pigment epithelium (RPE). Since there is currently no satisfactory model to study pattern dystrophy disease mechanisms, we generated a knockin mouse model expressing an RDS pattern dystrophy mutation, Y141C. Y141C mice exhibited clinical signs similar to those in patients including late-onset fundus abnormalities characteristic of RPE and choroidal defects and electroretinogram defects. Ultrastructural examination indicated that disc formation was initiated by the Y141C protein, but proper sizing and alignment of discs required wild-type RDS. The biochemical mechanism underlying these abnormalities was tied to defects in the normal process of RDS oligomerization which is required for proper RDS function. Y141C-RDS formed strikingly abnormal disulfide-linked complexes which were localized to the outer segment (OS) where they impaired the formation of proper OS structure. These data support a model of pattern dystrophy wherein a primary molecular defect occurring in all photoreceptors leads to secondary sequellae in adjacent tissues, an outcome which leads to macular vision loss. An understanding of the role of RDS in the interplay between these tissues significantly enhances our understanding of RDS-associated pathobiology and our ability to design rational treatment strategies.
INTRODUCTION
Over 80 different pathogenic mutations in the photoreceptor-specific gene PRPH-2 (peripherin-2, also known as retinal degeneration slow/RDS) (1) cause diverse, dominantly inherited retinal pathologies including cone-rod dystrophies, retinitis pigmentosa and many subtypes of macular degeneration including pattern dystrophies, adult-onset foveomacular vitelliform dystrophy and other forms of macular dystrophy (1-3). PRPH-2-associated disease is characterized by a high degree of inter- and intrafamilial phenotypic heterogeneity and variations in age-of-onset, severity and penetrance (1), complicating study of disease mechanisms and the development of therapeutics.
RDS, a tetraspanin glycoprotein localized to the photoreceptor disc rim region, is required for the initial formation and subsequent maintenance of both rod and cone outer segments (OSs) (4–6), and thus for vision. While haploinsufficiency (e.g. in the rds+/− mutant mouse (7) or patients (8) and mice (9) carrying loss-of-function mutations) tends to primarily affect rod photoreceptors and lead to retinitis pigmentosa, the pathophysiologies for mutations causing macular or cone-dominant disease appear to be much more complex (1, 10–12). One important complicating factor is that vision loss in many cases of macular and pattern dystrophy is not necessarily due entirely to defects in cones or rods but also to contributions from multiple tissues including the retinal pigment epithelium (RPE) and the choroid (1, 13, 14). To further our understanding of the processes underlying complex RDS disease and facilitate future rational therapeutic development, we here elected to study the Y141C pattern dystrophy mutation in PRPH-2.
In common with other PRPH-2 mutations, Y141C-associated disease is dominantly inherited, with patients carrying one WT and one mutant allele, and typically presents in the 5th to 6th decades of life (15). Patients with Y141C exhibit a high degree of inter- and intrafamilial phenotypic variability. Although the primary defect usually centers at the macula, with fundoscopic changes characteristic of macular or pattern dystrophy, often patients report night blindness and some have been diagnosed with retinitis pigmentosa (a disease usually associated with rod cell loss) as well as or instead of pattern dystrophy (2, 13). Y141C patients often display both exudative and non-exudative macular changes including RPE pigmentation defects, drusen-like deposits, geographic chorioretinal atrophy and choroidal neovascularization (1, 2) which all contribute to the severity of vision loss (13, 14, 16). Together, these results make the Y141C mutation an especially interesting target for exploration of complex pattern dystrophy phenotypes, and secondary defects outside the photoreceptors.
The function of RDS is inextricably linked to its ability to form a wide variety of covalent and non-covalent homo- and heteromeric complexes (with its non-glycosylated homolog rod OS membrane protein-1/ROM-1) (17, 18). Gross failure to oligomerize properly can lead to protein degradation and haploinsufficiency/retinitis pigmentosa (9), while more subtle changes in complex assembly, content or stability are thought to underlie cone-dominant defects (10, 11). Following initial protein synthesis in the photoreceptor inner segment, RDS assembles into homo- and heterotetramers with itself and ROM-1 (19, 20). The tetramers traffic to the OS where they form intermolecular covalent disulfide bonds with neighboring tetramers to form homo- and hetero-intermediate oligomers and RDS higher-order homo-oligomers which are necessary for proper OS formation (17, 18, 21). This oligomerization is mediated by the second intradiscal loop (D2) of RDS (22) and requires the seven D2 loop cysteine residues. Six of these (C165, C166, C213, C214, C222 and C250) form intramolecular disulfide bonds that stabilize proper folding and tertiary structure of the D2 loop (21). The seventh cysteine (C150) mediates the formation of the intermolecular disulfide bond necessary for higher-order complex formation in the OS (18, 21). The importance of these residues is underscored by the observation that many disease-causing mutations (Y141C, C165Y, C213Y, C214S, C214Y and C250F) (8, 13, 14, 23–25) directly alter the number of D2 loop cysteines. Subtle variability in the formation of RDS oligomers may underlie some of the phenotypic variability associated with PRPH-2 mutations and may directly impact the development of secondary sequellae such as RPE toxicity and choroidal defects. As a result, gaining a better understanding of the defects in RDS complex formation is critical to an understanding of associated disease mechanisms.
Excitingly, our results presented here show that the Y141C mutation leads to the formation of abnormal, high-molecular-weight RDS and ROM-1 complexes, but not abnormal protein aggregation in the inner segment or ER. Although mouse eyes do not have a macula, mice carrying this mutation exhibit phenotypes which correlate well with patient retinitis pigmentosa and pattern dystrophy phenotypes, including loss of rod function, loss of cone function and fundoscopic changes consistent with defects in the RPE.
RESULTS
The Y141C-RDS allele is expressed normally in knockin retinas and traffics to the OS
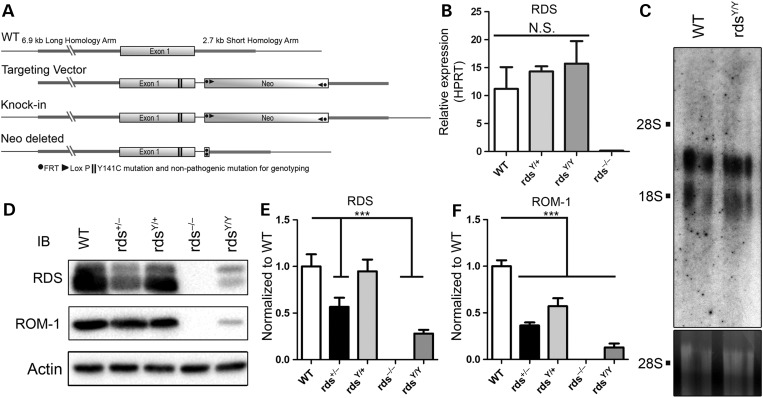
The use of knockin technology to generate a Y141C mutant mouse model (Fig. 1A) allowed us to examine the cellular impacts of this disease-causing mutation without the confounding analytical noise created by haploinsufficiency and misregulation of RDS expression which can occur in transgenics. For clarity, the Y141C allele is abbreviated as (Y) with heterozygous and homozygous mice referred to as rdsY/+ and rdsY/Y, respectively. While the heterozygous mice represent the genetic case in patients (one WT and one mutant allele), the homozygous mice enable study of the mutant protein, so both are used here. In most experiments, controls include animals heterozygous (rds+/−) or homozygous (rds−/−) for the naturally occurring RDS knockout (also known as rds/rd2). Following the generation of the knockin model, we assessed retinal expression of the mutant gene at P30 by quantitative real-time polymerase chain reaction (qRT-PCR) and northern blot (Fig. 1B and C, respectively). Message size and levels in rdsY/+ and rdsY/Y were not significantly different from WT (Fig. 1B and C), confirming that the knockin allele was expressed and regulated normally. RDS and ROM-1 protein were analyzed and quantified by western blot (WB; Fig. 1D–F). RDS protein levels in rdsY/+ were unchanged when compared with WT (Fig. 1E), although ROM-1 levels were reduced by ∼43% in rdsY/+ versus WT (Fig. 1F). These data showing that in the rdsY/+ the RDS levels are normal but ROM-1 levels are reduced suggest that the ratio of RDS : ROM-1 is altered. Interestingly, rdsY/Y retinas exhibited RDS and ROM-1 protein levels that were significantly reduced (28 and 13% of WT, respectively). No ectopic expression of the Y141C protein was observed (Supplementary Material, Fig. S1). These data suggest that the Y141C-RDS knockin allele is regulated normally, but that in the rdsY/Y there is a significant drop in the steady-state levels of the mutant RDS protein and ROM-1.
Figure 1.
Genetic knockin of the Y141C mutation in RDS does not have an impact on RDS expression levels. The Y141C mutation was introduced into exon 1 of the RDS gene in order to drive properly regulated expression of the Y141C-RDS allele (A). Total RNA was isolated from the retinas of mice of the indicated genotypes at P30 and subjected to qRT-PCR for RDS and the housekeeping gene HPRT (B). Total RNA was also subjected to northern blotting using radiolabeled RDS cDNA as a probe (C). 28S and 18S ribosomal RNA are marked for size reference and 28S is shown as loading control. Levels of RDS protein in total retinal extracts were analyzed from indicated genotypes by WB followed by visualization using antibodies specific to RDS, ROM-1 and actin (D). Band densities were normalized to actin and set relative to WT: RDS (E), ROM-1 (F). Shown are mean ± SEM. N = 3 (B and C) and 8 (E and F) independent samples. ***P < 0.001 by one-way ANOVA with Bonferroni's post hoc comparison.
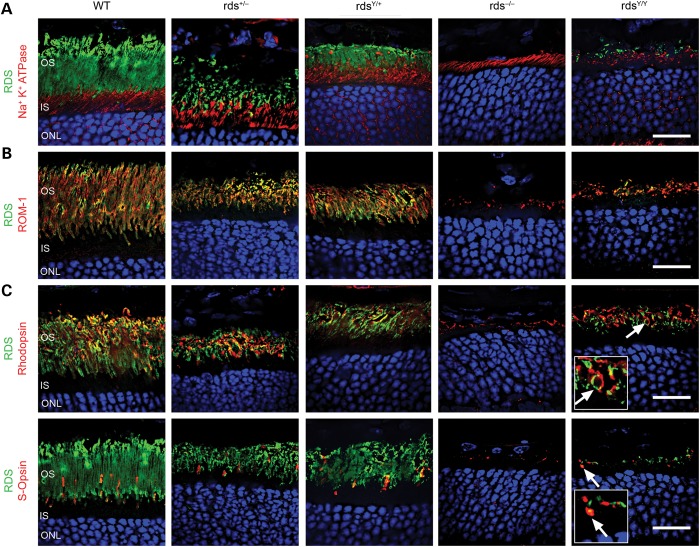
We have previously observed that some D2 loop mutations in RDS can adversely affect OS targeting leading to accumulation of RDS protein in the inner segment (18). To determine if the mutant RDS properly localized to the OS, P30 retinal sections were co-labeled with RDS and Na+K+ATPase, an inner segment marker. In all genotypes analyzed, RDS (Fig. 2A, green) formed a distinct layer that did not significantly overlap with the Na+K+ATPase labeling (red), indicating that both WT and Y141C-RDS trafficked properly to the OS, even in the rdsY/Y retina where no WT RDS is present. Co-labeling with RDS (green) and ROM-1 (red) confirmed that ROM-1 co-localized with RDS in all genotypes (Fig. 2B). Finally, co-labeling with rhodopsin (red in Fig. 2C, top) and S-opsin (red in Fig. 2C, bottom) confirmed that Y141C-RDS was expressed and traffics in both rods and cones (Fig. 2C, arrows and insets).
Figure 2.
Y141C-RDS traffics to the OS. Retinal sections at P30 from the indicated genotypes were labeled with antibodies against RDS (green A–C) and Na+K+ATPase (red, A), ROM-1 (red, B), rhodopsin (red, top C) or S-opsin (red, bottom C). Arrows and insets indicate regions of co-localization between RDS and opsins. OS, outer segments; IS, inner segment; ONL, outer nuclear layer. Scale bar: 20 µm.
Y141C heterozygotes exhibited decreased rod and cone function
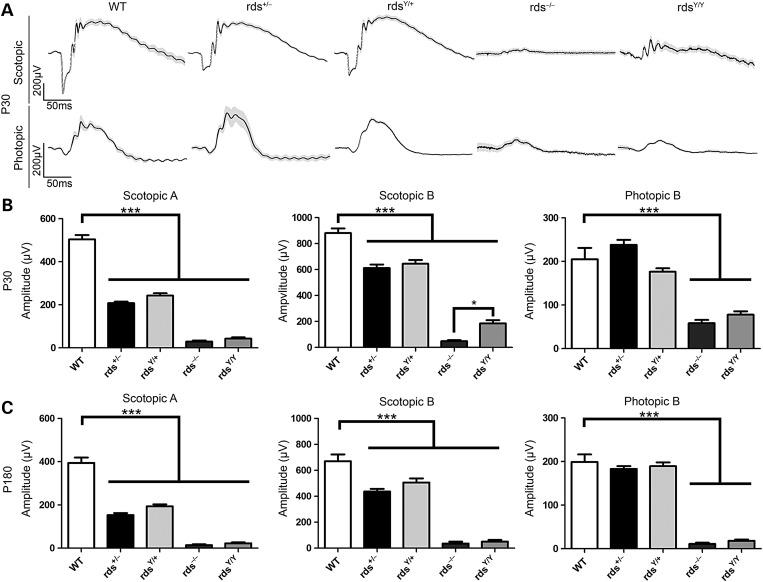
To determine how closely the Y141C mouse modeled the human phenotype, we first assessed retinal function by conducting full-field electroretinography (ERG) at P30 (Fig. 3A and B) and P180 (Fig. 3C). Scotopic (rod based) responses from the rdsY/+ and the rds+/− were significantly reduced when compared with WT but were not significantly altered compared with each other at either P30 or P180 (Fig. 3B and C, left and middle). Consistent with this, mean scotopic a : b wave ratios were not different between the two genotypes (rdsY/+ versus rds+/−), although a : b wave ratios in rdsY/+ and rds+/− were both lower than WT, consistent with the defect originating in photoreceptors. Scotopic responses in rdsY/Y and rds−/− eyes were also both significantly reduced compared with WT with neither exhibiting an a-wave above the limit of detection. However, the rdsY/Y wave forms had a better shape than those from rds−/− (Fig. 3A, plotted is the mean wave form with gray shaded area corresponding to SEM), an observation reflected in a statistically significant improvement in the postsynaptic scotopic b-wave amplitude in rdsY/Y versus rds−/− at P30 (Fig. 3B, middle). This improvement disappeared by P180 as scotopic function in the rdsY/Y was lost (Fig. 3C, middle). At P30, photopic (cone based) b-wave amplitudes were comparable in rds+/−, rdsY/+ and WT (Fig. 3B, right). Photopic responses in rds−/− and rdsY/Y were significantly lower than WT, and in contrast to the case in rods (scotopic b-wave), photopic b-wave amplitudes were not improved in rdsY/Y versus rds−/− (Fig. 3C, right). These functional analyses suggest that the Y141C protein alone may support some rod function (e.g. P30 rdsY/Y scotopic b-waves), but only has limited ability to promote OS function.
Figure 3.
Y141C-RDS is able to support limited OS function. The ability of the rdsY/+ and the rdsY/Y animals to support OS function was assessed using scotopic (rod) and photopic (cones) ERG at P30 (A and B) and at P180 (C). Wave forms were prepared by averaging the values from all available ERGs of the indicated genotypes at P30 and showing the mean (black) ± SEM (gray shading) (A). The amplitude of maximum scotopic a- and b-waves, and maximum photopic b-waves, is plotted as mean ± SEM at P30 and P180 (B and C). N = 4–14 animals for each genotype/age. ***P < 0.001 by one-way ANOVA with Bonferroni's post hoc comparison.
Y141C-RDS protein leads to retinal degeneration and fundoscopic changes consistent with patient phenotypes
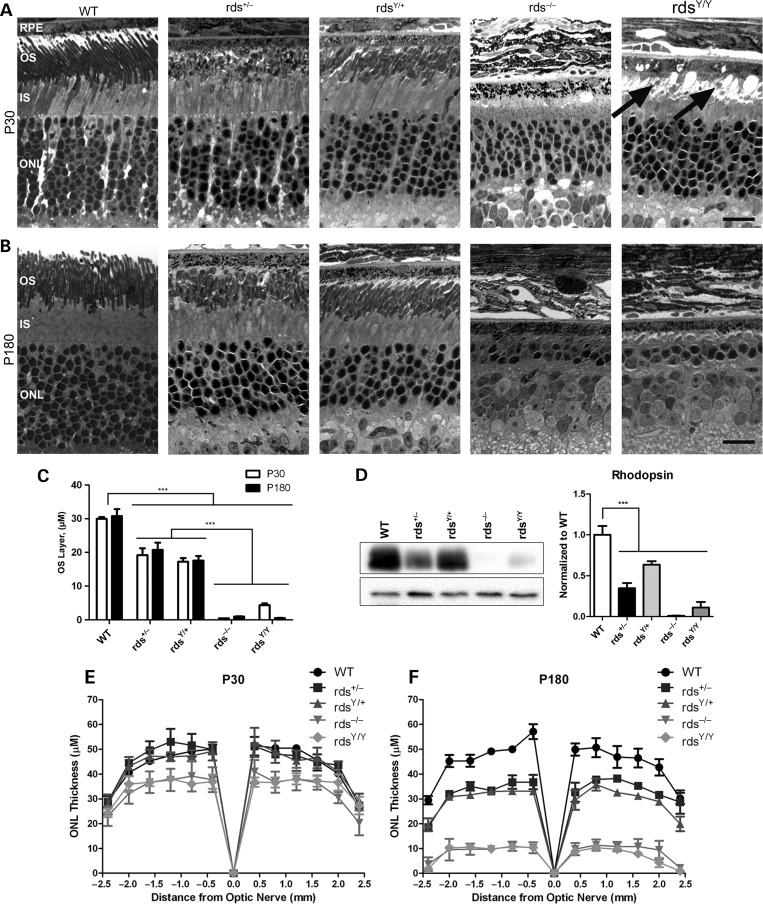
To determine whether the functional defects associated with the Y141C allele have structural underpinnings, we conducted morphometric analysis on plastic embedded sections (Fig. 4). The OS layers in the rdsY/+ and rds+/− are both significantly thinner than WT but not significantly different from each other (Fig. 4A and B, quantification in Fig. 4C). Consistent with this OS shortening, the total amount of rhodopsin is decreased in rds+/− and rdsY/+ (Fig. 4D). Small rounded OS structures were seen at P30 in the rdsY/Y retina (Fig. 4A, arrows); however, they disappeared by P180. To assess photoreceptor degeneration, the thickness of the outer nuclear layer (ONL, which contains photoreceptor cell bodies) was measured along the superior to inferior plane (Fig. 4E and F). At P30 there was no significant reduction in ONL thickness in the rds+/− and rdsY/+ retinas compared with WT and only a small reduction in the rds−/− and rdsY/Y (Fig. 4E), suggesting that changes in function are due primarily to changes in OS length (Fig. 4C). By P180, the ONL was significantly thinner in the rds+/− and rdsY/+ (compared with WT), but as in the case with the ERG function, they were not different from each other. At P180, photoreceptor degeneration in the rds−/− and rdsY/Y was severe: the ONL was quite thin in the central retina and almost absent in the periphery (Fig. 4F).
Figure 4.
Expression of Y141C-RDS leads to photoreceptor degeneration. Representative light microscopic images from retinal sections at P30 (A) and P180 (B) are shown. OS length was quantified and plotted as mean ± SEM (C). Rhodopsin protein levels were assessed by WB and quantified. (D) ONL thickness was assessed in central retinal sections at increasing distances from the optic nerve head at P30 (E) and P180 (F). Plotted are means ± SEM from N = 3 eyes/genotype/age. RPE, retinal pigment epithelium; OS, outer segments; IS, inner segment; ONL, outer nuclear layer. Scale bars: 5 µm.
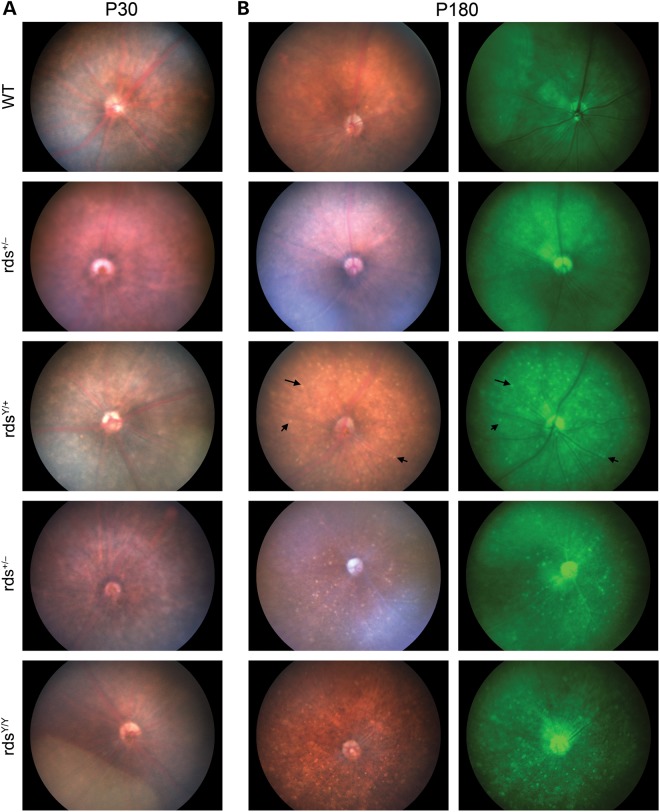
One of the key phenotypes associated with pattern dystrophy is characteristic fundoscopic changes, which occur due to defects in the choroid and adjacent RPE, often along with accumulation of RPE lipofuscin (13, 26). Consistent with the late age-of-onset in patients, we observed no fundus abnormalities at P30 in Y141C mice (Fig. 5A) or any other genotype. In sharp contrast, at P180 widespread yellow flecks (Fig. 5B, black arrows, left panels) can be observed in the fundus of rdsY/+ (11/11 eyes examined) but not WT (0/8 eyes examined). Images from additional animals are shown in Supplementary Material, Figure S2A. These flecks are hyperfluorescent and can be more easily visualized in fundus autofluorescence images (Fig. 5B, right panels). Confirming that the speckling was due to the Y141C allele and not simply to RDS deficiency, the majority (8/10) rds+/− eyes were normal although 2/10 eyes exhibited very mild signs of flecking. At P180, both the rdsY/Y and rds−/− exhibited the flecking (9/9 for rdsY/Y and 8/10 for rds−/−) most likely due to the ongoing degeneration in these models (Fig. 5B, bottom). Concurrent fluorescein angiography (FA) showed that at these timepoints there were no changes in retinal vasculature in any genotype (Supplementary Material, Fig. S2B).
Figure 5.
Fundus photographs of rdsY/+ show retinal flecking at P180. Fundoscopic examination was performed at the indicated ages and genotypes. At P30 no significant pigmentation defects were observed in any of the genotypes when compared with WT (A). At P180, rds+/− fundus still appeared normal; however, yellow flecks were apparent throughout the fundus of the rdsY/+, rds−/− and rdsY/Y (arrows show examples of this widespread flecking, B). Left and right columns of (B) come from the same eye, left column is brightfield, and right column shows fundus autofluorescence. N = 4–11 eyes/genotype/age.
RDS complex formation is altered in Y141C knockin retinas
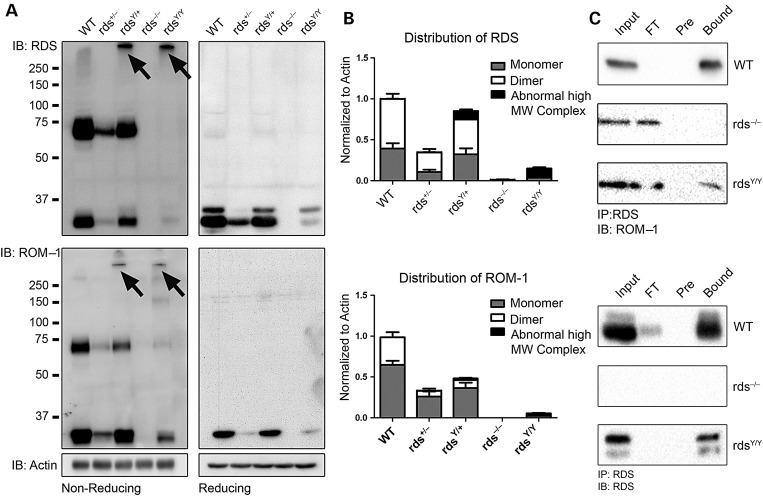
Our data thus far show that rdsY/+ retinas exhibit normal levels of properly localized RDS, but shortened OSs and structural–functional degeneration comparable with the rds+/−. We hypothesized that the Y141C-RDS inability to promote normal OS structure was due to changes in RDS complex formation. To test this hypothesis, we conducted detailed biochemical analysis. Retinal extracts were separated by sodium dodecyl sulphate–polyacrylamide gel electrophoresis (SDS–PAGE)/WB under either reducing or non-reducing conditions (Fig. 6A and B). For all biochemical experiments, N-ethylmaleimide (NEM) was included in the extraction buffer to prevent cysteine shuffling. Under denaturing but non-reducing conditions, WT RDS ran as a monomer and a dimer (arising from non-covalent and covalently bound complexes, respectively), and importantly, this pattern is maintained in the rds+/− retina even though protein levels are lower (Fig. 6A, top left). In contrast, retinas from rdsY/+ had mono- and dimeric RDS as well as a third complex visible at a higher molecular weight (Fig. 6A, arrows). In the rdsY/Y, RDS was detected almost exclusively in this abnormal higher molecular-weight form, although a small amount of monomer was still present. In common with the normal dimeric form, these abnormal high-molecular-weight complexes were reduced to monomers in the presence of reducing agent (Fig. 6A, top right), suggesting that the abnormal complexes were held together through intermolecular disulfide bonds. Interestingly, ROM-1 was also found in these abnormal complexes in extracts from rdsY/+ and rdsY/Y retinas, although normal mono- and dimeric ROM-1 were also present (Fig. 6A, bottom left). Quantification of these three forms (monomer, dimer and abnormal high-molecular-weight complex, Fig. 6B) showed that only ∼12% of total RDS was found in the abnormal complexes in rdsY/+ retinas even though ∼50% of RDS should be Y141C mutant. In contrast, in the rdsY/Y, ∼73% of RDS was found in the abnormal complexes. The appearance of ROM-1 in the abnormal high-molecular-weight Y141C suggested that Y141C-RDS retained the ability to interact with ROM-1. This was confirmed by immunoprecipitation (IP) with RDS antibodies (Fig. 6C).
Figure 6.
Abnormal complexes of both RDS and ROM-1 are observed by WB. Non-reducing SDS–PAGE/WBs were prepared from total retinal extracts in the presence of NEM and probed with antibodies specific to RDS (A, top), ROM-1 (A, middle) and actin (A, bottom). Note that while RDS runs as a monomer and a dimer in both the WT and rds+/− retinal extracts, in both the rdsY/+ and the rdsY/Y abnormal high-molecular-weight complexes were observed when probed with antibodies against RDS and with ROM-1 (arrows). The same samples were also analyzed by reducing SDS–PAGE/WB (A, right). Only monomers were observed when samples were prepared under reducing conditions. Quantification of relative levels of each RDS and ROM-1 complex is shown for reference, N = 4 independent samples (B). Reciprocal co-IPs confirm that RDS/ROM-1 interactions were maintained in retinal extracts from animals carrying the Y141C-RDS mutation (C). FT, flow through (unbound); Pre, preclear, N = 3.
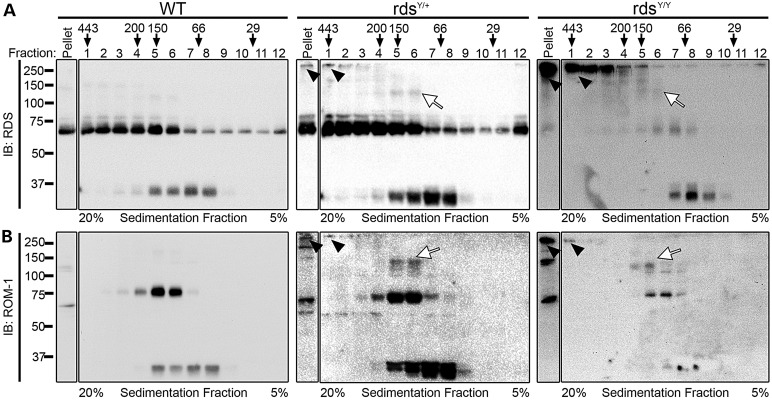
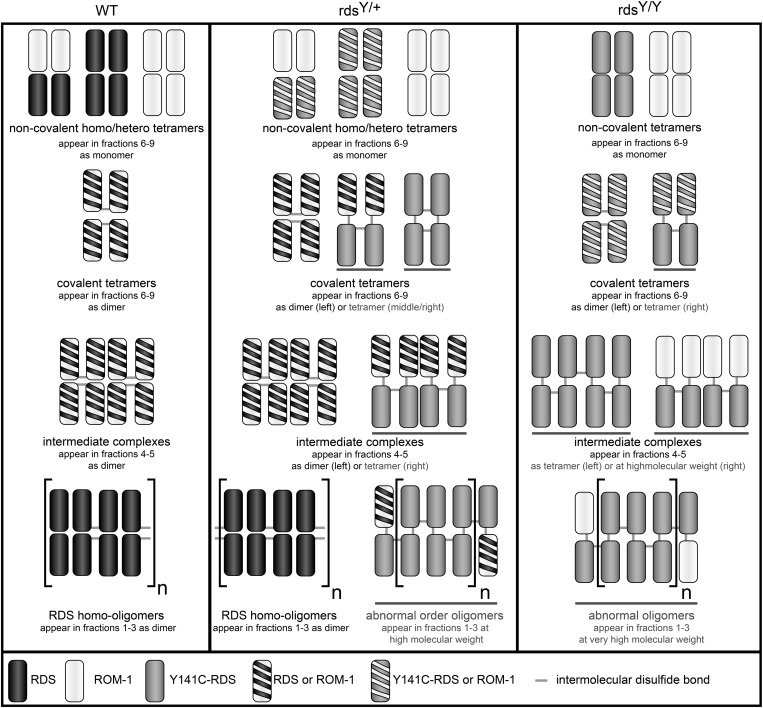
To further analyze RDS and ROM-1 complex formation under native conditions, retinal extracts underwent velocity sedimentation on a non-reducing 5–20% sucrose gradient followed by non-reducing SDS–PAGE/WB (Fig. 7). WT RDS higher-order oligomers are found in fractions 1–3, intermediate complexes in fractions 4–5, and tetramers in fractions 6–9 (27). In WT retinas, RDS was detected in both mono- and dimeric forms in the tetramer and intermediate-complex fractions. Only dimers were seen in higher-order fractions (Fig. 7A), consistent with higher-order complex assembly being dependent on the formation of intermolecular disulfide bonds (18, 21). ROM-1 was detected (in di- and monomeric forms) in fractions associated with tetramers and intermediate complexes but not in higher-order complexes (Fig. 7B). In the rdsY/+ retina, normal RDS and ROM-1 complexes were present, but an additional higher molecular weight band was detected in the high-density fractions and was prominently present in the pellet (Fig. 7, black arrowheads). In fractionated retinas from the rdsY/Y, this abnormal band was even more apparent and the overall pattern was distinctly different; all higher-order and intermediate complexes were greatly reduced and instead only the abnormal complexes were observed in the highest density fractions and in the pellet RDS (Fig. 7, arrowheads). Of note, ROM-1 is usually excluded from fractions 1–3; however, in the rdsY/Y, abnormal high-molecular-weight ROM-1 complexes were present in these fractions and in the pellet. In addition in the rdsY/+ and rdsY/Y, a small but reproducible portion of RDS and ROM-1 in both the tetra- and octameric fractions migrated at an apparent MW of 140 kDa (white arrows, Fig. 7A and B) the predicted size of a tetramer. All of these abnormal complexes running at higher molecular weight (arrows/arrowheads, Fig. 7A) are likely an outcome of the presence of an additional cysteine in the Y141C mutant protein (predicted to have the ability to form a second intermolecular disulfide bond). The abnormal complex formation of the Y141C mutant protein is pictorially illustrated in Figure 8. Although the WT mouse exhibits tetramers, intermediate, complexes and large oligomers, each RDS/ROM-1 molecule can only form a single intermolecular disulfide bond (the remaining complex assembly relies on non-covalent interactions), thus when separated under denaturing but non-reducing conditions (i.e. non-reducing SDS–PAGE after non-reducing sucrose gradients), mono- and dimeric forms appear. However, in the presence of the Y141C mutant protein, additional disulfide bonds form, leading to the appearance of abnormal covalently linked complexes (underlined on Fig. 8) with higher apparent molecular weights. These two sets of experiments indicate that although oligomerization occurs in the presence of Y141C-RDS, it is decidedly abnormal.
Figure 7.
Y141C-RDS leads to formation of abnormal high-molecular-weight oligomers. To analyze RDS/ROM-1 complexes under non-denaturing conditions, whole retinal extracts were prepared and run on a continuous 20% (fraction 1) to 5% (fraction 12) non-reducing sucrose gradient. Fractions were collected and analyzed using non-reducing SDS–PAGE/western blotting with antibodies specific for RDS (top) and ROM-1 (bottom). The position that molecular weight markers appear when using this protocol is listed above the fraction number for reference. In the rdsY/+ a full complement of normal RDS monomer and dimer were seen; however, abnormal high-molecular-weight complexes are observed in the heavier fractions as well as the pellet (arrowheads, middle). The rdsY/Y lacks normal higher-order complexes (dimers in high-density fractions) of RDS which are replaced by very distinct high-molecular-weight complexes in fractions 1–3 and in the pellet (arrowheads, right). N = 3–4 independent experiments/genotype.
Figure 8.
Abnormal disulfide-linked complexes are formed in the presence of the Y141C mutation. Pictorial representation of velocity sedimentation data from Figure 7. RDS: black, ROM-1: white, Y141C-RDS: grey. Striped molecules could be either WT ROM-1 or Y141C-RDS (white and grey) or WT RDS or ROM-1 (black and white). Complexes that appear abnormal by non-reducing SDS–PAGE are underlined.
Although we did not detect accumulation of RDS in the inner segment, large protein complexes can be associated with aggregation and often lead to endoplasmic reticulum (ER) stress. However, we conducted electron microscopy examination of the inner segment (the site of protein synthesis) and observed no apparent swelling of the ER in any genotype (Supplementary Material, Fig. S3A). Similarly, we observed no significant increase in the mRNA levels of several ER stress markers in any genotype tested (Supplementary Material, Fig. S3B) nor any signs of activation of the ER stress marker XBP1 (Supplementary Material, Fig. S3C). Given that the vast majority of Y141C-RDS is found in abnormal large molecular weight complexes in the rdsY/Y retina, these data coupled with our immunolocalization data support a model in which the abnormal complexes are present in the OS even in the absence of WT RDS.
Y141C protein can initiate OS formation but not proper disc growth
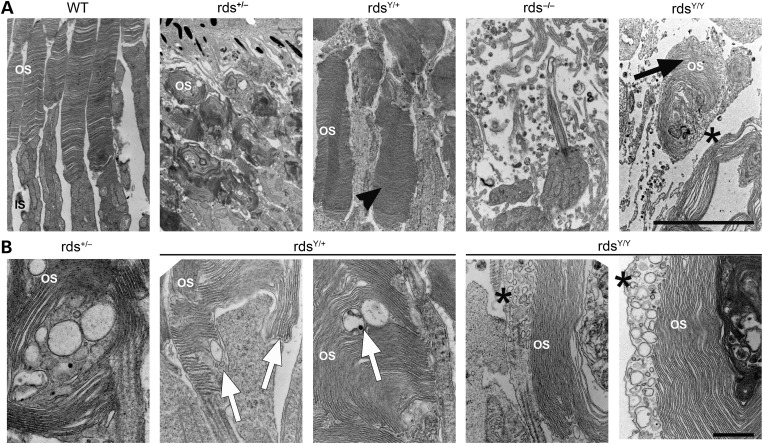
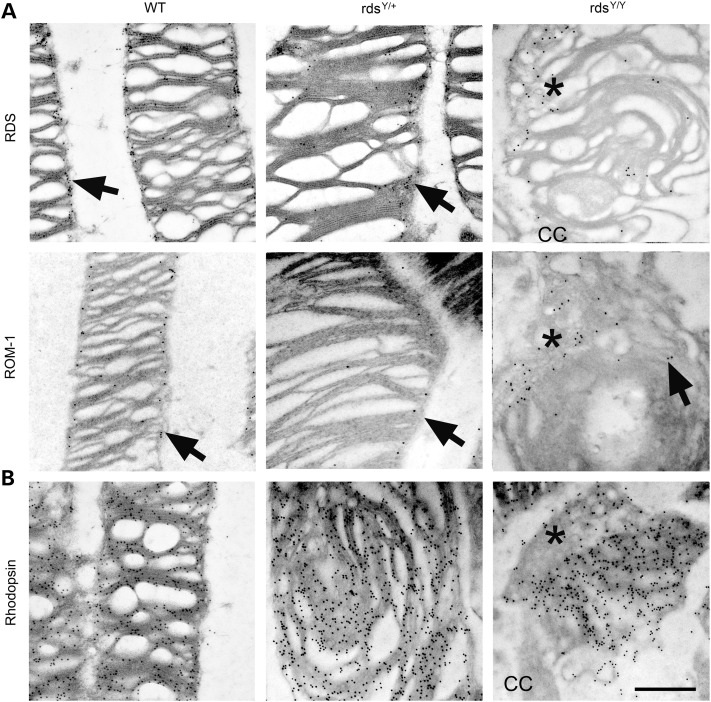
Given the presence of abnormal Y141C complexes in the OS, we were encouraged to more closely examine OS ultrastructure at P30. Interestingly, although we showed OS length was not improved in the rdsY/+ versus rds+/−, OSs in the rdsY/+ exhibited better disc sizing, stacking and alignment (Fig. 9A, arrowheads; Supplementary Material, Fig. S4) than the rds+/− which is characterized by highly abnormal membrane swirls in the OS. Although many rdsY/+ OSs exhibited abnormalities including some lengthening of discs, and accumulation of vesicular structures (white arrows, Fig. 8B; Supplementary Material, Fig. S4), ultrastructure in other cells was virtually normal (black arrows, Supplementary Material, Fig. S4). In contrast to the rds−/− which forms no OSs, the rdsY/Y made attempts at OS formation; however, the structures were quite small compared with WT or heterozygous (rds+/− or rdsY/+) animals. OSs in the rdsY/Y did not exhibit normal discs/lamellae; however, they did have flattened, whorl shaped membranes (Fig. 9A, arrows). Images captured at higher magnification from the rdsY/+ and rdsY/Y revealed abnormal disc sizing (white arrow, Fig. 9B) and misorientation of OS discs in relation to each other and the axoneme/connecting cilium. Interestingly, many abnormal vesicular structures line up adjacent to the flattened discs in the rdsY/Y (Fig. 9A and B, asterisks). These vesicles are quite rare when WT RDS is present (rds+/− or rdsY/+), suggesting that they may be aborted attempts at rim formation mediated by Y141C-RDS and thus serve as reservoirs for the accumulation of abnormal RDS oligomers. To test this hypothesis, we conducted immunogold labeling at P30 (Fig. 10). In both the WT and rdsY/+, ROM-1 and RDS are restricted to the rim region (Fig. 10A, arrows) while rhodopsin is found throughout the discs (Fig. 10B). Critically, in the rdsY/Y, RDS and ROM-1 localize primarily to the abnormal vesicles seen in Figure 8B (Fig. 10A, asterisks), although they are also seen at the edges of the flattened membranes, while rhodopsin is mostly excluded from the vesicular structures and is most heavily concentrated in the lamellae of the nearby swirls of membrane (Fig. 10B, arrowheads). These data suggest that while Y141C-RDS and ROM-1 traffic to the OS in the rdsY/Y, both accumulate in abnormal vesicular structures rather than supporting normal disc formation.
Figure 9.
The Y141C-RDS protein is unable to support normal OS ultrastructure. Transmission electron microscopy was performed on eyes from the indicated genotypes at P30 (A and B). Y141C-RDS-expressing photoreceptors appear to have a significant improvement in overall OS structure (arrowhead) when compared with appropriate rds+/− controls, while rdsY/Y exhibits only small highly malformed OSs (arrow). Higher magnification images reveal that despite increases in overall organization, Y141C-RDS-expressing retinas still are characterized by OS discs which lack proper orientation and sizing (B). Interestingly, in the rdsY/Y a large number of abnormal membranous vesicular structures appear to surround the flattened discs (A and B, asterisks). OS, outer segments; IS, inner segments. Scale bars: 5 µm in (A) and 500 nm in (B). N = 3 eyes/genotype.
Figure 10.
Y141C-RDS and ROM-1 accumulate in a distinct region from rhodopsin. Retinal thin sections collected at P30 from the indicated genotypes were IG labeled with antibodies for RDS (A), ROM-1 (B) and rhodopsin (C) and secondary antibodies conjugated to 10 nm gold particles. Both ROM-1 and RDS localize properly to the rim regions of OS discs in the WT, rdsY/+ and the rdsY/Y(arrows). In the rdsY/Y, the abnormal membranous vesicles are enriched for RDS and ROM-1 and contain relatively less rhodopsin labeling (asterisks). CC, connecting cilium. Scale bar: 500 nm.
DISCUSSION
Our data provide an exciting new interpretation for the disease processes for RDS-associated pattern dystrophy. Previously, a fairly simplistic interpretation of RDS disease-causing mutations had prevailed: namely that retinitis pigmentosa was caused by loss-of-function mutations that lead to protein degradation and preferentially affected rods, while macular diseases were caused by gain-of-function mutations that preferentially affected cones. This was supported by studies using C214S (retinitis pigmentosa) (9) and R172W (macular dystrophy) (11) transgenic mice, in which rod-dominant or cone-dominant degeneration were observed. However, this interpretation left no way to account for the vast inter- and intrafamilial variability in phenotypes associated with some mutations such as Y141C nor an explanation for the development of secondary phenotypes such as RPE and choroidal defects. Our data suggest a third, more complex, disease mechanism which may apply to many different RDS mutations. Several pieces of evidence shown here suggest that the Y141C allele has some loss-of-function characteristics (e.g. similar, levels of degeneration and OS length in rds+/− and rdsY/+), whereas others suggest that there are also gain-of-function effects of the allele (e.g. fundus phenotype in rdsY/+ but not rds+/−, scotopic b-wave function in rdsY/Y but not rds−/−, the presence of normal RDS protein levels but abnormal oligomers in the rdsY/+ OSs and the accumulation of abnormal vesicular structures in the rdsY/Y retina). Based on these observations, we postulate that the abnormal Y141C oligomers cannot support proper OS structure and function, leading to primary defects in photoreceptors (i.e. similar phenotype to rds+/−). However, since the altered complexes are stable and found in the OS (as opposed to being degraded in the inner segment as is the case with other retinitis pigmentosa mutations) (9), they can induce secondary toxicity in the RPE and neighboring tissue. In patients, this would result in macular vision loss and macular fundus changes characteristic of RPE loss (pattern dystrophy, etc.) simply due to the unique demands on the RPE in the macula (28). The Y141C mouse sheds light on phenotypic heterogeneity in patients because it recapitulates many of the different phenotypes observed (e.g. photoreceptor structural defects, cone and rod ERG changes, fundus flecking, etc.) and links them to changes in the molecular structure of RDS complexes. Subtle changes in the content, stability or quaternary structure of the abnormal complexes from mutation to mutation could set a baseline level of RDS-related stress which acts in conjunction with variability in other non-genetic lifestyle factors to explain the vast phenotypic variability among RDS patients.
There is precedence for the hypothesis that photoreceptor defects can lead to secondary RPE toxicity; the most common example is ABCA4-associated Stargardt's macular dystrophy wherein abnormal accumulation of retinoids in the photoreceptor leads to RPE toxicity and subsequent macular dystrophy (28, 29). Although mice do not have a macula and it has therefore historically been difficult to model macular dystrophies, we here show that the Y141C knockin line exhibits late-onset fundus abnormalities, suggesting that it may be a good model for the assessment of the interplay between these tissues. Yellowish flecking on the fundus has been attributed to defects in the RPE, accumulation of lipofuscin in the RPE, and defects in the choroidal vasculature (13, 26, 30). Since it is unclear how the expression of abnormal RDS/ROM-1 complexes will impact the long-term health of the retina and neighboring RPE, we look forward to conducting long-term studies to determine whether Y141C knockin animals develop observable phenotypes in the RPE tissues (such as abnormal accumulation of lipofuscin) and what factors regulate these effects.
One of our most interesting findings is that the presence of Y141C-RDS protein results in the formation of abnormal disulfide-linked complexes that include RDS as well as ROM-1, which is not normally engaged in disulfide bonds with RDS (31, 32). While we have seen large non-specific aggregates form in the case of other RDS mutations such as C214S (9), the complexes we observe here are distinct. C214S RDS cannot traffic to the OS and is thought to aggregate in the ER through a failure to fold normally. In contrast, the Y141C mutation traffics to the OS and the lack of any observable ER stress would suggest that no RDS builds up in the ER. The high-molecular-weight of these complexes and the fact that they are reduced to monomers in the presence of DTT suggest that the complexes are held together by additional intermolecular disulfide bonds between Y141C-RDS and itself or neighboring WT RDS (i.e. C141 with a neighboring C150) or ROM-1 (C141 of RDS with C153 of ROM-1). The additional intermolecular bond may form directly via the newly introduced cysteine (Y141C), but it is also possible that the loss of a tyrosine 141 destabilizes the D2 loop enough to allow other D2 cysteines to engage in abnormal intermolecular interactions. Regardless, the presence of ROM-1 within these high-molecular-weight complexes demonstrates that these complexes are fundamentally altered. The role of ROM-1 in normal RDS complexes likely primarily rests in its ability to subtly regulate disc size which is defective in both the ROM-1 knockout (33) and the Y141C knockin photoreceptors. Abnormal inclusion of ROM-1 in disulfide-linked complexes in Y141C retina may impair its function.
Our ultrastructural studies also shed light on the role of RDS oligomers in OS formation. We have hypothesized that rim formation is the initiating step in OS biogenesis and disc elaboration due to the absence of rims and nascent discs in the rds−/−. Normal disulfide-linked RDS oligomers are responsible for maintaining the pinched rim structure (18, 34); however, a clear role for RDS and ROM-1 homo- and heterotetramers has not been established. It is possible that these two pools of RDS (oligomers and tetramers) may have different roles, e.g. structural support of the rim region versus functional organization of a membrane microdomain. In the rdsY/Y model, we observe the accumulation of abnormal RDS/ROM-1-containing vesicular structures which carry little or no rhodopsin, as well as some flattened rhodopsin-containing OS material with RDS/ROM-1 at its edges. We hypothesize that the abnormal high-molecular-weight complexes which comprise the majority of the RDS in the Y141C model cannot support normal rim formation, and thus the complexes accumulate in the large vesicular structures. However, some tetramers are still present in the rdsY/Y, and it is possible that these tetramers may participate in the observed initiated disc formation (thus the appearance of flattened membranes with RDS/ROM-1 at the edges). Confirmation of this hypothesis has been difficult to biochemically test directly; however, it is clear that Y141C protein can initiate disc/rim formation (since absolutely no discs are formed in the rds−/−) but not support proper maturation or maintenance of discs. Previous studies suggest that the C-terminus of RDS is a likely candidate for the region of the protein that promotes the initiation of the discs as it contains both the OS trafficking signal and an important amphipathic helix which aids in membrane curvature and fusion (35–38).
The current work points to two important issues that will be the focus of future studies. The first is a need to analyze the effects of specific mutations on the quaternary oligomerization of RDS to determine if a pattern can be found linking specific complexes with specific disease phenotypes. It is possible that disease mutations which seem unrelated at a primary or secondary or even tertiary protein level could have a similar effect on the RDS quaternary complexes and thus result in similar disease phenotypes. Collectively, data from this and some of our other models (39) suggest that different variations in higher-order oligomer structure can occur from mutation to mutation and in rods versus cones (17). In keeping with this, it will also be necessary to further analyze whether mutations have different effects on RDS quaternary structure in rods versus cones in order to determine if these changes underlie some of the cell-type-specific nature of the disease phenotype. Second, work needs to be done to determine which of these disease phenotypes can be treated effectively with methods such as gene delivery, a promising treatment for RDS-related disease, or if some phenotypes or mutations will need additional treatments to neutralize abnormal quaternary structures that could have a detrimental gain-of-function effect on the photoreceptors or adjacent tissues (40).
MATERIALS AND METHODS
Animals
All experimental procedures, maintenance and handling followed protocols approved by the University of Oklahoma's Institutional Animal Care and Use Committee, and the guidelines set by the Association for Research in Vision and Ophthalmology. Y141C-RDS knockin mice were generated by inGenious Targeting Laboratory, Inc. (Ronkonkoma, NY, USA). A 10.14 kb region of genomic DNA was isolated from a positively identified bacterial artificial chromosome (BAC) clone and used to construct the targeting vector. The long homology arm extended ∼6.9 kb 5′ from the site of the mutation in exon 1 of the RDS gene. A LoxP/FRT-neomycin selection cassette was inserted 383 bp downstream of exon 1 (in RDS' large first intron). The short homology arm extended 2.7 kb 3′ of the end of the Neo cassette. Two point mutations were introduced into exon 1 using PCR: (i) a silent CTC>CTG, to eliminate a Hinf1 restriction site to aid in genotyping, and (ii) the pathogenic TAT>TGT, to introduce the Y141C mutation. The BAC was sub cloned into a 2.45 kb pSP72 (Promega, Madison, WI, USA) backbone vector and linearized with Not1 prior to electroporation into embryonic stem (ES) cells. The final targeting construct was 14.3 kb. Following electroporation, ES cells were screened for the presence of the desired allele and positive clones were injected into C57BL/6 blastocysts and implanted (five positive clones were identified and recommended for injection, the final line in use came from clone 272). Subsequent chimeric founders were bred to identify mice with germline transmission, then bred to FLPeR expressing mice (Stock#003946, Jackson Labs, Bar Harbor, ME, USA) to remove the Neo cassette. PCR genotyping confirmed that these mice do not carry the rd8 mutation. The rds−/− mice were bred from founders generously provided by Dr Neeraj Agarwal (University of North Texas Health Science Center, Fort Worth, TX, USA). Animals of both genders were used and all animals were reared under cyclic lighting conditions (12 h L/D, 30 lux). All animals for the current study were postnatal day (P) 30 or P180 at the time of analysis as indicated in the results section.
Antibodies
Antibodies used are as follows. Rabbit polyclonal RDS-CT (generated in house) was used for immunofluorescence (IF) at a dilution of 1:1000 (11, 18). Mouse monoclonal RDS-2B7 (generated for us by Precision Antibodies and characterized previously) was used for WB at 1:1000 (15, 17). Rabbit polyclonal RDS-MPCT (a kind gift from Dr Andrew F. Goldberg, Oakland University) was used for immunogold (IG) at 1:200. These three antibodies are against the C-terminus of RDS and recognize both the wild-type (WT) and Y141C mutant protein. Rabbit polyclonal ROM1-CT (generated in house) was used at 1:1000 for WB (11). Mouse monoclonal ROM1-2H5 (generated in house and characterized previously) (10) was used at 1:10 for WB and 1:100 for IG. Mouse monoclonal Na+K+ATPase (Developmental Studies Hybridoma Bank, developed under the auspices of the NICHD and maintained by the University of Iowa, Department of Biology, Iowa City, IA, USA) was used for IF at a dilution of 1:500. Mouse monoclonal rhodopsin 1D4 (generously provided by Dr Robert Molday, University of British Columbia, Canada) was used for IF and WB at a dilution of 1:1000. Goat polyclonal S-ospin (H-17, Santa Cruz Biotechnology, Santa Cruz, CA, USA) was used at a dilution of 1:500 for IF. Actin was visualized using HRP-conjugated mAB against beta-actin (Sigma-Aldrich, St Louis, MO, USA) at a dilution of 1:10 000.
Immunofluorescence
Following euthanasia, eyes were enucleated, fixed with 4% paraformaldehyde, dissected and cryoprotected as described previously (17). Ten micrometer retinal cryosections were subjected to IF analysis following procedures described previously (41). Primary antibodies were used as described above. Secondary antibodies were specific to goat, rabbit or mouse and were conjugated to either Alexa-488 or Alexa-555 (Life Technologies, Grand Island, NY, USA). All sections were imaged using a Hamamatsu C-4742 camera through UPlanSApo objectives (Olympus, Tokyo, Japan) on an Olympus BX62 upright microscope equipped with a spinning disc confocal unit. Image analysis was performed using Slidebook v4 software (Intelligent Imaging Innovations, Denver, CO, USA). Experiments were repeated at least three times.
Transmission electron microscopy and IG cytochemistry
The methods used for processing of tissues for transmission EM and IG have been published previously (17, 18, 42). In brief, thin (600–800 Å) sections were collected on copper 75/300 mesh grids and stained with 2% uranyl acetate and Reynolds' lead citrate for TEM. Thin sections for IG were similarly collected on 75/300 mesh grids and probed with primary antibodies as described above. Secondary antibodies (AuroProbe 10 nm gold-conjugated goat anti-rabbit IgG or goat anti-mouse IgG, GE/Amersham, Piscataway, NJ, USA) were used at 1:50 dilution. Images were collected using a JEOL 100CX electron microscope at an accelerating voltage of 60 kV.
Electroretinography
ERG has been described in detail previously (11, 18, 42). To summarize, following dark adaptation overnight, mice were anesthetized by intramuscular injection of 85 mg/kg ketamine and 14 mg/kg xylazine (Butler Schein Animal Health, Dublin, OH, USA) and eyes were dilated using 1% cyclogyl (Pharmaceutical Systems, Inc., Tulsa, OK, USA), and full-field ERG was assessed using the UTAS system (LKC, Gaithersburg, MD, USA) with a platinum wire loop electrode in contact with the cornea through a layer of methylcellulose (Pharmaceutical Systems, Inc.). Rod photoreceptor function (scotopic) was assessed with a single strobe flash stimulus of 157 cd s/m2 presented to the dark adapted mouse. Cone photoreceptor function (photopic) was analyzed by averaging responses to 25 flashes at 157 cd s/m2 following a 5 min light adaptation with background light at an intensity of 29.03 cd/m2. Statistical analysis was performed using one-way ANOVA with Bonferroni's multi-comparison post-test.
Fundus imaging and FA
Fundus imaging and FA were performed using the Micron III system (Phoenix Research Laboratories, Pleasanton, CA, USA) as previously described (43, 44). Brightfield fundus images and fundus autofluorescence images were collected first (from anesthetized/dilated animals) and then animals were injected intraperitoneally with 100 µl of 1% (w/v) fluorescein sodium (Sigma-Aldrich). FA images were captured using an excitation and emission filters of 486 and 436 nm, respectively. All images were captured using StreamPix® software (Phoenix Research Labs).
Protein extraction and analysis
Retinas from indicated genotypes were removed and immediately frozen using liquid nitrogen and stored at −80°C prior to processing. Extracts were prepared using 150 µl of chilled (4°C) solubilization buffer (phosphate-buffered saline, pH 7.0, containing 1% Triton X-100, 5 mm ethylenediaminetetraacetic acid, 5 mg/ml NEM and a standard protease inhibitor cocktail) per retina. Samples were briefly sonicated and extracted for ∼1 h at 4°C prior to a 30 min spin at 20 000g in a refrigerated centrifuge at 4°C to remove insoluble debris. Protein concentration was assayed by using a colorimetric protein assay (Bradford reagent from Bio-Rad, Hercules, CA, USA). All extracts were kept on ice and used immediately to avoid any non-specific post-extraction aggregation. Western blots, SDS–PAGE and IP were performed as previously described (10, 18, 27). Velocity sedimentation using continuous 5–20% sucrose gradients was performed as described previously (10, 18, 27). All experiments were repeated at least three times. Blots were imaged using ChemiDoc™ MP imaging system (Bio-Rad) and densitometric analysis was performed using Image Lab software v4.1 (Bio-Rad).
RNA preparation and analysis
Total RNA was isolated from retinas as described previously (40) using TRIzol reagent (Life Technologies) and treated with RNase-free DNase I (Promega) according to the manufacturer's recommendations. Reverse transcription was performed using an oligo-dT primer and superscript III reverse transcriptase (Life Technologies). qRT-PCR was done using a real-time PCR detection system (C1000 Thermal Cycler, Bio-Rad) and was performed as previously described (42). Values were normalized to the housekeeping gene HPRT. For unfolded protein response positive controls retinas were removed and then incubation in DMEM with 10% FBS supplemented with 5 µm thapsigargin (Sigma) for 6 h. Resulting relative values were analyzed by one-way ANOVA to determine statistical significance. Primer sequences used are included in Supplementary Material, Table S1. Northern blot was performed by loading 20 µg of total RNA on 1% agarose gel containing 18% (v/v) formaldehyde. 18S and 28S ribosomal RNA were imaged prior to blotting using a ChemiDoc™ MP imaging system (Bio-Rad). RNA was blotted onto Ambian® Brightstar®-Plus (Life Technologies). The resulting membrane was hybridized with P32-labeled oligonucleotides prepared with the Amersham™ (GE Healthcare) random priming kit using a linearized PcDNA3.1 vector containing WT RDS cDNA (45). Following washes, the resulting blot was exposed to Kodak Biomax MS film using a BioMax Transcreen-LE Intensifying Screen (Carestream Health, Rochester, NY, USA).
SUPPLEMENTARY MATERIAL
FUNDING
This work was supported by the National Eye Institute (EY010609—M.I.N., T32EY023202—M.W.S. and 5P30EY021725), the Foundation Fighting Blindness (M.I.N.) and the Oklahoma Center for the Advancement of Science and Technology (M.I.N. and S.M.C.).
Supplementary Material
ACKNOWLEDGEMENTS
The authors thank Ms. Barb Nagel (St Louis University, Department of Pathology) and Mr Justin Burnett for their technical assistance.
Conflict of Interest statement. None declared.
REFERENCES
- 1.Boon C.J., den Hollander A.I., Hoyng C.B., Cremers F.P., Klevering B.J., Keunen J.E. The spectrum of retinal dystrophies caused by mutations in the peripherin/RDS gene. Prog. Retin. Eye Res. 2008;27:213–235. doi: 10.1016/j.preteyeres.2008.01.002. [DOI] [PubMed] [Google Scholar]
- 2.Khani S.C., Karoukis A.J., Young J.E., Ambasudhan R., Burch T., Stockton R., Lewis R.A., Sullivan L.S., Daiger S.P., Reichel E., et al. Late-onset autosomal dominant macular dystrophy with choroidal neovascularization and nonexudative maculopathy associated with mutation in the RDS gene. Invest. Ophthalmol. Vis. Sci. 2003;44:3570–3577. doi: 10.1167/iovs.02-1287. [DOI] [PMC free article] [PubMed] [Google Scholar]
- 3.Yang Z., Li Y., Jiang L., Karan G., Moshfeghi D., O'Connor S., Li X., Yu Z., Lewis H., Zack D., et al. A novel RDS/peripherin gene mutation associated with diverse macular phenotypes. Ophthalmic Genet. 2004;25:133–145. doi: 10.1080/13816810490514388. [DOI] [PubMed] [Google Scholar]
- 4.Conley S.M., Stuck M.W., Naash M.I. Structural and functional relationships between photoreceptor tetraspanins and other superfamily members. Cell. Mol. Life Sci. 2012;69:1035–1047. doi: 10.1007/s00018-011-0736-0. [DOI] [PMC free article] [PubMed] [Google Scholar]
- 5.Goldberg A.F. Role of peripherin/rds in vertebrate photoreceptor architecture and inherited retinal degenerations. Int. Rev. Cytol. 2006;253:131–175. doi: 10.1016/S0074-7696(06)53004-9. [DOI] [PubMed] [Google Scholar]
- 6.Elliott M.H., Nash Z.A., Takemori N., Fliesler S.J., McClellan M.E., Naash M.I. Differential distribution of proteins and lipids in detergent-resistant and detergent-soluble domains in rod outer segment plasma membranes and disks. J. Neurochem. 2008;104:336–352. doi: 10.1111/j.1471-4159.2007.04971.x. [DOI] [PMC free article] [PubMed] [Google Scholar]
- 7.Cheng T., Peachey N.S., Li S., Goto Y., Cao Y., Naash M.I. The effect of peripherin/rds haploinsufficiency on rod and cone photoreceptors. J. Neurosci. 1997;17:8118–8128. doi: 10.1523/JNEUROSCI.17-21-08118.1997. [DOI] [PMC free article] [PubMed] [Google Scholar]
- 8.Saga M., Mashima Y., Akeo K., Oguchi Y., Kudoh J., Shimizu N. A novel Cys-214-Ser mutation in the peripherin/RDS gene in a Japanese family with autosomal dominant retinitis pigmentosa. Hum. Genet. 1993;92:519–521. doi: 10.1007/BF00216463. [DOI] [PubMed] [Google Scholar]
- 9.Stricker H.M., Ding X.Q., Quiambao A., Fliesler S.J., Naash M.I. The Cys214→Ser mutation in peripherin/rds causes a loss-of-function phenotype in transgenic mice. Biochem. J. 2005;388:605–613. doi: 10.1042/BJ20041960. [DOI] [PMC free article] [PubMed] [Google Scholar]
- 10.Conley S.M., Stuck M.W., Burnett J.L., Chakraborty D., Azadi S., Fliesler S.J., Naash M.I. Insights into the mechanisms of macular degeneration associated with the R172W mutation in RDS. Hum. Mol. Genet. 2014;23:3102–3114. doi: 10.1093/hmg/ddu014. [DOI] [PMC free article] [PubMed] [Google Scholar]
- 11.Ding X.Q., Nour M., Ritter L.M., Goldberg A.F., Fliesler S.J., Naash M.I. The R172W mutation in peripherin/rds causes a cone-rod dystrophy in transgenic mice. Hum. Mol. Genet. 2004;13:2075–2087. doi: 10.1093/hmg/ddh211. [DOI] [PubMed] [Google Scholar]
- 12.Piguet B., Heon E., Munier F.L., Grounauer P.A., Niemeyer G., Butler N., Schorderet D.F., Sheffield V.C., Stone E.M. Full characterization of the maculopathy associated with an Arg-172-Trp mutation in the RDS/peripherin gene. Ophthalmic Genet. 1996;17:175–186. doi: 10.3109/13816819609057891. [DOI] [PubMed] [Google Scholar]
- 13.Francis P.J., Schultz D.W., Gregory A.M., Schain M.B., Barra R., Majewski J., Ott J., Acott T., Weleber R.G., Klein M.L. Genetic and phenotypic heterogeneity in pattern dystrophy. Br. J. Ophthalmol. 2005;89:1115–1119. doi: 10.1136/bjo.2004.062695. [DOI] [PMC free article] [PubMed] [Google Scholar]
- 14.Vaclavik V., Tran H.V., Gaillard M.C., Schorderet D.F., Munier F.L. Pattern dystrophy with high intrafamilial variability associated with Y141C mutation in the peripherin/RDS gene and successful treatment of subfoveal CNV related to multifocal pattern type with anti-VEGF (ranibizumab) intravitreal injections. Retina. 2012;32:1942–1949. doi: 10.1097/IAE.0b013e31824b32e4. [DOI] [PubMed] [Google Scholar]
- 15.Conley S.M., Stricker H.M., Naash M.I. Biochemical analysis of phenotypic diversity associated with mutations in codon 244 of the retinal degeneration slow gene. Biochemistry (Mosc). 2010;49:905–911. doi: 10.1021/bi901622w. [DOI] [PMC free article] [PubMed] [Google Scholar]
- 16.Moshfeghi D.M., Yang Z., Faulkner N.D., Karan G., Thirumalaichary S., Pearson E., Zhao Y., Tsai T., Zhang K. Choroidal neovascularization in patients with adult-onset foveomacular dystrophy caused by mutations in the RDS/peripherin gene. Adv. Exp. Med. Biol. 2006;572:35–40. doi: 10.1007/0-387-32442-9_6. [DOI] [PubMed] [Google Scholar]
- 17.Chakraborty D., Conley S.M., Stuck M.W., Naash M.I. Differences in RDS trafficking, assembly and function in cones versus rods: insights from studies of C150S-RDS. Hum. Mol. Genet. 2010;19:4799–4812. doi: 10.1093/hmg/ddq410. [DOI] [PMC free article] [PubMed] [Google Scholar]
- 18.Chakraborty D., Ding X.Q., Conley S.M., Fliesler S.J., Naash M.I. Differential requirements for retinal degeneration slow intermolecular disulfide-linked oligomerization in rods versus cones. Hum. Mol. Genet. 2009;18:797–808. doi: 10.1093/hmg/ddn406. [DOI] [PMC free article] [PubMed] [Google Scholar]
- 19.Goldberg A.F., Moritz O.L., Molday R.S. Heterologous expression of photoreceptor peripherin/rds and Rom-1 in COS-1 cells: assembly, interactions, and localization of multisubunit complexes. Biochemistry (Mosc) 1995;34:14213–14219. doi: 10.1021/bi00043a028. [DOI] [PubMed] [Google Scholar]
- 20.Goldberg A.F., Molday R.S. Subunit composition of the peripherin/rds-rom-1 disk rim complex from rod photoreceptors: hydrodynamic evidence for a tetrameric quaternary structure. Biochemistry (Mosc) 1996;35:6144–6149. doi: 10.1021/bi960259n. [DOI] [PubMed] [Google Scholar]
- 21.Goldberg A.F., Loewen C.J., Molday R.S. Cysteine residues of photoreceptor peripherin/rds: role in subunit assembly and autosomal dominant retinitis pigmentosa. Biochemistry (Mosc) 1998;37:680–685. doi: 10.1021/bi972036i. [DOI] [PubMed] [Google Scholar]
- 22.Ding X.Q., Stricker H.M., Naash M.I. Role of the second intradiscal loop of peripherin/rds in homo and hetero associations. Biochemistry (Mosc) 2005;44:4897–4904. doi: 10.1021/bi048414i. [DOI] [PMC free article] [PubMed] [Google Scholar]
- 23.Trujillo M.J., Martinez-Gimeno M., Gimenez A., Lorda I., Bueno J., Garcia-Sandoval B., Ramos C., Carballo M., Ayuso C. Two novel mutations (Y141H; C214Y) and previously published mutation (R142W) in the RDS-peripherin gene in autosomal dominant macular dystrophies in Spanish families. Hum. Mutat. 2001;17:80. doi: 10.1002/1098-1004(2001)17:1<80::AID-HUMU27>3.0.CO;2-G. [DOI] [PubMed] [Google Scholar]
- 24.Souied E.H., Rozet J.M., Gerber S., Dufier J.L., Soubrane G., Coscas G., Munnich A., Kaplan J. Two novel missense mutations in the peripherin/RDS gene in two unrelated French patients with autosomal dominant retinitis pigmentosa. Eur. J. Ophthalmol. 1998;8:98–101. doi: 10.1177/112067219800800208. [DOI] [PubMed] [Google Scholar]
- 25.Zhang K., Garibaldi D.C., Li Y., Green W.R., Zack D.J. Butterfly-shaped pattern dystrophy: a genetic, clinical, and histopathological report. Arch. Ophthalmol. 2002;120:485–490. doi: 10.1001/archopht.120.4.485. [DOI] [PubMed] [Google Scholar]
- 26.Jones A., Kumar S., Zhang N., Tong Z., Yang J.H., Watt C., Anderson J., Amrita ., Fillerup H., McCloskey M., et al. Increased expression of multifunctional serine protease, HTRA1, in retinal pigment epithelium induces polypoidal choroidal vasculopathy in mice. Proc. Natl. Acad. Sci. USA. 2011;108:14578–14583. doi: 10.1073/pnas.1102853108. [DOI] [PMC free article] [PubMed] [Google Scholar]
- 27.Chakraborty D., Ding X.Q., Fliesler S.J., Naash M.I. Outer segment oligomerization of Rds: evidence from mouse models and subcellular fractionation. Biochemistry (Mosc) 2008;47:1144–1156. doi: 10.1021/bi701807c. [DOI] [PMC free article] [PubMed] [Google Scholar]
- 28.Strauss O. The retinal pigment epithelium in visual function. Physiol. Rev. 2005;85:845–881. doi: 10.1152/physrev.00021.2004. [DOI] [PubMed] [Google Scholar]
- 29.Weng J., Mata N.L., Azarian S.M., Tzekov R.T., Birch D.G., Travis G.H. Insights into the function of Rim protein in photoreceptors and etiology of Stargardt's disease from the phenotype in abcr knockout mice. Cell. 1999;98:13–23. doi: 10.1016/S0092-8674(00)80602-9. [DOI] [PubMed] [Google Scholar]
- 30.Conley S.M., Cai X., Makkia R., Wu Y., Sparrow J.R., Naash M.I. Increased cone sensitivity to ABCA4 deficiency provides insight into macular vision loss in Stargardt's dystrophy. Biochim. Biophys. Acta. 2012;1822:1169–1179. doi: 10.1016/j.bbadis.2011.10.007. [DOI] [PMC free article] [PubMed] [Google Scholar]
- 31.Bascom R.A., Manara S., Collins L., Molday R.S., Kalnins V.I., McInnes R.R. Cloning of the cDNA for a novel photoreceptor membrane protein (rom-1) identifies a disk rim protein family implicated in human retinopathies. Neuron. 1992;8:1171–1184. doi: 10.1016/0896-6273(92)90137-3. [DOI] [PubMed] [Google Scholar]
- 32.Kedzierski W., Bok D., Travis G.H. Transgenic analysis of rds/peripherin N-glycosylation: effect on dimerization, interaction with rom1, and rescue of the rds null phenotype. J. Neurochem. 1999;72:430–438. doi: 10.1046/j.1471-4159.1999.0720430.x. [DOI] [PubMed] [Google Scholar]
- 33.Clarke G., Goldberg A.F., Vidgen D., Collins L., Ploder L., Schwarz L., Molday L.L., Rossant J., Szel A., Molday R.S., et al. Rom-1 is required for rod photoreceptor viability and the regulation of disk morphogenesis. Nat. Genet. 2000;25:67–73. doi: 10.1038/75621. [DOI] [PubMed] [Google Scholar]
- 34.Wrigley J.D., Ahmed T., Nevett C.L., Findlay J.B. Peripherin/rds influences membrane vesicle morphology. Implications for retinopathies. J. Biol. Chem. 2000;275:13191–13194. doi: 10.1074/jbc.c900853199. [DOI] [PubMed] [Google Scholar]
- 35.Khattree N., Ritter L.M., Goldberg A.F. Membrane curvature generation by a C-terminal amphipathic helix in peripherin-2/rds, a tetraspanin required for photoreceptor sensory cilium morphogenesis. J Cell Sci. 2013;126:4659–4670. doi: 10.1242/jcs.126888. [DOI] [PMC free article] [PubMed] [Google Scholar]
- 36.Salinas R.Y., Baker S.A., Gospe S.M., III, Arshavsky V.Y. A single valine residue plays an essential role in peripherin/rds targeting to photoreceptor outer segments. PLoS ONE. 2013;8:e54292. doi: 10.1371/journal.pone.0054292. [DOI] [PMC free article] [PubMed] [Google Scholar]
- 37.Tam B.M., Moritz O.L., Papermaster D.S. The C terminus of peripherin/rds participates in rod outer segment targeting and alignment of disk incisures. Mol. Biol. Cell. 2004;15:2027–2037. doi: 10.1091/mbc.E03-09-0650. [DOI] [PMC free article] [PubMed] [Google Scholar]
- 38.Kevany B.M., Tsybovsky Y., Campuzano I.D., Schnier P.D., Engel A., Palczewski K. Structural and functional analysis of the native peripherin/ROM1 complex isolated from photoreceptor cells. J. Biol. Chem. 2013;288:36272–36284. doi: 10.1074/jbc.M113.520700. [DOI] [PMC free article] [PubMed] [Google Scholar]
- 39.Conley S.M., Stuck M.W., Burnett J.L., Chakraborty D., Azadi S., Fliesler S.J., Naash M.I. Insights into the mechanisms of macular degeneration associated with the R172W mutation in RDS. Hum. Mol. Genet. 2014;23:3102–3114. doi: 10.1093/hmg/ddu014. [DOI] [PMC free article] [PubMed] [Google Scholar]
- 40.Cai X., Nash Z., Conley S.M., Fliesler S.J., Cooper M.J., Naash M.I. A partial structural and functional rescue of a retinitis pigmentosa model with compacted DNA nanoparticles. PLoS ONE. 2009;4:e5290. doi: 10.1371/journal.pone.0005290. [DOI] [PMC free article] [PubMed] [Google Scholar]
- 41.Stuck M.W., Conley S.M., Naash M.I. Defects in the outer limiting membrane are associated with rosette development in the Nrl retina. PLoS ONE. 2012;7:e32484. doi: 10.1371/journal.pone.0032484. [DOI] [PMC free article] [PubMed] [Google Scholar]
- 42.Farjo R., Skaggs J.S., Nagel B.A., Quiambao A.B., Nash Z.A., Fliesler S.J., Naash M.I. Retention of function without normal disc morphogenesis occurs in cone but not rod photoreceptors. J. Cell Biol. 2006;173:59–68. doi: 10.1083/jcb.200509036. [DOI] [PMC free article] [PubMed] [Google Scholar]
- 43.Koirala A., Makkia R.S., Conley S.M., Cooper M.J., Naash M.I. S/MAR-containing DNA nanoparticles promote persistent RPE gene expression and improvement in RPE65-associated LCA. Hum. Mol. Genet. 2013;22:1632–1642. doi: 10.1093/hmg/ddt013. [DOI] [PMC free article] [PubMed] [Google Scholar]
- 44.Han Z., Guo J., Conley S.M., Naash M.I. Retinal angiogenesis in the Ins2Akita mouse model of diabetic retinopathy. Invest. Ophthalmol. Vis. Sci. 2013;54:574–584. doi: 10.1167/iovs.12-10959. [DOI] [PMC free article] [PubMed] [Google Scholar]
- 45.Cheng T., al Ubaidi M.R., Naash M.I. Structural and developmental analysis of the mouse peripherin/rds gene. Somat. Cell Mol. Genet. 1997;23:165–183. doi: 10.1007/BF02721369. [DOI] [PubMed] [Google Scholar]
Associated Data
This section collects any data citations, data availability statements, or supplementary materials included in this article.


