

Abstract
Microphthalmia-associated transcription factor (MITF) is a master regulator of pigmented cell survival and differentiation with direct transcriptional links to cell cycle, apoptosis and pigmentation. In mouse, Mitf is expressed early and uniformly in optic vesicle (OV) cells as they evaginate from the developing neural tube, and null Mitf mutations result in microphthalmia and pigmentation defects. However, homozygous mutations in MITF have not been identified in humans; therefore, little is known about its role in human retinogenesis. We used a human embryonic stem cell (hESC) model that recapitulates numerous aspects of retinal development, including OV specification and formation of retinal pigment epithelium (RPE) and neural retina progenitor cells (NRPCs), to investigate the earliest roles of MITF. During hESC differentiation toward a retinal lineage, a subset of MITF isoforms was expressed in a sequence and tissue distribution similar to that observed in mice. In addition, we found that promoters for the MITF-A, -D and -H isoforms were directly targeted by Visual Systems Homeobox 2 (VSX2), a transcription factor involved in patterning the OV toward a NRPC fate. We then manipulated MITF RNA and protein levels at early developmental stages and observed decreased expression of eye field transcription factors, reduced early OV cell proliferation and disrupted RPE maturation. This work provides a foundation for investigating MITF and other highly complex, multi-purposed transcription factors in a dynamic human developmental model system.
INTRODUCTION
Vertebrate eye morphogenesis is comprised of a series of temporally and spatially defined events controlled by extrinsic cues, intrinsic factors and signaling networks. Early on, a cohort of transcription factors including Pax6 and Otx2 contribute to the specification of the eye field (EF) from the anterior neuroepithelium (AN) of the developing neural plate. Shortly thereafter, evagination of the optic vesicles (OVs) from the anterior neural tube provides the first clear morphological indication of the future retina. At this stage, the OV is unpatterned and can adopt either a retinal pigment epithelium (RPE), neural retina or optic stalk fate (1–3).
In the mouse, primitive OV cells uniformly express microphthalmia-associated transcription factor (Mitf), a basic helix–loop–helix leucine zipper protein predominantly known for its role in the survival and differentiation of pigmented cells (4–10). Multipotent Mitf+ OV cells, which are unpigmented, respond to multiple intrinsic and extrinsic factors that guide their developmental trajectory, but the function of Mitf in these cells is largely unknown. Evidence from mouse and chick has shown that upregulation of Visual systems homeobox 2 (Vsx2) in the distal OV coincides with a decrease in Mitf expression and establishment of the neural retina domain (4,11–14). In contrast, the dorsal region of the OV retains Mitf expression and develops into RPE in response to local signaling cues (15–18). The ventral region of the OV also responds to morphogen gradients, resulting in loss of Mitf expression and formation of the optic stalk (19,20).
While the role of Mitf in the unpigmented primitive OV remains unclear, in pigmented cells it is known to target genes that promote differentiation, survival, proliferation and melanogenesis. The majority of published data on MITF-mediated gene regulation comes from studies on melanocytes and melanoma (21–25); however, similar classes of gene targets have been identified in RPE (26–29). Highlighting its role in promoting RPE differentiation, ectopic Mitf expression in quail neural retina prompted conversion to RPE, whereas siRNA-mediated knockdown of Mitf in chick RPE triggered loss of pigmentation and upregulation of neural retina markers (30,31). Similarly, Mitf−/− null mutations in mouse resulted in abnormal proliferation and lack of pigmentation in RPE, partial conversion of dorsal RPE to neural retina, and microphthalmia (small eyes) (4,32,33). However, despite being essential for maintenance and maturation of RPE, Mitf does not appear to be required for RPE specification in mouse, zebrafish or chick (34–36).
Given its diverse influences during retinal and pigmented cell development, it is perhaps not surprising that the Mitf/MITF gene locus is highly complex, generating multiple isoforms via alternate promoter usage and splicing, many of which show tissue-specific expression (37–45). Eight human promoters have been identified that drive transcription of a distinct lead exon that splices into common downstream exons coding for the DNA binding and protein interaction domains (40–43). No information is available on MITF isoform expression during human retinogenesis. However, several isoforms were shown to be differentially expressed in developing mouse retina over time, with RT-PCR analysis demonstrating the presence of four in particular: Mitf-A, -D, -J and -H (39). Mitf-A and -J were expressed at low levels in both neural retina and RPE, while Mitf-H and -D were expressed in neural retina and RPE at early time points but subsequently became restricted to RPE. From a gene regulatory standpoint, Vsx2 was shown in mouse to directly interact with the Mitf-H and -D promoters, which coincided with the downregulation of these isoforms (39). Furthermore, mouse mutant analysis showed that Vsx2 and Mitf are essential for OV patterning and their interaction leads to the stabilization of the boundary between the developing RPE and neural retina domains (4,11,12).
Very little is known about the expression profile and role of MITF during early human eye development, largely because OV patterning occurs within the first 3 weeks post-fertilization when donor tissue is difficult to obtain for study. Information from human patients with MITF mutations is limited as well. Heterozygous MITF mutations leading to hypopigmentation and deafness syndromes (Waardenburg and Tietz syndromes) (9) have been described, but have no demonstrable ocular phenotype. Homozygous MITF−/− mutations are not known to exist, and attempts to extrapolate Mitf −/− animal model findings to humans are potentially complicated by species-specific gene expression (4,15,45).
Recently, the potential to study early human retinal cell fate decisions in vitro has become possible through the use of pluripotent stem cell differentiation protocols that recapitulate the molecular and cellular hallmarks of retinogenesis (46–50). Here, we have taken advantage of this methodology to investigate the spatial and temporal expression of human MITF and MITF isoforms in human embryonic stem cells (hESCs) at the earliest stages of retinal differentiation. In addition, we examined interactions between VSX2 and the MITF gene locus, which revealed a conserved mechanism for regulating neural retina and RPE fate determination in hESCs. We then manipulated MITF protein levels both by shRNA-mediated knockdown and through generation of a null MITF−/− hESC line to further investigate its function during human retinal differentiation. We confirmed the requirement of MITF for normal RPE development and identified a novel role for MITF in OV proliferation prior to the neural retina versus RPE cell fate decision.
RESULTS
hESCs undergoing retinal differentiation demonstrate conserved patterns of MITF expression
We employed our stepwise, three-dimensional retinal differentiation protocol to generate OV, RPE, and neural retina cells from WA09 hESCs in a time frame consistent with human development (Supplementary Material, Fig. S1) (46–48). This protocol relies upon endogenous signaling and cell–cell interactions to prompt retinal neurogenesis and self-assembly of rudimentary retinal structures (48). We focused initially on the expression of MITF in early presumptive OV cells as they differentiated from the primitive anterior neuroectoderm/eye field (AN/EF) (Fig. 1). By day 10 (d10) of differentiation, over 90% of cells adopted a PAX6+/OTX2+ AN/EF fate (data not shown), which precedes the formation of both the forebrain and retina (46,51). After an additional 2–3 days in culture, MITF was detected in clusters within this cell population (Fig. 1A and B). By d14–15, a subset of the MITF+ cells co-expressed VSX2 (Fig. 1C). By d20, VSX2 and MITF expression became mutually exclusive (Fig. 1D–D″ show high magnification views of the transition zone between VSX2- and MITF-positive cell populations), resulting in spherical mounds of VSX2+/MITF− cells surrounded by flat skirts of VSX2−/MITF+ cells (Fig. 1E). Highly enriched neural retinal progenitor cell (NRPC) cultures were generated by lifting the VSX2+ central mounds and isolating the resulting phase bright OV-like structures (Fig. 1F) as previously described (47,48,50). This process left behind the surrounding cell skirts, which formed progressively pigmented monolayers with characteristic RPE morphology by d40 (Fig. 1G–I). The RPE cells uniformly expressed MITF, as well as the tight junction protein ZO-1 (Fig. 1J). Thus, MITF serves as the earliest known specific marker for OV cells in hESCs, in addition to being a subsequent indicator for developing RPE.
Figure 1.

Expression of MITF during early retinal differentiation in hESCs. (A) Immunocytochemistry (ICC) for PAX6 (red) and MITF (green) in adherent hESC cultures differentiated for 13 days. The open and closed arrows mark representative PAX6+/MITF+ and PAX6+/MITF− cells, respectively. ICC for each of these markers is shown separately in A′ (MITF) and A″ (PAX6). (B) ICC for OTX2 (red) and MITF (green) in d13 adherent cultures. The open and closed arrows mark representative OTX2+/MITF+ and OTX2+/MITF− cells, respectively. ICC for each of these markers is shown separately in B′ (MITF) and B″ (OTX2). (C–E) ICC for VSX2 (red) and MITF (green) in (C) d15, (D) d18 and (E) d20 adherent cultures. The open and closed arrows in C mark representative VSX2+/MITF+ and VSX2+/MITF− cells, respectively. ICC for each of these markers is shown separately in C′ and D′ (MITF) and C″ and D″ (VSX2). Note that VSX2 and MITF expression becomes mutually exclusive over this time period. (F) Light microscopic image of hESC-OVs collected at d20 after being lifted from adherent cultures by gentle trituration. (G–I) Light microscopic images at sequentially higher magnifications showing differentiating RPE at d40 within the adherent skirt of cells left behind after lifting the central OV colony. The asterisk marks the former position of the OV colony. The boxes outline the area magnified in the subsequent panel. (J) ICC image of ZO-1 (red) and MITF (green) in RPE passaged from skirts surrounding former hESC-OV colonies. Scale bars for A–D, J = 20 µm; scale bars for E–I = 50 µm. Nuclei are counterstained with 4′,6-diamidino-2-phenylindole (DAPI) (blue).
A subset of MITF isoforms is expressed in differentiating hESCs and targeted for repression by VSX2
To further interrogate our model system, we next sought to determine which MITF isoforms were expressed in developing human prenatal (hp) retina and hESC-derived OV and RPE cells. At d67 of human retinal development, the RPE is a pigmented, polarized monolayer and the neural retina consists of proliferating NRPCs along with early-born retinal neurons. Day 67 prenatal eyes were dissected to isolate NR and RPE, following which RT-PCR was performed using primers specific for the unique 5′ ends of all eight human MITF isoforms. PCR products from the B isoform were robustly amplified from hpRPE only, whereas the A, H and M isoforms were amplified from both prenatal RPE and prenatal neural retina samples (Fig. 2A, left column). Products of two additional isoforms (D and E) were faintly but consistently detected in prenatal RPE as well. Isoforms C and J were not detected in any retinal cells or tissues tested. The same pattern of isoform expression was also found in d115 prenatal RPE and prenatal neural retina (Fig. 2A, right column); however, in dissected adult eyes, only MITF-A, -H and -M were reliably detected in RPE, with MITF-A and -H also seen in adult neural retina (Supplementary Material, Fig. S2). RPE from differentiating hESC cultures showed a similar MITF isoform expression pattern as human prenatal RPE (Fig. 2B), but differed with regard to PCR product abundance, possibly due to their relative immaturity compared with d67 human prenatal RPE. Taken together, these results suggest that developing human RPE expresses multiple MITF isoforms and that the same general pattern of isoform expression occurs in human embryonic stem cell-derived RPE.
Figure 2.

MITF isoforms show differential expression during human retinal development and hESC differentiation. RT-PCR for MITF isoforms from (A) neural retina (NR) or RPE dissected from d67 or d115 prenatal eyes, or (B) hESC-derived retinal cells (d14 adherent OV cells, d20 lifted OVs containing NRPCs or d40 RPE).
In order to investigate MITF isoform expression in OV cells prior to and during patterning into RPE and neural retina, we performed RT-PCR on differentiating hESC cultures at two stages: d14 plated OV cells, a time point shortly after the initiation of MITF isoform expression, and d20 lifted OVs, which harbor newly established NRPCs. MITF-A, -H and -M were the predominant isoforms detected in d14 OV cells and d20 OVs (Fig. 2B). Table 1 summarizes the data for all MITF isoforms in human embryonic stem cell-derived d14 OV cells and d20 OVs and RPE. From this data, it appears that a number of MITF isoforms are selectively upregulated in the transition from early, unpatterned OV cell cultures to committed RPE.
Table 1.
MITF isoform expression in human prenatal or hESC-derived retinal tissue
| Prenatal tissue |
hESC-derived | ||||
|---|---|---|---|---|---|
| Isoform | NR | RPE | d14 OV | d20 OV (NRPC) | RPE |
| A | + | + | + | + | + |
| B | − | ++ | − | − | + |
| C | − | − | − | − | − |
| D | − | + | − | − | + |
| E | − | ± | − | − | + |
| H | + | ++ | + | + | ++ |
| J | − | − | − | − | − |
| M | + | ++ | ± | ± | + |
In mouse, the Mitf-H and -D promoters are the primary direct binding targets of Vsx2 in the OV during RPE:neural retina patterning (39). To determine which isoforms, if any, are targeted by VSX2 in hESCs, we performed chromatin immunoprecipitation (ChIP) for VSX2 on d30 OVs, followed by PCR analysis for pre-selected MITF isoform promoter regions containing consensus VSX2 binding sites. Day 30 was chosen for these experiments because VSX2 protein levels are consistently higher compared with earlier time points (data not shown). Primers flanking promoter regions free of consensus VSX2 binding sites were used as negative controls (for detailed maps of the consensus sites and primer locations, see Supplementary Material, Fig. S3). VSX2 binding was detected in consensus site-containing regions proximal to the MITF-D and -H coding sequence start sites, but not within the pre-selected promoter sites of the RPE-specific MITF-B isoform (Fig. 3A). VSX2 also bound weakly to a consensus binding site 1780 nt upstream of the MITF-A start site, although a consensus site in a more proximal promoter region remained unbound. Similarly, VSX2 has been shown to bind to the mouse Mitf-A promoter with low affinity (39).
Figure 3.

VSX2 directly binds isoform-specific MITF promoter regions and represses MITF expression. (A) PCR analyses following ChIP with either VSX2 primary antibody (V) or isotype control antibody (C). PCR was performed using primers flanking selected 500 bp promoter regions from four MITF isoforms. The presence or absence of a predicted VSX2 binding site within each selected promoter region is indicated to the right of each image (note that not all predicted sites were bound by VSX2). The location of the pre-selected promoter regions respective to the translational start site of each MITF isoform is shown in Supplementary Material, Figure S3. IN: input DNA. (B) RT-qPCR for VSX2, panMITF, MITF-A and MITF-H from d40 adherent cultures transduced at d15 with lenti-pgkVSX2 (hatched bars), lenti-pgkVSX2-VP16 (solid bars) or control lenti-pgkGFP (open bars). (C) RT-qPCR for RPE markers (TYR, BEST1, RPE65, MERTK) and a forebrain marker (DLX1) in d40 adherent cultures transduced at d15 with lenti-pgkVSX2 (hatched bars) or control lenti-pgkGFP (open bars). *P ≤ 0.04, **P ≤ 0.01, ***P ≤ 0.0005.
VSX2 is predominantly known for its role as a transcriptional repressor in mouse (52–54). Therefore, we tested whether its interactions with MITF promoter regions in hESCs also resulted in transcriptional repression by ectopically expressing VSX2 at d15 of differentiation, during OV patterning. Twenty-five days later (d40), MITF isoform expression was decreased in lenti-VSX2-infected cultures when compared with lenti-GFP-infected cultures, as revealed by RT-qPCR (Fig. 3B). An 80% overall reduction in expression of MITF was observed, along with respective 51% and 84% reductions in expression of MITF-A and -H, two isoforms robustly expressed at this time point (Fig. 3B; pan-MITF: 1.07 ± 0.27 versus 0.19 ± 0.03, P < 0.03; MITF-A: 1.04 ± 0.11 versus 0.51 ± 0.12, P < 0.0005; MITF-H: 1.41 ± 0.41 versus 0.16 ± 0.02, P < 0.008). To definitively ascribe these reductions in MITF expression to VSX2-mediated repression, we transduced hESCs with a lentiviral construct that expressed full-length VSX2 fused to the VP16 transcriptional activator domain, which perturbs normal VSX2 function (53). Ectopic expression of VSX2-VP16 in hESCs beginning at d15 did not reduce MITF expression compared with control cultures, confirming a repressive role for VSX2 in MITF isoform transcription during retinal differentiation (Fig. 3B).
In addition to repressing transcription of specific MITF isoforms, ectopic expression of VSX2 significantly reduced RPE gene expression in hESC-derived retinal cells compared with lenti-GFP-infected control cultures (Fig. 3C). We performed RT-qPCR on d40 adherent cultures consisting mainly of developing RPE with some retained forebrain progenitors and NRPCs. We observed decreased expression of direct downstream gene targets of MITF (TYR, BEST) in differentiating RPE, as well as of other critical RPE genes (RPE65, MERTK). However, expression of the forebrain marker DLX1 was unaffected by ectopic VSX2 expression, demonstrating a specific role of VSX2 in retinogenesis in hESCs as opposed to a generalized effect on neural development.
Lentiviral-mediated knock down of MITF in hESCs alters expression of both OV and RPE genes
To further investigate the role of MITF during the early stages of retinal differentiation, we created stable hESC lines expressing MITF shRNA or non-targeting control shRNA (Fig. 4A). The lentiviral constructs used to produce the knock down lines incorporated a bicistronic blasticidin resistance-IRES-eGFP cassette and a shRNA expression cassette containing either a MITF-targeting or non-targeting control sequence (Supplementary Material, Fig. S4). Control and MITF shRNA hESC lines were expanded and differentiated to d16 to assess the effect of reduced MITF levels on early OV differentiation. Gene expression from three biological replicates of five independent MITF shRNA lines and four independent control shRNA lines was analyzed by RT-qPCR for markers of early OV differentiation (Fig. 4B). Total MITF levels were reduced by 80% in MITF shRNA versus control shRNA lines (0.24 ± 0.02 versus 1.02 ± 0.06, P < 0.0001). Concurrently, reductions in gene expression of other early OV transcription factors were also observed, ranging from 67% (PAX6: 0.33 ± 0.08 versus 1.05 ± 0.12, P < 0.0001) to 88% (LHX2: 0.12 ± 0.03 versus 1.02 ± 0.06, P < 0.0001). In contrast, the forebrain marker DLX1 was expressed at similar levels in MITF shRNA and control shRNA lines (1.09 ± 0.14 versus 1.02 ± 0.2), consistent with a targeted effect of MITF knock down on early OV differentiation.
Figure 4.
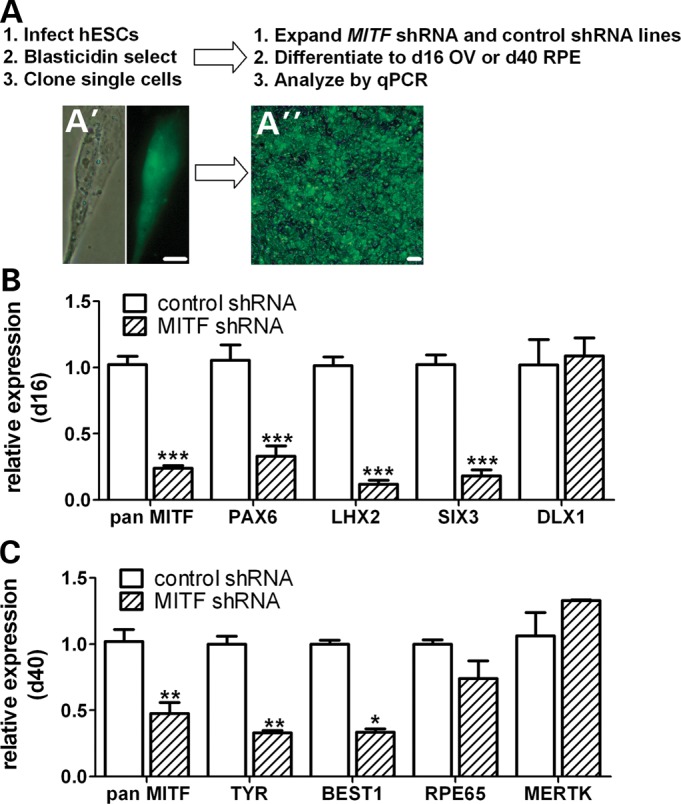
Lenti-shRNA-mediated MITF knock down selectively decreases expression of early OV and RPE genes. (A) Schematic depicting the method used to generate and analyze clonal shRNA-expressing hESC lines following lentiviral infection. Live cell fluorescence images of a representative GFP+ hESC colony before (A′) and after (A″) selection and expansion. (B and C) RT-qPCR analyses showing (B) early OV and forebrain gene expression levels at d16 and (C) RPE gene expression levels at d40 in adherent MITF shRNA-expressing hESC cultures (hatched bars) relative to non-targeted shRNA control hESC cultures (open bars). Note that only RPE genes that are known direct targets of MITF (TYR and BEST1) were reduced. Scale bars = 50 µm. *P < 0.04, **P < 0.004, ***P ≤ 0.0006.
To evaluate the effect of MITF knock down on RPE specification and maturation, we differentiated the MITF shRNA and control shRNA hESC lines to d40 as adherent cultures and assessed RPE gene expression levels by RT-qPCR. Reduction of MITF expression to 48% of control levels resulted in corresponding reductions in the expression of its direct transcriptional targets TYR (0.33 ± 0.02 versus 1.00 ± 0.06, P < 0.009) and BEST1 (0.33 ± 0.03 versus 1.00 ± 0.03, P < 0.004) (Fig. 4C). However, expression levels of RPE genes not directly regulated by MITF, such as RPE65 or MERTK, were not significantly reduced in MITF shRNA versus control shRNA lines. Thus, a partial reduction in MITF levels did not disrupt RPE specification in hESCs, but did affect a subset of genes expressed in developing RPE. Interestingly, despite the aforementioned changes in OV and RPE gene expression, no difference in OV or RPE phenotype was observed in the MITF knock down hESC lines (Supplementary Material, Fig. S5). This finding suggests either that the reduction in MITF expression achieved in these experiments was insufficient to disrupt retinogenesis, or that MITF is not required for normal retinal differentiation in hESCs.
Elimination of MITF in hESCs reduces OV gene expression and affects RPE development
To determine whether the complete absence of MITF activity has a more profound effect on OV and RPE development in hESCs than partial reduction, we employed bacterial artificial chromosome (BAC)-mediated homologous recombination to disrupt both MITF alleles in WA09 hESCs (Supplementary Material, Fig. S6). To confirm that early eye field and OV cells were produced in the absence of MITF, the MITF−/− knock-out line was differentiated for 13 days and subjected to immunocytochemistry (ICC) for the eye field transcription factors PAX6 and OTX2, which were expressed at this time point (Fig. 5A and B). Later on, the presence of NRPCs was confirmed by VSX2 immunoreactivity in d18 differentiated MITF−/− cultures (Fig. 5C). However, MITF expression was not detected by ICC (Fig. 5B and C) or RT-PCR (Fig. 5D and F) at any stage. Further analysis at d16 by RT-qPCR revealed reductions in OV gene expression levels in MITF−/− versus control isogenic MITF+/+ cultures ranging between 75% (SIX3: 0.25 ± 0.01 versus 1.01 ± 0.12, P < 0.003) and 90% (LHX2: 0.10 ± 0.02 versus 1.02 ± 0.13, P < 0.003). Consistent with the MITF knock down experiments, expression levels of the forebrain marker DLX1 were not significantly changed in MITF−/− cultures, again confirming a selective effect of MITF loss on retinal differentiation in hESCs (Fig. 5E).
Figure 5.

Expression levels of early OV and RPE genes are reduced in MITF−/− mutant hESCs relative to MITF+/+ isogenic control hESCs. (A and B) Immunocytochemistry for (A) PAX6 (green) and OTX2 (red) and (B) MITF (green) and OTX2 (red) in d13 adherent MITF−/− hESCs. (C) ICC for MITF (green) and VSX2 (red) in d18 adherent MITF−/− hESCs. Nuclei were counterstained with DAPI (blue). (D) RT-PCR for selected MITF isoforms from d16 MITF+/+ and MITF−/− hESC cultures. (E) RT-qPCR analysis showing expression levels of early OV and forebrain genes in MITF−/− hESCs (hatched bars) relative to MITF+/+ hESCs (open bars) at d16 of differentiation. (F) RT-PCR for selected MITF isoforms from d40 MITF+/+ and MITF−/− hESC cultures. (G) RT-qPCR analysis showing expression levels of RPE genes in MITF−/− hESCs (hatched bars) relative to MITF+/+ hESCs (open bars) at d40 of differentiation. Note that all RPE genes tested were reduced in the MITF−/− cultures. *P ≤ 0.02, **P < 0.003, ***P ≤ 0.0006. Scale bars = 20 µm.
At d40, MITF isoforms remained undetectable by RT-PCR in MITF−/− cultures (Fig. 5F), and expression levels of all MITF target gene transcripts tested were significantly reduced relative to isogenic MITF+/+ controls (Fig. 5G). Unlike in the shRNA-mediated knock down experiments, markers of RPE fate that are not directly regulated by MITF, such as RPE65 and MERTK, were also significantly reduced in d40 differentiated MITF−/− hESCs.
With regard to phenotypic effects, the absence of MITF did not wholly disrupt RPE specification, since cell skirts with RPE-like morphology could be isolated and passaged from MITF−/− cultures. These RPE-like cells lacked MITF, failed to pigment and maintained a disorganized, immature appearance even after 6 months in culture (Fig. 6A–D). However, MITF−/−RPE demonstrated characteristic localization of the tight junction marker ZO-1 and the nuclear transcription factor PAX6, confirming their RPE identity (Fig. 6E–H). In addition, we routinely passaged and expanded MITF−/− RPE more than three times, which cannot typically be achieved with wild-type human pluripotent stem cell-derived RPE using our culture system (55) (Supplementary Material, Fig. S7). Thus, MITF−/− RPE appears to remain in a more primitive state when compared with isogenic control MITF+/+ RPE.
Figure 6.

RPE is produced in MITF−/− hESCs but develops abnormally. (A) Western analysis for MITF and ACTIN protein in d60 second passage MITF+/+ and MITF−/− hESC-RPE. (B) Photograph of cell pellets from matched, second passage d60 MITF+/+ and MITF−/− hESC-RPE grown in parallel. (C and D) Light microscopic images of d60 second passage RPE from MITF+/+ (C) or MITF−/− (D) hESC cultures. (E–H) ICC images from d60 second passage RPE from MITF+/+ (E and G) or MITF−/− (F and H) hESC cultures, showing MITF (green) and ZO-1 (red) (E and F) or PAX6 (green) and ZO-1 (red) (G and H) expression. Scale bars for C and D = 50 μm. Scale bars for E–H = 20 µm.
The absence of MITF decreases proliferation in early hESC-OV cells
In mouse, Mitf is initially expressed throughout the OV and subsequently restricted to the RPE domain (4,5). Examination of the MITF shRNA and MITF−/− hESC lines revealed a decrease in expression of markers of early, unpatterned OV cells, prior to their commitment to either a neural retina or RPE fate, consistent with a role for MITF in OV cell survival and/or proliferation (Figs 4 and 5). Since MITF is known to regulate apoptosis and proliferation in pigmented cell lineages (24), we hypothesized that it performed similar functions in hESC-OV cells. At d16, FACS analysis for Caspase-3, a marker of apoptosis, did not show a significant difference between MITF+/+ isogenic control and MITF−/− hESC lines (data not shown). To assess proliferative status in hESC-derived OV cells, we identified fields of adherent cells enriched for OV cells from MITF+/+ cultures at d18 by looking for VSX2+/MITF+ co-expressing patches (Supplementary Material, Fig. S8A). We then quantified the percentage of cells in the region expressing the proliferation marker Ki67. In MITF+/+ cultures, 23.2 ± 2.2% of cells in the developing OV regions were Ki67+ (Fig. 7A), most of which (67 ± 6%) co-expressed MITF. In differentiating MITF−/− hESCs, fields enriched for OV cells at d18 were identified by expression of VSX2 alone (Supplementary Material, Fig. S8B). The percentage of Ki67+ nuclei in MITF−/− OV regions was significantly less than that found in MITF+/+ OV regions (MITF−/−: 15.4 ± 1.2% versus MITF+/+: 23.2 ± 2.2%, P = 0.011) (Fig. 7A).
Figure 7.

Elimination of MITF protein expression decreases early OV cell proliferation and initial OV size, but does not affect subsequent OV growth. (A) Percentage of OV cells from d18 MITF+/+ (open bar) or MITF−/− (hatched bar) hESC cultures expressing the proliferation marker Ki67. (B) Graph showing the mean area ± S.E.M. of isolated d20 OVs from three independently differentiated, paired cultures of MITF+/+ (open bar) or MITF−/− (hatched bar) hESCs. (C) Pooled data plotted as percentage increase in OV size over time, relative to d30 OVs from MITF+/+ (open bars) or MITF−/− (hatched bars) hESC lines (n = 15 for each group). *P < 0.02, ***P < 0.0001.
Consistent with the decreased proliferation observed at early time points during MITF−/− hESC differentiation, lifted hESC-OVs isolated from the MITF−/− line at d20 were significantly smaller than their MITF+/+ counterparts (Fig. 7B). We measured the area of OVs differentiated in parallel from MITF−/− and MITF+/+ hESCs (n = 3; total = 140 MITF−/− and 87 MITF+/+ hESC-OVs) and found that the average size of MITF−/− OVs was reduced 45% compared with the average size of isogenic control OVs (MITF−/−: 5674 ± 287 µm2 versus MITF+/+: 8736 ± 615 µm2; P < 0.0001). However, starting at d30, growth of isolated MITF−/− hESC-OVs paralleled that of MITF+/+ hESC-OVs (Fig. 7C and Supplementary Material, Fig. S9A). Furthermore, MITF−/− hESC-OVs produced photoreceptor precursors that co-expressed CRX and RECOVERIN by d65 in a similar manner as MITF+/+ control hESC-OVs (Supplementary Material, Fig. S9B). These data suggest that the earliest role of MITF is to support proliferation of unpatterned hESC-OV cells prior to the adoption of a NRPC or RPE fate, after which time MITF plays a role solely in RPE development.
DISCUSSION
Multiple studies have shown that human pluripotent stem cells are capable of producing RPE and neural retina cell types in a sequence and time frame akin to normal human retinogenesis (46–50). We confirmed that MITF is expressed in discrete patches of hESC-derived anterior neuroectoderm/eye field cells prior to the appearance of VSX2, consistent with an early, unpatterned OV stage of retinal development. Subsequently, induction of VSX2 in a subset of MITF+ hESC-OV cells heralded their commitment to a NRPC fate. Our differentiation system, which preserves cell–cell contacts and requires only a minimal, defined medium formulation with few exogenous signaling components, promoted the co-development of RPE and NRPC domains in tight spatial association with one another. These observations reflect the potential for pluripotent stem cells to offer unprecedented insight into intrinsic molecular mechanisms underlying the production of early human retinal cell types.
We performed a detailed investigation of MITF isoform expression patterns in developing human tissue as well as in our hESC model of retinogenesis. Mitf is a complex genetic locus with multiple promoters, many of which are expressed in a tissue-specific or developmentally regulated fashion (39,40,42,44,45,56). We detected six isoforms in developing human RPE and in hESC-derived RPE, whereas only three MITF isoforms were expressed in hESC-derived OV cells. Of interest, the human MITF isoform expression pattern we observed did not overlap completely with published mouse data, suggesting species-specific differences. For example, MITF-B, an isoform readily amplified from maturing human RPE, was not present in mouse RPE (39). It is unclear why only certain MITF isoforms are expressed during retinal development and whether some or all isoforms possess unique roles. However, studies have demonstrated that the absence of either Mitf-D or Mitf-M does not disrupt murine eye development, suggesting at least partial redundancy in Mitf isoform function (29,57). Our human pluripotent stem cell model of retinogenesis is amenable to molecular genetic manipulation, and thus should provide a useful tool to investigate the roles of individual MITF isoforms.
Another notable feature of human pluripotent stem cells is their ability to model molecular mechanisms of OV genesis and retinal cell differentiation. In the present study, we showed that VSX2 binds directly to promoter regions of several MITF isoforms in hESC-OVs at a time when neural retina fate is being established. In addition, ectopic expression of VSX2 repressed transcription of MITF and decreased expression of RPE markers. Conversely, in a recent report we demonstrated that differentiating hiPSC-OVs derived from a patient homozygous for a VSX2 functional null mutation exhibited elevated MITF levels and a neural retina-to-RPE fate conversion when compared with sibling control hiPSC-OVs (50). Together, these findings point toward reciprocal roles for MITF and VSX2 in the establishment of the RPE and neural retina domains in human pluripotent stem cells.
We also directly examined the impact of loss of MITF function on human RPE and OV development by creating MITF shRNA-expressing and MITF−/− hESC lines to either partially knock down or fully knock out its expression. No phenotypic effect on RPE specification and development was seen in MITF knock down cultures, consistent with observations in Mitf+/− mice and humans with heterozygous MITF mutations (reviewed in 9). Elimination of MITF expression also did not prevent RPE specification; however, MITF−/− RPE remained unpigmented and developed abnormally compared with isogenic control cultures, similar to Mitf −/− mice (4,5,9,32–34).
The production of MITF shRNA and MITF−/− hESC lines also allowed us to definitively test whether MITF plays a role in early OV development, prior to RPE specification. In contrast to RPE development, little is known about the function of MITF in unpatterned OV cells. In mouse, Mitf is initially expressed throughout the OV and subsequently restricted to the future RPE, while in chick it is expressed and maintained only in the RPE region of the OV (4,5,15,16,26). Thus, there may be species-specific differences in MITF function within the OV. We observed decreases in expression of key transcription factors during the early stages of OV development and patterning in the MITF knock down and knock-out hESC lines. The reduction in transcription did not lead to a significant phenotype in the knock down lines, most likely because there was sufficient MITF protein present. However, in the complete absence of MITF protein, MITF−/− hESC-OVs were significantly smaller than isogenic control hESC-OVs upon initial isolation. This finding, combined with the reduced proliferation seen in OV cell-enriched regions of MITF−/− hESCs, provides evidence that MITF functions to promote proliferation in early human OV cells.
VSX2 is upregulated in both MITF−/− and wild-type MITF+/+ hESCs during differentiation, which results in the rapid elimination of MITF expression in NRPC-containing OVs isolated from the latter group (46–48,50). It was therefore not surprising that, in the absence of MITF expression, the growth of both MITF−/− and MITF+/+ hESC-OVs closely paralleled one another. In contrast, we recently showed that long-term growth, but not initial size, of VSX2 functional null mutant hiPSC-OVs was reduced compared with wild-type hiPSC-OV controls (50). Thus, MITF appears to control proliferation in early, unpatterned hESC-OV cells, whereas VSX2 carries out this task in NRPCs following neural retina and RPE domain specification.
Taking this information into account, we propose that during the earliest stages of hESC-OV development, MITF primarily influences cell proliferation before being downregulated in the future neural retina domain by VSX2. Thereafter, it assumes its more well-known role in RPE development. A similar dual role for human MITF has also been described in neural crest-derived melanocytes and melanoma cells (22–24). While it is not clear what controls this switch in MITF function, several studies have demonstrated that MITF activity can be influenced by protein–protein interactions (7,29,58,59) as well as by MITF protein levels (60–62). It is also possible that differential isoform expression and/or alternative splicing events trigger conversion between activities (38). Lastly, epigenetic factors may impact MITF activity by restricting target gene sequence access (25,63,64).
In summary, we have described an in vitro, pluripotent stem cell-based model system of retinal development that can be used to study multifaceted roles of transcription factors, beginning at stages that cannot otherwise be investigated in humans. While the degree to which hESCs can recapitulate complex gene expression profiles and molecular events is striking, potential limitations of the system need to be kept closely in mind. For example, it does not take into account signaling cues and mechanical forces from embryonic tissues that surround the OV in vivo. To what extent these influences can be built in to the model remains to be seen. However, the reliance of the current system on default mechanisms of hESC differentiation offers a starting point to investigate human development and improve production and safety of cell derivatives for future clinical applications.
MATERIALS AND METHODS
hESC culture and retinal differentiation
All tissue culture reagents were purchased from Life Technologies (Carlsbad, CA) unless otherwise noted. Methods for human pluripotent stem cell culture and targeted retinal differentiation have been described (46–48). Briefly, WA09 hESCs were passaged and maintained on an irradiated mouse embryonic fibroblast feeder layer (WiCell, Madison, WI) in hESC media [Dulbecco's modified Eagle's medium (DMEM):F12 (1:1), 20% Knockout Serum, 1% minimal essential medium (MEM) non-essential amino acids, 1% l-glutamine, β-mercaptoethanol, 20 ng/ml FGF-2]. Retinal differentiation was initiated by lifting embryoid bodies (EBs) with 2 mg/ml dispase and culturing them for 3 days as free-floating, three-dimensional structures in hESC media without FGF-2. On d4, suspended EB cultures were switched to neural induction medium (NIM; DMEM:F12; 1% N2 supplement, 1% MEM non-essential amino acids, 1% l-glutamine, 2 µg/ml heparin) (51). On d7, EBs were plated on laminin-coated plastic and allowed to form neural rosettes. At d16, the loosely adherent neural clusters were gently lifted by trituration and cultured as floating neurospheres in retinal differentiation medium (RDM; DMEM:F12 (3:1), 2% B27 without retinoic acid, 1% antimycotic/antibiotic) (46). At d18–20, OV spheres were identified by their phase bright appearance and manually separated from non-retinal neurospheres (47,48,50). For RPE culture, the OV-depleted skirts of adherent cells were also switched to RDM at d16 and maintained until d40 for molecular analysis or dissection and passaging, which was performed as previously described (55).
Immunocytochemistry
To facilitate ICC analysis, d7 EBs were plated on laminin-coated poly-l-lysine-treated glass coverslips and cultured for specified lengths of time before being fixed with 4% paraformaldehyde. For ICC on d65 OVs, spheres were fixed and cryosectioned as previously described (48). For ICC on passaged RPE, cells were cultured on coverslips for 2 months prior to fixation with 4% paraformaldehyde. Fixed samples were blocked with 10% normal donkey serum and permeabilized with 0.5% Triton X-100 (Sigma-Aldrich, St Louis, MO) prior to overnight incubation at 4°C with primary antibodies diluted in 5% donkey serum and 0.25% Triton X-100. A list of primary antibodies is found in Supplementary Material, Table S1. Immunolabeled cells were visualized with AF488-, AF546- or AF647-conjugated secondary antibodies and nuclei were counterstained with 4′,6-diamidino-2-phenylindole [(DAPI) Life Technologies]. Cells were imaged on either a Nikon 80i or a Nikon C1 laser scanning confocal microscope (Nikon Corp., Tokyo, Japan).
Human prenatal eye dissection and processing
Postmortem human prenatal eyes were obtained from the Birth Defects Research Laboratory (Seattle, WA) according to protocols approved by the NIH and the Institutional Review Boards at the University of Wisconsin–Madison and the University of Washington. Eyes were dissected and processed as previously described (65). Briefly, neuroretina from gestational Day 67 or 115 eyes was separated from underlying RPE and transferred to RNeasy® buffer RLT (Qiagen, Valencia, CA) containing β-mercaptoethanol for RNA isolation. The remaining RPE was then transferred to buffer RLT for RNA isolation.
Gene expression analysis
Total RNA was extracted from cell and tissue samples using the RNeasy mini kit (Qiagen, Valencia, CA) according to the manufacturer's instructions, which included a DNase incubation step to remove contaminating genomic DNA. One microgram of RNA was reverse transcribed using the iScript cDNA synthesis kit (BioRad, Hercules, CA), and PCR was carried out with 2x PCR Master Mix (Promega, Madison, WI) for 30 cycles (55°C annealing temperature), followed by analysis on 1–2% agarose gels containing ethidium bromide. Quantitative PCR analysis (qPCR) (35 cycles) was performed with SsoAdvanced SYBR® Green supermix on a C1000 thermocycler equipped for real-time PCR detection (BioRad). All qPCR experiments utilized at least three biological replicates. Results were analyzed with Microsoft Excel and GraphPad Prism 5 and presented as average 2−ΔΔCq ± SEM for all reactions. Primer sequences are listed in Supplementary Material, Tables S2 and S3 for RT-PCR and RT-qPCR, respectively.
Protein expression analysis
RPE or HEK293 cells were collected and snap frozen, after which the cell pellets were lysed in RIPA buffer (Pierce, Rockford, IL) with 40 μl/ml protease inhibitor cocktail (P8340; Sigma-Aldrich, St Louis, MO), cleared by centrifugation, and quantified by Lowry assay. Protein samples (30–50 μg) were loaded onto 10% Tris–HCl Ready gels (BioRad), separated by SDS-PAGE, and electroblotted in 20% methanol Tris/glycine transfer buffer onto PVDF-Licor membranes (Millipore, Billerica, MA). PVDF membranes with transferred protein were then placed in Odyssey blocking buffer (LiCor, Lincoln, NE) for 1 h at RT followed by overnight incubation with primary antibody [MITF: Exalpha (Shirley, MA) C5 mouse monoclonal, 1:250; ACTIN: Millipore mouse monoclonal, 1:1000] in blocking buffer + 0.1% Tween20 at 4°C. Thereafter, membranes were washed with PBS/0.1% Tween20 and incubated with 1:10 000 diluted donkey α-mouse IRdye 800CW secondary antibody (LiCor) in blocking buffer + 0.1% Tween20/0.01% SDS for 1 h. Immunoblots were washed with PBS/0.1% Tween20 and protein bands were visualized with an Odyssey Infrared Imager (Licor).
Chromatin immunoprecipitation
OVs were manually isolated (47) at d18–20 and differentiated to d30 in RDM. OVs were then crosslinked with 1% formaldehyde at RT with shaking for 10 min, followed by neutralization with 125 mm glycine. Subsequently, crosslinked OVs were lysed in RIPA buffer (Pierce, Rockford, IL) with 40 μl/ml protease inhibitor cocktail (P8340; Sigma) and sonicated in a Q700 ultrasonic processer (Qsonica, Newtown, CT) equipped with a cup horn. The size range of sheared DNA was monitored by running samples on 1% agarose gels. Immunoprecipitation was performed overnight at 4°C with 2 μg of either goat anti-VSX2 primary antibody (1 μg each of the C17 and N18 antibodies, Santa Cruz, Dallas, TX) or normal goat IgG (Millipore). Complexes were collected with protein G-conjugated Dynabeads (Life Technologies), washed, eluted in 10 mm Tris HCl/1 mm ethylenediaminetetraacetic acid (pH 8)/1% SDS, and heated at 65°C to reverse the crosslinks. Samples were then diluted with sterile water and DNA was extracted with an equal volume of phenol:CHCl3:isoamyl alcohol (1:1:24; Ambion/Life Technologies) followed by ethanol precipitation. PCR analyses (35 cycles) on input DNA, control immunoprecipitated (IP) DNA, and VSX2 IP DNA were performed using 2× PCR Master Mix (Promega) and promoter-specific primer sets, and the resulting PCR products were visualized on a 2% agarose gel containing ethidium bromide. Supplementary Material, Table S2 lists the primer sequences used and Supplementary Material, Figure S3 shows the relative locations of the primer sets and consensus VSX2 binding sites in selected MITF isoform promoter regions. Potential VSX2 consensus binding sites were identified either via homology to previously published mouse VSX2 binding sites (39) or by predictions made using the web-based PROMO algorithm within 3 kb regions upstream of MITF isoform transcription start sites (http://alggen.lsi.upc.es/cgi-bin/promo_v3/promo/promoinit.cgi?dirDB=TF_8.3; 66,67).
Ectopic expression of VSX2 or VSX2-VP16 fusion protein
The pSIN-mpgk-VSX2 expression plasmid and the procedure for lentivirus-mediated ectopic protein expression in differentiating human pluripotent stem cells have been described (50). The pSIN-mpgk-VSX2-VP16 plasmid was constructed by PCR amplifying the equivalent coding sequence from the pMXIE-ChxV plasmid (53) and cloning it into the pSIN-WP-mpgk lentiviral shuttle backbone (68). Lentivirus was produced according to standard protocols (69). Virus was 40× concentrated by ultracentrifugation and working titers were determined by infecting HEK293T cells and performing VSX2 ICC or directly visualizing eGFP fluorescence at 48 h post-infection. Equivalent working titers of the pSIN-mpgk-VSX2, pSIN-mpgk-VSX2-VP16, and pSIN-mpgk-GFP lentiviruses were used to transduce plated hESC-EBs at d15. Control infections yielded >70% GFP+ cells.
Generation of MITF shRNA hESC lines
A short interfering RNA sequence that targets MITF effectively was previously identified (56) (Supplementary Material, Fig. S4). For a non-targeting, control sequence, we used NC-1 (Integrated DNA Technologies, Coralville, IA) (Supplementary Material, Fig. S4). Oligonucleotides encoding stem loop structures with AgeI and EcoRI overhangs were cloned into a modified pLKO.1 vector with the puroR coding region replaced by a GFP-ires-blasticidin resistance cassette (70). The specificity of MITF transcript knockdown was validated by transfecting the MITF-targeting shRNA plasmid or the non-targeting shRNA plasmid into HEK293 cells along with a MITF ectopic expression plasmid and performing Western analysis for MITF protein (Supplementary Material, Fig. S4B). Following validation of the MITF and control shRNA sequences, lentivirus was made as described above. To generate stable lines, WA09 hESCs were passaged on Matrigel® in mTesR1 (WiCell) to facilitate drug selection. Cells were dissociated with Versene (Life Technologies), mixed with lentivirus (titered as described above), and incubated for 30 min at 37°C in 1 ml mTeSR1 + 10 μm Y-27632 (PeproTech, Rocky Hill, NJ) before re-plating on Matrigel®. Infection efficiency was monitored by GFP fluorescence, and blasticidin selection (2 μg/ml) was started 48 h after infection. Non-clonal stable populations were dissociated to single cells, counted, diluted to 10 cells per 100 μl in mTeSR1 + Y-27632, and dispensed into individual wells of a 96-well plate. After 2 weeks, GFP+ colonies from separate wells were manually picked, plated onto MEF, and cultured as undifferentiated hESCs as described above.
Generation of MITF knock-out hESC lines
A BAC clone (RP11-378D21: GRCh37/hg19 assembly chr3: 69897000-70055107) containing the MITF locus was modified by standard recombineering techniques using the Red/ET system (Genebridges, Heidelberg, Germany). A cassette encoding the human EF1α promoter driving a puromycin resistance gene and flanked by loxP sites was inserted within the second common exon (exon 3) of the MITF locus, disrupting transcription from the upstream promoters (Supplementary Material, Fig. S5). The construct was linearized by AscI restriction digestion and transfected by electroporation into WA09 hESCs as previously described (71). Successfully targeted clones were isolated by puromycin selection and identified by qPCR analysis of genomic DNA to assess MITF copy number. A clone identified in this manner was expanded and the selection cassette was subsequently excised via transfection of mRNA encoding Cre recombinase. Removal of the cassette was confirmed by genomic PCR and loss of resistance to puromycin. To generate a MITF−/− line from the single targeted clone, the same MITF gene-targeting construct was again introduced by electroporation and puromycin resistant clones were isolated. A knock-out line was confirmed by PCR analysis of genomic DNA using primers flanking the target site in the MITF gene. Absence of MITF expression was confirmed by RT-PCR, ICC and Western blotting (Figs. 5 and 6).
OV growth assay
Fifteen OVs each were selected from day 30 MITF+/+ and MITF−/− OVs, placed in individual wells of a 96-well plate, and maintained in RDM until 65 days of differentiation. Bright field photographs of each OV were taken every 3–5 days using a Nikon Cool Pix camera attached to a Nikon TS100 inverted microscope and measured with Nikon Elements D software to calculate OV area. OV size at each time point was normalized to its size at d30 and average growth ± SEM for all OVs was plotted for each time point.
Live cell imaging, cell counts and statistics
All live cell imaging, with the exception of the growth curve analysis (see above), was done with a QImaging CE (Surrey, BC, Canada) CCD camera attached to a Nikon TS100 inverted microscope equipped with epiflourescence. Measurements of d20 OV area and Ki67+ or MITF+ cell percentage were made using the Nikon Elements module D 3.2 taxonomy feature on photomicrographs or confocal images. Graphs were plotted with Graph Pad Prism 5.0, which was also used for statistical analysis. All data are presented as mean ± SEM. Significance was determined with a two-tailed unpaired Student's t-test at 95% confidence.
SUPPLEMENTARY MATERIAL
FUNDING
This work was supported by National Institutes of Health grant numbers R01 EY21218, P30 HD03352; the E. Matilda Ziegler Foundation for the Blind; the Foundation Fighting Blindness Wynn-Gund Translation Research Award; the Retina Research Foundation (Kathryn and Latimer Murfee and Emmett A Humble Chairs); the Muskingum County Community Foundation and the McPherson Eye Research Institute (Sandra Lemke Trout Chair in Eye Research).
Supplementary Material
ACKNOWLEDGMENTS
We thank I. Livne-bar and R. Bremner for the generous gift of the pMXIE-ChxV plasmid.
Conflict of Interest statement. None declared.
REFERENCES
- 1.Zuber M., Gestri G., Viczian A., Barsacchi G., Harris W. Specification of the vertebrate eye by a network of eye field transcription factors. Development. 2003;130:5155–5167. doi: 10.1242/dev.00723. [DOI] [PubMed] [Google Scholar]
- 2.Fuhrman S. Eye morphogenesis and patterning of the optic vesicle. Curr. Top. Dev. Biol. 2010;93:61–84. doi: 10.1016/B978-0-12-385044-7.00003-5. [DOI] [PMC free article] [PubMed] [Google Scholar]
- 3.Fuhrman S., Zou C., Levine E. Retinal pigment epithelium development, plasticity and tissue homeostasis. Exp. Eye Res. 2013 doi: 10.1016/j.exer.2013.09.003. doi:10.1016/j.exer.2013.09.003. [DOI] [PMC free article] [PubMed] [Google Scholar]
- 4.Nguyen M., Arnheiter H. Signaling and transcriptional regulation in early mammalian eye development: a link between FGF and MITF. Development. 2000;127:3581–3591. doi: 10.1242/dev.127.16.3581. [DOI] [PubMed] [Google Scholar]
- 5.Bora N., Conway S., Liang H., Smith S. Transient overexpression of the Microphthalmia gene in the eyes of Microphthalmia vitiligo mutant mice. Dev. Dyn. 1998;213:283–292. doi: 10.1002/(SICI)1097-0177(199811)213:3<283::AID-AJA5>3.0.CO;2-H. [DOI] [PubMed] [Google Scholar]
- 6.Opdecamp K., Nakayama A., Nguyen M., Hodgkinson C., Pavan W., Arnheiter H. Melanocyte development in vivo and in neural crest cell cultures: crucial dependence on the Mitf basic-helix–loop–helix-zipper transcription factor. Development. 1997;124:2377–2386. doi: 10.1242/dev.124.12.2377. [DOI] [PubMed] [Google Scholar]
- 7.Hodgkinson C., Moore K., Nakayama A., Steingrímsson E., Copeland N., Jenkins N., Arnheiter H. Mutations at the mouse microphthalmia locus are associated with defects in a gene encoding a novel basic-helix–loop–helix-zipper protein. Cell. 1993;74:395–404. doi: 10.1016/0092-8674(93)90429-t. [DOI] [PubMed] [Google Scholar]
- 8.Hemesath T., Steingrímsson E., McGill G., Hansen M., Vaught J., Hodgkinsson C., Arnheiter H., Copeland N., Jenkins N., Fisher D. microphthalmia, a critical factor in melanocyte development, defines a discrete transcription factor family. Genes Dev. 1994;8:2770–2780. doi: 10.1101/gad.8.22.2770. [DOI] [PubMed] [Google Scholar]
- 9.Steingrímsson E., Copeland N., Jenkins N. Melanocytes and the Microphthalmia transcription factor network. Annu. Rev. Genet. 2004;38:365–411. doi: 10.1146/annurev.genet.38.072902.092717. [DOI] [PubMed] [Google Scholar]
- 10.Levy C., Khaled M., Fisher D. MITF: master regulator of melanocyte development and melanoma oncogene. Trends Mol. Med. 2006;12:406–414. doi: 10.1016/j.molmed.2006.07.008. [DOI] [PubMed] [Google Scholar]
- 11.Rowan S., Chen C., Young T., Fisher D., Cepko C. Transdifferentiation of the retina into pigmented cells in ocular retardation mice defines a new function of the homeodomain gene Chx10. Development. 2004;131:5139–5152. doi: 10.1242/dev.01300. [DOI] [PubMed] [Google Scholar]
- 12.Horsford D., Nguyen M., Sellar G., Kothary R., Arnheiter H., McInnes R. Chx10 repression of MITF is required for the maintenance of mammalian neuroretinal identity. Development. 2005;132:177–187. doi: 10.1242/dev.01571. [DOI] [PubMed] [Google Scholar]
- 13.Hyer J., Mima T., Mikawa T. FGF1 patterns the optic vesicle by directing the placement of the neural retina domain. Development. 1998;125:869–877. doi: 10.1242/dev.125.5.869. [DOI] [PubMed] [Google Scholar]
- 14.Vogel-Höpker A., Momose T., Rohrer H., Yasuda K., Ishihara L., Rapaport D. Multiple functions of fibroblast growth factor-8 (FGF-8) in chick eye development. Mech. Dev. 2000;94:25–36. doi: 10.1016/s0925-4773(00)00320-8. [DOI] [PubMed] [Google Scholar]
- 15.Fuhrmann S., Levine E., Reh T. Extraocular mesenchyme patterns the optic vesicle during early eye development in the embryonic chick. Development. 2000;127:4599–4609. doi: 10.1242/dev.127.21.4599. [DOI] [PubMed] [Google Scholar]
- 16.Müller F., Rohrer H., Vogel-Höpker A. Bone morphogenetic proteins specify the retinal pigment epithelium in the chick embryo. Development. 2007;134:3483–3493. doi: 10.1242/dev.02884. [DOI] [PubMed] [Google Scholar]
- 17.Martinez-Morales J., Rodrigo I., Bovolenta P. Eye development: a view from the retinal pigment epithelium. Bioessays. 2004;26:766–777. doi: 10.1002/bies.20064. [DOI] [PubMed] [Google Scholar]
- 18.Bharti K., Nguyen M., Skuntz S., Bertuzzi S., Arnheiter H. The other pigment cell: specification and development of the pigmented epithelium of the vertebrate eye. Pigment Cell Res. 2006;19:380–394. doi: 10.1111/j.1600-0749.2006.00318.x. [DOI] [PMC free article] [PubMed] [Google Scholar]
- 19.Schwarz M., Cecconi F., Bernier G., Andrejewski N., Kammandel B., Wagner M., Gruss P. Spatial specification of mammalian eye territories by reciprocal transcriptional repression of Pax2 and Pax6. Development. 2000;127:4325–4334. doi: 10.1242/dev.127.20.4325. [DOI] [PubMed] [Google Scholar]
- 20.Kobayashi T., Yasuda K., Araki M. Coordinated regulation of bone morphogenetic protein 4 and ventral Sonic hedgehog signaling specifies the dorso-ventral polarity in the optic vesicle and governs ocular morphogenesis through fibroblast growth factor 8 upregulation. Dev. Growth Differ. 2010;52:351–363. doi: 10.1111/j.1440-169X.2010.01170.x. [DOI] [PubMed] [Google Scholar]
- 21.McGill G., Horstmann M., Widlund H., Du J., Motyckova G., Nishimura E., Lin Y., Ramaswamy S., Avery W., Ding H., et al. Bcl2 regulation by the melanocyte master regulator Mitf modulates lineage survival and melanoma cell viability. Cell. 2002;109:707–718. doi: 10.1016/s0092-8674(02)00762-6. [DOI] [PubMed] [Google Scholar]
- 22.Du J., Widlund H., Horstmann M., Ramaswamy S., Ross K., Huber W., Nishimura E., Golub T., Fisher D. Critical role of CDK2 for melanoma growth linked to its melanocyte-specific transcriptional regulation by MITF. Cancer Cell. 2004;6:565–576. doi: 10.1016/j.ccr.2004.10.014. [DOI] [PubMed] [Google Scholar]
- 23.Strub T., Giuliano S., Ye T., Bonet C., Keime C., Kobi D., Le Gras S., Cormont M., Ballotti R., Bertolotto C., Davidson I. Essential role of microphthalmia transcription factor for DNA replication, mitosis and genomic stability in melanoma. Oncogene. 2011;30:2319–2332. doi: 10.1038/onc.2010.612. [DOI] [PubMed] [Google Scholar]
- 24.Cheli Y., Ohanna M., Ballotti R., Bertolotto C. Fifteen-year quest for microphthalmia-associated transcription factor target genes. Pigment. Cell Melanoma Res. 2009;23:27–40. doi: 10.1111/j.1755-148X.2009.00653.x. [DOI] [PubMed] [Google Scholar]
- 25.Levy C., Fisher D. Dual roles of lineage restricted transcription factors. The case of MITF in melanocytes. Transcription. 2011;2:19–22. doi: 10.4161/trns.2.1.13650. [DOI] [PMC free article] [PubMed] [Google Scholar]
- 26.Mochii M., Mazaki Y., Mizuno N., Hayashi H., Eguchi G. Role of Mitf in differentiation and transdifferentiation of chicken pigmented epithelial cell. Dev. Biol. 1998;193:47–62. doi: 10.1006/dbio.1997.8800. [DOI] [PubMed] [Google Scholar]
- 27.Esumi N., Kachi S., Campochlaro P., Zack D. VMD2 promoter requires two proximal E-box sites for its activity in vivo and is regulated by the MITF-TFE family. J. Biol. Chem. 2007;282:1838–1850. doi: 10.1074/jbc.M609517200. [DOI] [PubMed] [Google Scholar]
- 28.Tsukiji N., Nishihara D., Yajima I., Takeda K., Shibihara S., Yamamoto H. Mitf functions as an in ovo regulator for cell differentiation and proliferation during development of the chick RPE. Dev. Biol. 2009;326:335–346. doi: 10.1016/j.ydbio.2008.11.029. [DOI] [PubMed] [Google Scholar]
- 29.Bharti K., Gasper M., Ou J., Brucato M., Clore-Gronenborn K., Pickel J., Arnheiter H. A regulatory loop involving PAX6, MITF, and WNT signaling controls retinal pigment epithelium development. PLoS Genet. 2012;8:e1002757. doi: 10.1371/journal.pgen.1002757. [DOI] [PMC free article] [PubMed] [Google Scholar]
- 30.Planque N., Raposo G., Leconte L., Anezo O., Martin P., Saule S. Microphthalmia Transcription Factor induces both retinal pigmented epithelium and neural crest melanocytes from neuroretina cells. J. Biol. Chem. 2004;279:41911–41917. doi: 10.1074/jbc.M404964200. [DOI] [PubMed] [Google Scholar]
- 31.Iwakiri R., Kobayashi K., Okinami S., Kobayashi H. Suppression of Mitf by small interfering RNA induces dedifferentiation of chick embryonic retinal pigment epithelium. Exp. Eye Res. 2005;81:15–21. doi: 10.1016/j.exer.2005.01.004. [DOI] [PubMed] [Google Scholar]
- 32.Scholtz C., Chan K. Complicated colobomatous microphthalmia in the microphthalmic (mi/mi) mouse. Development. 1987;99:501–508. doi: 10.1242/dev.99.4.501. [DOI] [PubMed] [Google Scholar]
- 33.Nakayama A., Nguyen M., Chen C., Opdecamp K., Hodgkinson C., Arnheiter H. Mutations in microphthalmia, the mouse homolog of the human deafness gene MITF, affect neuroepitelial and neural crest-derived melanocytes differently. Mech. Dev. 1998;70:155–166. doi: 10.1016/s0925-4773(97)00188-3. [DOI] [PubMed] [Google Scholar]
- 34.Bumsted K., Barnstable C. Dorsal retinal pigment epithelium differentiates as neural retina in the microphthalmia (mi/mi) mouse. Invest. Ophthalmol. Vis. Sci. 2000;41:903–908. [PubMed] [Google Scholar]
- 35.Westenskow P., McKean J., Kubo F., Nakagawa S., Fuhrmann S. Ectopic Mitf in the embryonic chick retina by co-transfection of β-catenin and OTX2. Invest. Ophthalmol. Vis. Sci. 2010;51:5328–5335. doi: 10.1167/iovs.09-5015. [DOI] [PMC free article] [PubMed] [Google Scholar]
- 36.Lane B., Lister J. Otx but not Mitf transcription factors are required for zebrafish retinal pigment epithelium development. PLoS One. 2012;7:e49357. doi: 10.1371/journal.pone.0049357. [DOI] [PMC free article] [PubMed] [Google Scholar]
- 37.Hallsson J., Favor J., Hodgkinson C., Glaser T., Lamoreux M., Magnúsdóttir R., Gunnarsson G., Sweet H., Copeland N., Jenkins N., Steingrímsson E. Genomic, transcriptional and mutational analysis of the mouse microphthalmia locus. Genetics. 2000;155:291–300. doi: 10.1093/genetics/155.1.291. [DOI] [PMC free article] [PubMed] [Google Scholar]
- 38.Bismuth K., Maric D., Arnheiter H. MITF and cell proliferation: the role of alternative splice forms. Pigment Cell Res. 2005;18:349–359. doi: 10.1111/j.1600-0749.2005.00249.x. [DOI] [PMC free article] [PubMed] [Google Scholar]
- 39.Bharti K., Liu W., Csermely T., Bertuzzi S., Arnheiter H. Alternative promoter use in eye development: the complex role and regulation of the transcription factor MITF. Development. 2008;135:1169–1178. doi: 10.1242/dev.014142. [DOI] [PMC free article] [PubMed] [Google Scholar]
- 40.Amae S., Fuse N., Yasumoto K., Sato S., Yajima I., Yamamoto H., Udono T., Durlu Y., Tamai M., Takahashi K., Shibahara S. Identification of a novel isoform of microphthalmia-associated transcription factor that is enriched in retinal pigment epithelium. Biochem. Biophys. Res. Commun. 1998;247:710–715. doi: 10.1006/bbrc.1998.8838. [DOI] [PubMed] [Google Scholar]
- 41.Udono T., Yasumoto K., Takeda K., Amae S., Watanabe K., Saito H., Fuse N., Tachibana M., Takahashi K., Tamai M., Shibahara S. Structural organization of the human microphthalmia-associated transcription factor gene containing four alternative promoters. Biochem. Biophys. Acta. 2000;1491:205–219. doi: 10.1016/s0167-4781(00)00051-8. [DOI] [PubMed] [Google Scholar]
- 42.Hershey C., Fisher D. Genomic analysis of the Microphthalmia locus and identification of the MITF-J/Mitf-J isoform. Gene. 2004;347:73–82. doi: 10.1016/j.gene.2004.12.002. [DOI] [PubMed] [Google Scholar]
- 43.Watanabe K., Takeda K., Yasumoto K., Udono T., Saito H., Ikeda K., Takasaka T., Takahashi K., Kobayashi T., Tachibana M., Shibahara S. Identification of a distal enhancer for the melanocyte-specific promoter of the MITF gene. Pigment Cell Res. 2002;15:201–211. doi: 10.1034/j.1600-0749.2002.01080.x. [DOI] [PubMed] [Google Scholar]
- 44.Takemoto C., Yoon Y., Fisher D. The identification and functional characterization of a novel mast cell isoform of the microphthalmia-associated transcription factor. J. Biol. Chem. 2002;277:30244–30252. doi: 10.1074/jbc.M201441200. [DOI] [PubMed] [Google Scholar]
- 45.Maruotti J., Thein T., Zack D., Esumi N. MITF-M, a ‘melanocyte-specific’ isoform, is expressed in the adult retinal pigment epithelium. Pigment Cell Melanoma Res. 2012;25:641–644. doi: 10.1111/j.1755-148X.2012.01033.x. [DOI] [PMC free article] [PubMed] [Google Scholar]
- 46.Meyer J., Shearer R., Capowski E., Wright L., Wallace K., McMillan E., Zhang S., Gamm D. Modeling early retinal development with human embryonic and induced pluripotent stem cells. Proc. Natl. Acad. Sci. 2009;106:16698–16703. doi: 10.1073/pnas.0905245106. [DOI] [PMC free article] [PubMed] [Google Scholar]
- 47.Meyer J., Howden S., Wallace K., Verhoeven A., Wright L., Capowski E., Pinilla I., Martin J., Tian S., Stewart R., et al. Optic vesicle-like structures derived from human pluripotent stem cells facilitate a customized approach to retinal disease treatment. Stem Cells. 2011;29:1206–1218. doi: 10.1002/stem.674. [DOI] [PMC free article] [PubMed] [Google Scholar]
- 48.Phillips M., Wallace K., Dickerson S., Miller M., Verhoeven A., Martin J., Wright L., Shen W., Capowski E., Percin E., et al. Blood-derived human iPS cells generate optic vesicle-like structures with the capacity to form retinal laminae and develop synapses. Invest. Ophthalmol. Vis. Sci. 2012;53:2007–2019. doi: 10.1167/iovs.11-9313. [DOI] [PMC free article] [PubMed] [Google Scholar]
- 49.Nakano T., Ando S., Takata N., Kawada M., Muguruma K., Sekiguchi K., Saito K., Yonemura S., Eiraku M., Sasai Y. Self-formation of optic cups and storable stratified neural retina from human ESCs. Cell Stem Cell. 2012;10:771–785. doi: 10.1016/j.stem.2012.05.009. [DOI] [PubMed] [Google Scholar]
- 50.Phillips M., Perez T., Martin J., Reshel S., Wallace K., Capowski E., Singh R., Wright L., Clark E., Barney P., et al. Modeling human retinal development with patient-specific iPS cells reveals multiple roles for VSX2. Stem Cells. 2014 doi: 10.1002/stem.1667. Feb 15 doi: 10.10002/stem 1667. [DOI] [PMC free article] [PubMed] [Google Scholar]
- 51.Pankratz M., Li X., Lavaute T., Lyons E., Chen X., Zhang S. Directed neural differentiation of human embryonic stem cells via an obligated primitive anterior stage. Stem Cells. 2007;25:1511–1520. doi: 10.1634/stemcells.2006-0707. [DOI] [PMC free article] [PubMed] [Google Scholar]
- 52.Dorval K., Bobechko B., Ahmad K., Bremner R. Transcriptional activity of the paired-like homeodomain proteins CHX10 and VSX1. J. Biol. Chem. 2005;280:10100–10108. doi: 10.1074/jbc.M412676200. [DOI] [PubMed] [Google Scholar]
- 53.Livne-bar I., Pacal M., Cheung M., Hankin M., Trogadis J., Chen D., Dorval K., Bremner R. Chx10 is required to block photoreceptor differentiation but is dispensable for progenitor proliferation in the postnatal retina. Proc. Natl. Acad. Sci. U. S. A. 2006;103:4989–4993. doi: 10.1073/pnas.0600083103. [DOI] [PMC free article] [PubMed] [Google Scholar]
- 54.Clark A., Yun S., Veien E., Wu Y., Chow R., Dorsky R., Levine E. Negative regulation of Vsx1 by its paralog Chx10/Vsx2 is conserved in the vertebrate retina. Brain Res. 2008;1192:99–113. doi: 10.1016/j.brainres.2007.06.007. [DOI] [PMC free article] [PubMed] [Google Scholar]
- 55.Singh R., Phillips M., Kuai D., Meyer J., Martin J., Smith M., Perez E., Shen W., Wallace K., Capowski E., et al. Functional analysis of serially expanded human iPS cell-derived RPE cultures. Invest. Ophthalmol. Vis. Sci. 2013;54:6767–6778. doi: 10.1167/iovs.13-11943. [DOI] [PMC free article] [PubMed] [Google Scholar]
- 56.Li J., Song J., Bell R., Tran T., Hag R., Liu H., Love K., Anderson D., Fisher D. YY1 regulates melanocyte development and function by cooperating with MITF. PLoS Genet. 2012;8:e1002688. doi: 10.1371/journal.pgen.1002688. [DOI] [PMC free article] [PubMed] [Google Scholar]
- 57.Yajima I., Sato S., Kimura T., Yasumoto K., Shibahara S., Goding C., Yamamoto H. An L1 element intronic insertion in the black-eyed white (Mitfmi−bw) gene: the loss of a single Mitf isoform responsible for the pigmentary defect and inner ear deafness. Hum. Mol. Genet. 1999;8:1431–1441. doi: 10.1093/hmg/8.8.1431. [DOI] [PubMed] [Google Scholar]
- 58.Planque N., Leconte L., Coquello F., Martin P., Saule S. Specific Pax-6/microphthalmia transcription factor interactions involve their DNA-binding domains and inhibit transcriptional properties of both proteins. J. Biol. Chem. 2001;276:29330–29337. doi: 10.1074/jbc.M101812200. [DOI] [PubMed] [Google Scholar]
- 59.Zou C., Levine E. Vsx2 controls eye organogenesis and retinal progenitor identity via homeodomain and non-homeodomain residues required for high affinity DNA binding. PLoS Genet. 2012;8:e1002924. doi: 10.1371/journal.pgen.1002924. [DOI] [PMC free article] [PubMed] [Google Scholar]
- 60.Carreira S., Goodall J., Denat L., Rodriguez M., Nuciforo P., Hoek K., Testori A., Larue L., Goding C. Mitf regulation of Dia1 controls melanoma proliferation and invasiveness. Genes Dev. 2006;20:3426–3439. doi: 10.1101/gad.406406. [DOI] [PMC free article] [PubMed] [Google Scholar]
- 61.Koludrovic D., Davidson I. MITF, the Janus transcription factor of melanoma. Future Oncol. 2013;9:235–244. doi: 10.2217/fon.12.177. [DOI] [PubMed] [Google Scholar]
- 62.Lister J., Capper A., Zeng Z., Mathers M., Richardson J., Paranthaman K., Jackson I., Patton E. A conditional zebrafish MITF mutation reveals MITF levels are critical for melanoma promotion vs regression in vivo. J. Invest. Dermatol. 2014;134:133–140. doi: 10.1038/jid.2013.293. [DOI] [PMC free article] [PubMed] [Google Scholar]
- 63.Ozsolak F., Song J., Liu X., Fisher D. High-throughput mapping of the chromatin structure of human promoters. Nat. Biotechnol. 2007;25:244–248. doi: 10.1038/nbt1279. [DOI] [PubMed] [Google Scholar]
- 64.Keenen B., Qi H., Saladi S., Yeung M., de la Serna I. Heterogeneous SWI/SNF chromatin remodeling complexes promote expression of microphthalmia-associated transcription factor target genes in melanoma. Oncogene. 2010;29:81–92. doi: 10.1038/onc.2009.304. [DOI] [PMC free article] [PubMed] [Google Scholar]
- 65.Gamm D., Wright L., Capowski E., Shearer R., Meyer J., Kim H., Schneider B., Melvan J., Svendsen C. Regulation of prenatal human retinal neurosphere growth and cell fate potential by retinal pigment epithelium and Mash1. Stem Cells. 2008;26:3182–3193. doi: 10.1634/stemcells.2008-0300. [DOI] [PMC free article] [PubMed] [Google Scholar]
- 66.Messeguer X., Escudero R., Farré D., Núñez O., Martínez J., Albà M.M. PROMO: detection of known transcription regulatory elements using species-tailored searches. Bioinformatics. 2002;18:333–334. doi: 10.1093/bioinformatics/18.2.333. [DOI] [PubMed] [Google Scholar]
- 67.Farré D., Roset R., Huerta M., Adsuara J., Roselló L., Albà M., Messeguer X. Identification of patterns in biological sequences at the ALGGEN server: PROMO and MALGEN. Nucleic Acids Res. 2003;31:3651–3653. doi: 10.1093/nar/gkg605. [DOI] [PMC free article] [PubMed] [Google Scholar]
- 68.Capowski E., Schneider B., Ebert A., Seehus C., Szulc J., Zufferey R., Aebischer P., Svendsen C. Lentiviral vector-mediated genetic modification of human neural progenitor cells for ex vivo gene therapy. J. Neurosci. Methods. 2007;163:338–349. doi: 10.1016/j.jneumeth.2007.02.022. [DOI] [PubMed] [Google Scholar]
- 69.Zufferey R., Nagy D., Mandel R., Naldini L., Trono D. Multiply attenuated lentiviral vector achieves efficient gene delivery in vivo. Nat. Biotechnol. 1997;15:871–875. doi: 10.1038/nbt0997-871. [DOI] [PubMed] [Google Scholar]
- 70.Zhang X., Huang C., Chen J., Pankratz M., Xi J., Li J., Yang Y., LaVaute T., Li X., Ayala M., et al. Pax6 is a human neuroectoderm cell fate determinant. Cell Stem Cell. 2010;7:90–100. doi: 10.1016/j.stem.2010.04.017. [DOI] [PMC free article] [PubMed] [Google Scholar]
- 71.Howden S., Gore A., Li Z., Fung H., Nisler B., Nie J., Chen G., McIntosh B., Gulbranson D., Diol N., et al. Genetic correction and analysis of induced pluripotent stem cells from a patient with gyrate atrophy. Proc. Natl. Acad. Sci. U. S. A. 2011;108:6537–6542. doi: 10.1073/pnas.1103388108. [DOI] [PMC free article] [PubMed] [Google Scholar]
Associated Data
This section collects any data citations, data availability statements, or supplementary materials included in this article.