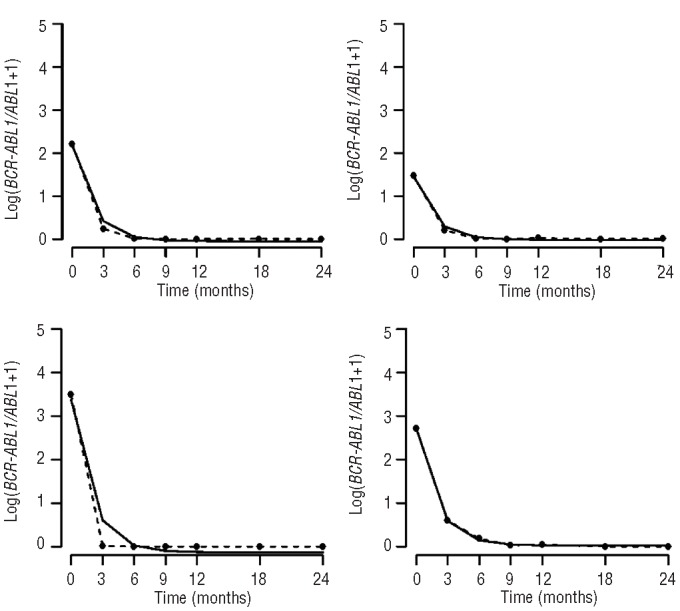
Figure 1.

The high-dose imatinib cohort. The figure shows data from four representative patients from the high-dose imatinib cohort, displaying the ratio of BCR-ABL1 to ABL1 plus one over time measured in months (broken line) as well as the exponential model (solid line).
