

Abstract
Stable isotopes are ideal labels for studying biological processes because they have little or no effect on the biochemical properties of target molecules. The NanoSIMS is a tool that can image the distribution of stable isotope labels with up to 50 nm spatial resolution and with good quantitation. This combination of features has enabled several groups to undertake significant experiments on biological problems in the last decade. Combining the NanoSIMS with other imaging techniques also enables us to obtain not only chemical information but also the structural information needed to understand biological processes. This article describes the methodologies that we have developed to correlate atomic force microscopy and backscattered electron imaging with NanoSIMS experiments to illustrate the imaging of stable isotopes at molecular, cellular, and tissue scales. Our studies make it possible to address 3 biological problems: (1) the interaction of antimicrobial peptides with membranes; (2) glutamine metabolism in cancer cells; and (3) lipoprotein interactions in different tissues.
Keywords: Stable isotope, NanoSIMS, Atomic force microscopy, Backscattered electron imaging, Correlative analysis
1. Introduction
As early as 1935, Schoenheimer et al. [1, 2] started using stable isotopes to study intermediary metabolism. Since then, stable isotope labelling has been used extensively to explore biological processes, often combined with mass spectrometry [3, 4] and Nuclear Magnetic Resonance [5, 6]. One advantage of using stable isotope labelling is that isotopic labels have little or no effect on the biochemical properties of the target molecules, so one can presume that stable isotope–labelled molecules behave in the same way as non-labelled molecules. The ability to carry out quantitative analysis with stable isotope labelling is also useful for fields like proteomics [7, 8]. However, most quantitative measurements of stable isotope ratios use bulk samples that have been extracted from whole tissues, making it impossible to draw conclusions about subcellular compartments or contributions of different cell types. Imaging the precise location of stable isotopes within cells by NanoSIMS can provide direct evidence of the distribution of labelled molecules and allow us to track molecules quantitatively as they interact with specific cells and tissues.
The CAMECA NanoSIMS 50 is a high-resolution secondary ion mass spectrometry (SIMS) instrument which can detect chemical and isotopic distributions with a lateral resolution of 50 nm. The instrument uses a 16 keV primary Cs+ beam to bombard the sample surface and collects at least five selected negative secondary ions using a Mauttach–Herzog mass analyzer with electrostatic sector and asymmetric magnet configuration [9]. The design of the NanoSIMS simultaneously optimizes high spatial resolution, high mass resolution, and high sensitivity, which makes it a powerful tool for studying many types of samples. The sensitivity can allow excellent analysis of species at concentrations of parts per billion for some analytes, which makes it particularly useful in imaging trace elements in cosmochemistry [10, 11], geology [12, 13], and plant science [14, 15]. The excellent mass resolution, m/Δm>4500 with 80% transmission [16], enables quantitative analysis of stable isotopes even when there are close isobaric interferences, such as 12C1H− with 13C−, 12C15N− with 12C14N1H−, and 12C13C1H2− with 13C14N− [17]. Combining these instrumental advantages with stable isotope labelling, NanoSIMS analysis has proven useful for studying biological samples in the last decade. For instance, Thompson et al. [18] identified a symbiosis model between a cyanobacterium and unicellular alga by imaging the exchange of fixed 13C and 15N. Kraft et al. [19] used a NanoSIMS to observe, for the first time, phase separation in lipid mixtures. Lechene et al. [20, 21] studied the fixed nitrogen exchange between host and bacterial cells and quantitatively measured mammalian cardiomyocyte renewal. In biological studies, the most common stable isotopes used to label molecules are 2H, 13C, 15N, and 18O; all are readily imaged by the NanoSIMS [22–25].
Due to the complexity of most biological problems, correlative techniques have been developed to extract as much information as possible from the samples. For instance, instruments have been designed to allow correlative fluorescence microscopy and electron microscopy [26, 27]. Some groups studying biological samples have used NanoSIMS in combination with fluorescence microscopy [28], in situ hybridization techniques [29, 30], transmission electron microscopy (TEM) [20, 31], atomic force microscopy (AFM) [19, 32], synchrotron techniques [14], ICP-MS [31], and electron probe microanalysis [15]. All of these techniques have provided useful information to understand complex biological mechanisms, such as phylogenetic identification of individual cells from fluorescence in situ hybridization [33], extremely sensitive and rapid imaging of trace elements over large areas from synchrotron X-ray fluorescence techniques [34], and subcellular morphology from TEM [20]. The techniques of backscattered electron (BSE) imaging in a scanning electron microscope (SEM) and AFM have been extensively developed in recent years so that they now have new capabilities that can be applied to studies with biological samples. For instance, low-voltage BSE imaging has been applied to study both the morphology of biological materials and to reconstruct 3-D images by tomography [35–37]. The excellent spatial resolution of AFM makes it easy to visualize single molecules [38, 39] and interactions between molecules [40, 41].
This article reports three recent investigations combining analysis in the NanoSIMS with site-specific correlative AFM and BSE imaging. We discuss the critical sample preparation protocols and experimental methods developed for imaging at the molecular, cellular, and tissue scale.
2. Materials and Methods
2.1 Molecule Imaging
Supported lipid bilayers (SLBs) are attractive experimental models for fluid-phase membranes [42, 43] and can be conveniently prepared by well-established techniques.
2.1.1 Sample Preparation
We have studied SLBs prepared from 1,2-dilauroyl-sn-glycero-3-phosphocholine (DLPC) with 1,2- dilauroyl-sn-glycero-3-phosphoglycerol (DLPG) (Avanti Polar Lipids) prepared as described previously [44]. Oxidized silicon substrates (University Wafer) were cut into 0.7-cm2 pieces and ozone-cleaned. The small unilamellar vesicle solution was poured over the substrate in a culture dish and shaken for 2 h to enable lipid bilayer deposition on the surface. The silicon substrates were plunged into a dish of water and shaken for 3 min (three times) to remove excess vesicles. The surface lipid bilayer was then treated with a 10 μM solution of a membrane active peptide, 15N-amhelin (labelled at all alanine and leucine residues and purchased from AnaSpec) for 30 min, then rapidly frozen and freeze dried [44]. Bare lipid bilayers and unlabelled amhelin treated lipid bilayers were prepared as control samples by the same process.
2.1.2 Imaging
The SLBs on oxidized silicon substrates provide flat surfaces for AFM and NanoSIMS imaging of the same areas. Topographic AFM images were recorded with tapping mode AFM on a ParkAFM instrument, using 35 series tips from Mikromasch. 5 μm × 5 μm images were taken on the sample surface, and all AFM images were flattened and processed with Gwyddion 2.30. Imaged regions were located on optical microscope images as a reference for subsequent NanoSIMS analysis.
The same areas were found in the NanoSIMS instrument, and 12C14N− and 12C15N− secondary ions were collected to identify the location of the 15N-amhelin. Ratio images (12C15N−/12C14N−) (10 × 10 μm, 256 × 256 pixels) were collected with a small primary aperture (D1 = 4) to match the pixel size in the images with the incident ion beam diameter (~70 nm). All data were collected without preliminary Cs+ implantation to avoid sputtering away the thin samples [23], and the beam dwell time was set to 8,000 μs/pixel to collect information from surface layers only a few nanometres thick. The images were processed using an ImageJ plugin OpenMIMS software (MIMS, Harvard University; www.nrims.harvard.edu) and processed by a median filter with one-pixel radius. Hue Saturation Images (HSI) were used to present all the stable isotope ratio images in this article.
2.2 Single Cell Imaging
2.2.1 Sample Preparation
The breast cancer MCF7 cell line was provided by Cancer Research UK Cell Services. Cells were cultivated for 16 h in L-Glutamine-free Advanced Dulbecco’s modified Eagle’s medium (DMEM, Gibco) supplemented with 10% fetal bovine serum and 4 mM alpha-15N-L-Glutamine (Cambridge Isotope Laboratories). Cell pellets were fixed in 4% glutaraldehyde in 0.1 M phosphate buffer and processed as for routine electron microscopy. The samples were post-fixed in 2% osmium tetroxide in 0.1 M phosphate buffer, washed in distilled water, and treated with uranyl acetate. Samples were then dehydrated in ethanol and treated with propylene oxide before embedding in Spurr’s epoxy resin. Cells were also cultivated without 15N-glutamine and prepared as controls by the same process.
2.2.2 Imaging
500 nm sections were microtomed with a Diatome diamond knife and mounted on 15-nm platinum coated coverslips for imaging. Areas of interest were recorded by optical microscopy and the sections were then transferred to a Zeiss NVision FIB for imaging using the energy selective backscattered electron detector(EsB) detector. The BSE signal is highly sensitive to atomic number contrast [45], which enables us to image biological samples stained with heavy metals; thus, samples stained with OsO4 (as is common for electron microscopy) are also suitable for BSE imaging. With a low energy incident beam, the interaction volume decreases rapidly [46], which makes low-voltage images extremely surface-sensitive, and in a modern SEM we can achieve a lateral resolution of a few nanometres [47]. The use of low accelerating voltage also reduces the amount of charging and electron beam induced damage to the sample. We have found that 500-nm sections are appropriate for both BSE imaging and NanoSIMS analysis. The use of low accelerating voltages means that the BSE signals are generated from very close to the the section surface, very similar to the volume analysed with NanoSIMS imaging. Here, BSE images were taken with a 2 kV incident beam with a standard aperture (30 μm) and 5 mm working distance. Sections were then coated with 5 nm of platinum in a Cressington 208HR high-resolution sputter coater to render the surface conductive for NanoSIMS imaging. The Cs+ primary beam in the NanoSIMS was first used to remove the platinum on the surface at selected locations, and at the same time implanted a low Cs+ dose of 6.5 × 10¹⁵ atoms/cm2 to ensure that as little as possible of the section surface is removed before imaging. Maintaining the surface sensitivity for both BSE and NanoSIMS imaging is important to ensure that precisely the same material is analysed with both techniques. It is not easy to correlate a surface-sensitive technique and optical fluorescence imaging where the optical signals can originate from different depths in the section.
Small apertures (D1 = 3 or D1 = 4) are used for imaging single cells to match the primary beam size and the pixel size. The instrument was tuned for 12C14N−, 12C15N−, and 31P− ions to give morphological information and allow calculation of the 15N/14N ratio. NanoSIMS images were collected with a dwell time of 30,000 μs/pixel for 256 pixel × 256 pixel images and processed as described earlier. A median filter with radius of 3 pixels is applied to the HSI images. The BSE and NanoSIMS images can be aligned, and the local ratio of 15N/14N can be measured quantitatively by ImageJ.
2.3 Tissue Imaging
2.3.1 Sample Preparation
Gpihbp1+/+ and Gpihbp1−/− mice were administered a mixture of 13C-labeled Algal fatty acids (Sigma 487937) by gavage. The labelled fatty acids (120 μg) were dissolved in 200 μl of ethanol and 1.7 ml sunflower oil; 200 μl of the suspension was administered to mice twice per day for four consecutive days. The tissues were then perfusion-fixed in situ with 2.5% glutaraldehyde containing 2 mM MgCl2 in 100 mM cacodylate buffer (pH 7.4) and incubated in the fixation solution at 4° C overnight. On the following day, the tissues were incubated in an equal volume of 1% osmium tetroxide and washed three times in distilled water (10 min each). Samples were then treated with 1.2% aqueous uranyl acetate overnight at 4° C in the dark. The samples were sequentially dehydrated with increasing concentrations of acetone (20, 30, 50, 70, 90, and 100%) for 30 min each, followed by three additional treatments with 100% acetone for 20 min each. Samples were then infiltrated with increasing concentrations of Spurr’s resin (25% for 1 h, 50% for 1 h, 75% for 1 h, 100% for 1 h, 100% overnight at room temperature), and then incubated overnight at 70° C in a resin mould. 500 nm thick sections were cut with a Diatome diamond knife on an Ultramicrotome. The sections were placed on a 15 nm platinum coated coverslip and left to dry.
Samples were also prepared to investigate the binding of lipoproteins to capillary endothelial cells. Endogenously 13C-labelled triglyceride-rich lipoproteins (TRLs) were harvested from Gpihbp1−/− mice after delivering a mixture of 13C-labeled Algal fatty acids (Sigma 487937) by gavage. TRLs were isolated by ultracentrifugation, and 50 μg was injected into a wild-type mouse. The TRLs were injected intravenously via the tail vein and left for 1 h before being perfusion-fixed, and tissues were isolated by the same process as above. Tissues from mice without 13C-treatment were prepared as controls by the same process.
2.3.2 Imaging
BSE images were taken in a Zeiss NVision FIB under the same conditions as for the single-cell imaging studies described earlier. All of the BSE-imaged areas were also studied by NanoSIMS to allow direct correlation of the chemical information with ultra-structural features of the cell. 40 μm × 40 μm NanoSIMS images were recorded to study reasonably large areas of sections from brown adipose tissue (BAT) and heart tissue, and 10 μm × 10 μm images were taken to show the subcellular distributions in selected areas. The 13C/12C ratio was used to reveal the distribution of 13C-labeled lipids; the 16O−, 12C14N−, and 31P− signals were also collected to show tissue morphology. A large primary aperture (D1 = 2) was used to acquire images (40 × 40 μm, 256 × 256 pixels) on brown adipose tissue, and a smaller primary aperture (D1 = 3 or D1 = 4) was used to achieve higher spatial resolution images of capillaries in heart or brown adipose tissue. The 13C/12C HSIs were also processed by the OpenMIMS plugin in ImageJ software, and processed by a median filter with a three-pixel radius.
3. Results and Discussion
3.1 Selecting the Cs+ dose in stable isotope Imaging
The Cs+ source in the NanoSIMS sputters the sample surface to generate the ionized signals to form the elemental images, but at the same time implants caesium into the sample. To achieve reliable quantification of stable isotopes and to obtain sufficiently high signals for imaging, pre-imaging implantation is needed because the yield of secondary ions depends on the surface concentration of Cs [9]. Fig. 1 shows how the counts for 12C− and 12C14N− vary as a function of Cs+ dose on a 5 nm platinum-coated 500 nm section of heart tissue sample with a primary ion beam current of 1.3 pA and 5 μm raster size. Both 12C− and 12C14N− signals started high due to contamination on the surface of the platinum coating. The 12C14N− signal stabilises immediately after sputtering away the platinum coating at a primary ion dose of about 5 × 10¹⁵ atoms/cm2. This rapid stabilization enables imaging of the top surface of the sample for tracking 15N-labelled molecule distribution in the same material imaged in the AFM. This also makes it possible to conduct correlative BSE and 15N/14N NanoSIMS analysis of a very similar imaging volume. The primary ion dose required for reliable analysis of 13C− and 12C− was set to about 6.5 × 10¹⁶ ions/cm2 to ensure steady state for the 12C− signal. All experiments in this report were designed to use as-low-as-possible primary ion dose to achieve both reliable quantification and similar imaging volume for correlative analysis.
Figure 1.
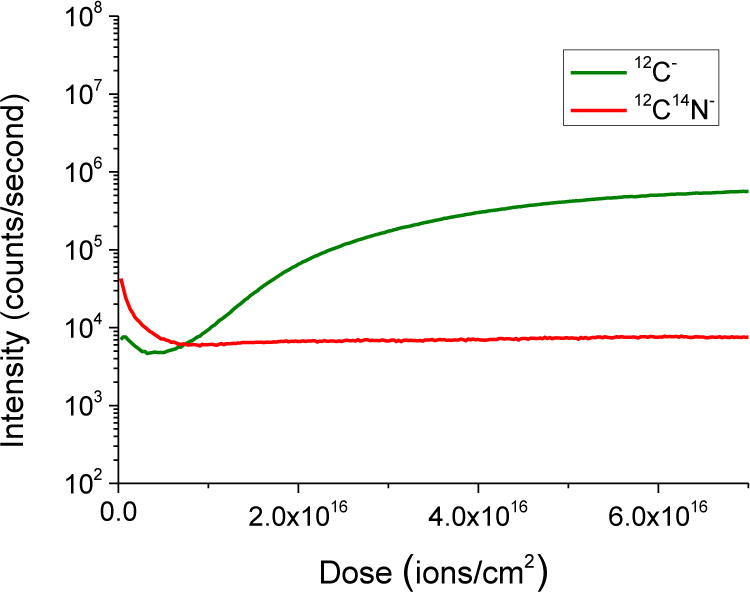
Depth profile of 12C− and 12C14N− on a 500 nm section coated with 5 nm of platinum
3.2 Interactions of Antimicrobial Peptides and Membranes
Antimicrobial peptides are ubiquitous effector molecules of the innate immune system of all multicellular organisms [48]. The peptides modulate immune responses by targeting microorganisms in a nonspecific manner. They disrupt microbial phospholipid membranes which inevitably leads to cell leakage and death [49]. Several mechanistic models have been proposed for antimicrobial action, including the formation of barrel-stave pores [50], torroidal pores [51], and carpet-like modes [52]. However, direct observation of these fundamental processes has not been obtained. This section demonstrates the application of correlative AFM and NanoSIMS analysis to directly image interactions between antimicrobial peptides and phospholipid membranes. These experiments were designed to simulate molecular interactions on a flat surface so that AFM results could confirm the topology of the structures formed, and NanoSIMS stable isotope imaging could provide direct evidence for the distribution of labelled molecules. A de novo peptide was designed as an archetypal antimicrobial sequence capable of inserting into phospholipid bilayers in a transmembrane manner, and promoting pore formation. The peptide, dubbed an antimicrobial helix insert (amhelin), was 15N-labelled and was applied to lipid bilayers (SLBs).
The freeze-dried 15N-amhelin treated samples were imaged by both AFM and NanoSIMS. Bare SLBs were used as controls, showing a featureless surface with the ‘natural abundance’ 15N/14N ratio of 0.37% (Fig. S1a). The unlabelled amhelin treated membrane surface shows pore-like and filament-like features in the 12C14N− image (Fig. S1b), and a natural 15N/14N ratio of 0.37% was again calculated from the low signals from 12C15N− ions. On the 15N-amhelin treated surfaces, AFM revealed similar pore-like structures of different diameters (average diameter 2.7 μm ± 1.3 μm) and filament-like features (Fig. 2a), and showed an average step height at the pore edges of 3–4 nm, consistent with the long axis of the peptide molecule, 3.2 nm [44]. NanoSIMS analysis confirms that these features are formed by the labelled peptide since we measure locally both higher 12C14N− and 12C15N− signals (Fig. S2) and high 15N/14N ratios. From the NanoSIMS data, 15N/14N ratios at the edges of each pore were consistently higher than the ratio inside pores (with diameters between 0.7 and 8.3 μm) (Fig. 2c). Peptide-rich filament-like features running across the surfaces and connecting individual pores could also be seen in both AFM and NanoSIMS images, which suggests that peptide molecules may migrate across the SLB surface (Fig. 2b). These results provide the first direct evidence of pore formation by antimicrobial peptides and indicates that pores can expand laterally at the nano-to-micrometer scale leading eventually to complete membrane disintegration [44].
Figure 2. Correlative AFM and NanoSIMS imaging on molecular interactions.
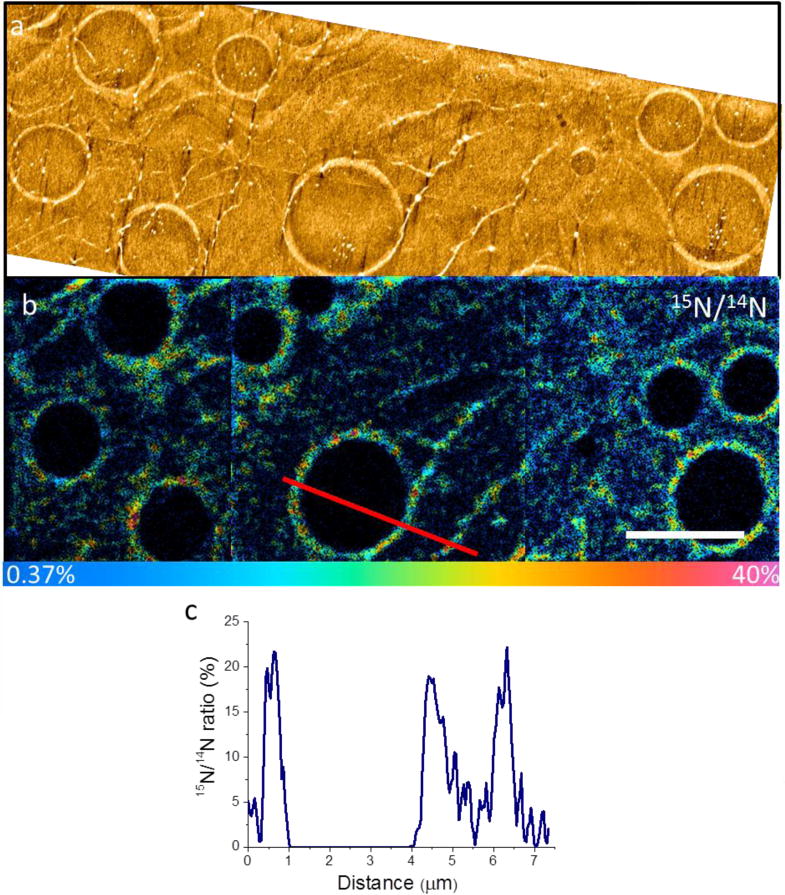
(a) AFM images of 15N-amhelin treated lipid bilayers show pores on the surface and filamentary features running across the surface connecting the pore structures. (b) HSI NanoSIMS images from the same area showing that the edges of the pores have a high 15N/14N ratio, confirming that the pores result from 15N-amhelin. (c) Line scan across a pore in the 15N/14N ratio image (marked in Fig. 1b) reveals a high 15N/14N ratio (20% versus 0.37% for natural abundance), which proves a high local concentration of 15N-amhelin. Scale bar, 4 μm. Colour scale of 15N/14N image: 0–40%.
3.3 Glutamine Metabolism in Single Cancer Cells
As the most abundant free amino acid in the human body, glutamine is known to be an important nutrient for cancer growth [53–55]. Glutamine is critical to cancer cells, as it is not only a nitrogen source for protein and nucleotide synthesis, but is also important for uptake of essential amino acids and for maintaining mitochondrial membrane potential and integrity [56]. A thorough understanding of glutamine metabolism could help develop new approaches to treat cancer, and many scientists working in this area are using mass spectrometry [57], NMR spectroscopy [58], and various other methodologies [59–61]. This section reports a new correlative approach using BSE imaging and NanoSIMS analysis which can image the metabolites on a subcellular level, enabling quantitative measurement of the uptake of labelled molecules by specific organelles.
Typical data from MCF7 cells exposed to 15N-glutamine are shown in Figure 3. Organelles are revealed clearly in the BSE images (Fig. 3a), which can then be used to identify the location of chemical information in the NanoSIMS image (Fig. 3b), which reveals incorporation of 15N. Cells exposed to the cell culture without 15N-glutamine were imaged as controls. Fig. S3 shows the expected homogenous 15N/14N ratio at natural abundance in a control cell. The 12C14N− and 31P− images also show the nucleolus, nuclear membrane, and cytoplasm (Fig. S3), but other organelles are not easily recognisable in the NanoSIMS images. In this case, BSE imaging can be used to identify subcellular structures, such as ER, Golgi, and mitochondria, which can be used to correlate with the chemical information obtained from NanoSIMS.
Figure 3. Correlative BSE and NanoSIMS imaging on single cells.
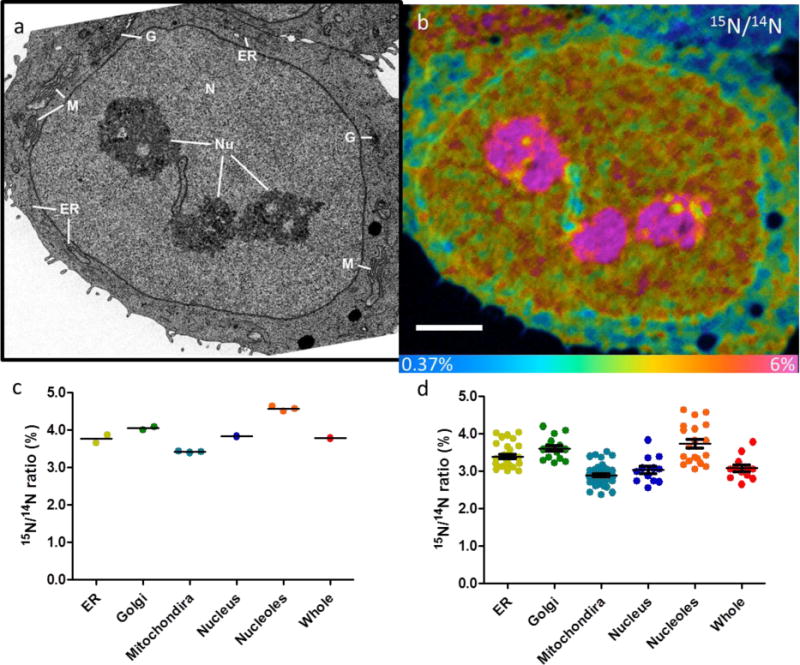
(a) BSE image of a typical MCF7 cell exposed to 15N-glutamine for 24 h. The individual organelles are identified with white lines: nucleolus (Nu), nucleus (N), Golgi (G), endoplasmic reticulum (ER), and mitochondria (M). (b) 15N/14N HSI NanoSIMS image of the same cell enables quantitative measurement of the 15N/14N ratio in specific organelles. (c) 15N/14N ratio in different organelles of the cell: nucleolus (4.6%), nucleus (3.8%), Golgi (4.0%), ER (3.8%), and mitochondrion (3.4%). The average ratio of the whole cell is 3.7%. (d) Statistical analysis of 10 single cells showing 15N/14N ratios in the nucleolus (3.7% ± 0.5%), nucleus (3.0% ± 0.4%), Golgi (3.6% ± 0.3%), ER (3.4% ± 0.2%), and mitochondria (2.9% ± 0.3%). Scale bar, 3 μm. Colour scale of 15N/14N ratio image: 0.37–6%.
The images in Figure 3 show that the nucleolus is heavily labelled with 15N; the 15N/14N ratio is about 4.6% after 16 h, more than ten times higher than the natural abundance of 15N. There is also heavy labelling of the nucleus, Golgi, and ER (Fig. 3c). Analysis of tens of cells has shown 15N/14N ratios of about 3.0% ± 0.5%, 3.6% ± 0.3%, 3.4% ± 0.3% in the nucleus, Golgi, and ER, respectively (Fig. 3d). The turnover speed in specific organelles can also be measured by studying cells exposed to the labelled glutamine for different periods under different conditions in conventional pulse-chase experiments.
3.4 Tracking Lipid in Tissues
BSE imaging can achieve resolutions of a few nanometres but also record structural information from large areas, as shown by recent work on brain tissue (which extended to hundreds of micrometres) [62, 63]. The NanoSIMS also has the ability to scan relatively large areas for isotopic distributions [21], which makes studies with both techniques suitable for analysing tissue samples. Glycosylphosphatidylinositol-anchored high density lipoprotein binding protein-1 (GPIHBP1) was identified by Beigneux et al. [64] as a critical protein in the lipolytic processing of triglyceride-rich lipoproteins (TRLs); they showed that GPIHBP1 transports lipoprotein lipase (LPL) from the subendothelial spaces to its site of action in the capillary lumen [65]. Gpihbp1-deficiency results in mislocalization of LPL, severe hypertriglyceridemia [66], and reduced delivery of dietary-derived lipids to parenchymal cells [64]. We have used NanoSIMS and BSE analysis to study lipid transport in wild-type mice and Gpihbp1 knockout (Gpihbp1−/−) mice.
The low-magnification NanoSIMS 12C14N− image (Fig. 4a) from a selected 40 μm × 40 μm area of BAT in a wild-type mouse shows lipid droplets, parenchymal cells, and capillaries. The 13C/12C HSI image (Fig. 4b) clearly shows lipid droplets labelled by 13C after the mouse was fed with 13C-lipids for 4 days. NanoSIMS images on BAT tissue from a control mouse not fed with the 13C diet are shown in Fig. S4, showing (as expected) the 1.1% natural abundance of 13C over the whole area. The most valuable feature of parallel BSE analysis of these samples is to use the higher-image resolution and extremely rapid image acquisition to screen for the most important areas to study by slower NanoSIMS imaging. For instance, features like the particle in an endothelial cell (Fig. 4d) can be imaged by BSE, and NanoSIMS analysis (Fig. 4c) can then be used to show that this particle (~400 nm in diameter) is labelled by 13C. A line scan through the particle shows the 13C/12C ratio is about 1.75%, 59% above natural abundance. The ability to perform quantitative analysis in the NanoSIMS has been used to quantify 13C/12C ratios in many lipid droplets in BAT sections. The 13C/12C ratios were measured in ImageJ by manually drawing areas of interest around single lipid droplets, and the average ratio from the brown adipose tissue lipid droplets in Gpihbp1+/+ samples is 1.8% ± 0.08%, 63.6% above the natural value of 1.1%. Gpihbp1−/− mouse samples show a ratio of 1.2% ± 0.03%, only 9% above natural values (Fig. 4e). Figure 4 shows a direct and quantitative effect of Gpihbp1 deficiency on the efficiency with which dietary lipids are delivered to cytosolic lipid droplets in brown adipose tissue.
Figure 4. Correlative BSE and NanoSIMS imaging on tissue samples.
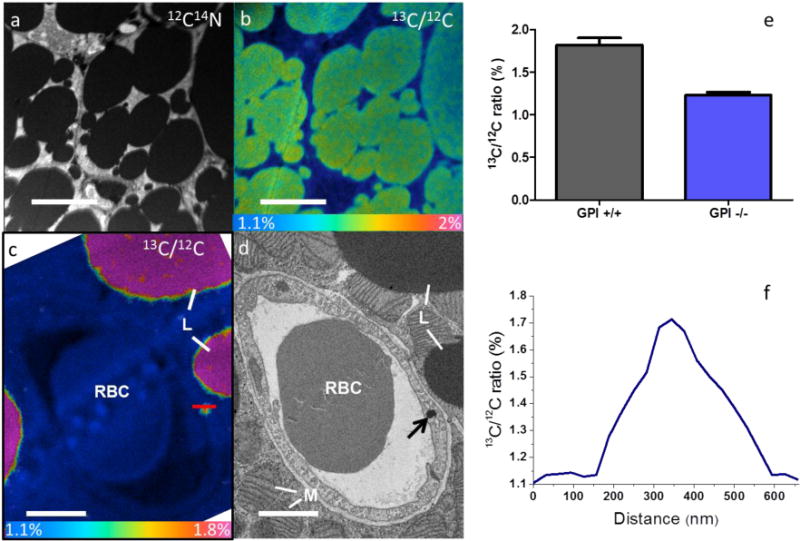
(a) Low-magnification 12C14N− NanoSIMS image of a 40 μm × 40 μm area of brown adipose tissue from a wild-type mouse after 4 days of feeding with 13C-lipids. (b) 13C/12C HSI image from the same area. (c) High-magnification NanoSIMS 13C/12C HSI image of a capillary in the brown adipose tissue from a wild-type mouse after 4 days of feeding with 13C-lipids. Highlighted line corresponds to the data in (f). (d) BSE images of the same capillary. The red blood cell (RBC), mitochondrion (M), and lipid droplet (L) are identified in the image. Arrow identifies the particle scanned in (f). (e) Quantitative analysis of the 13C/12C ratio in lipid droplets in brown adipose tissue from Gpihbp1+/+ and Gpihbp1−/− mice. (f) Line scan across the labelled ~400-nm dark particle with 13C/12C ratio of 1.7%. Scale bars in (a, b), 10 μm; (c, d), 2 μm. Colour scale of 13C/12C ratio images: (b) 1.1–2.0%; (c) 1.1–1.8%.
Heart tissue of a wild-type mouse was also imaged to study the binding of TRLs to capillary endothelial cells (“margination”), an important step in the lipolytic processing of triglyceride-rich lipoproteins [67]. NanoSIMS images of the mouse heart treated without 13C-labelled lipids show the expected natural 13C/12C ratio in the capillaries and cardiomyocytes (Fig. S5). Fig. 5a is a BSE montage of a 165 μm × 70 μm area showing cardiomyocytes and capillaries in a wild-type mouse heart. Higher magnification BSE images revealing stained particles along the luminal side of capillaries which can then be selected for detailed analysis (Fig. 5b and Fig. 5d). These two areas were identified from about 25 capillaries quickly imaged by BSE on the larger area to show rare examples of lipoprotein margination 1 hour after intravenous injection of TRLs. NanoSIMS analysis on these same areas (Fig. 5c and 5e) was carried out after BSE screening, and shows that the stained particles are labelled with 13C, establishing that they are the 13C-lipoproteins injected into the mouse. The correlative NanoSIMS 13C/12C images and BSE images (Fig. 5b–e) reveal that some 13C-labelled lipids have reached the parenchymal cells. These results provide direct evidence for the entry of dietary lipids into lipid droplets in adipocytes as well as direct observation of lipoprotein margination along the luminal side of heart capillaries and the transport of the lipid to cardiomyocytes.
Figure 5.
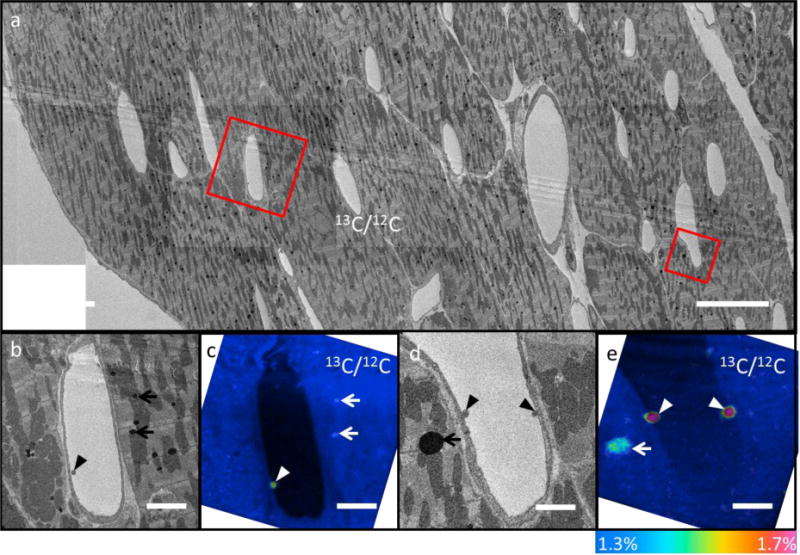
(a) Low-magnification BSE image of a selected 165 μm × 70 μm area in the heart of a wild-type mouse which had been injected with 13C-labeled TRLs 1 h earlier. (b, d) High-magnification BSE images of selected capillaries [boxed areas in (a)] showing dark particles (TRLs) along the luminal side of the capillary endothelial cells (arrowhead) or within the muscle cell (arrows). (c, e) 13C/12C NanoSIMS images from the same capillaries show that the darkly stained particles are labelled by 13C. White arrows identify labelled TRLs at the luminal surface of capillaries (arrowhead) and labelled lipid droplets in parenchymal cells (arrows). Scale bars: (a) 15 μm; (b, c) 3 μm; (d, e) 1.4 μm. Colour scale 13C/12C ratio images: (c, e) 1.3–1.7%.
4. Conclusions
This article reports three applications of high-resolution stable isotope imaging with NanoSIMS where complementary techniques have been important in interpreting the SIMS data. Experiments have been carefully designed to ensure the imaged volumes with the selected techniques are as similar as possible so that we can be sure that the data from the different techniques is from exactly the same structures and organelles. AFM and NanoSIMS imaging on flat substrates can show topographic and chemical information to reveal the interaction mechanisms of antimicrobial peptides with lipid bilayers; correlative BSE and NanoSIMS imaging provides structural and isotopic information to study both glutamine metabolism in single cells and the uptake of labelled lipids in tissue samples. The three applications discussed here are just a few examples of the ability of correlative imaging techniques to study important topics in biological systems.
Supplementary Material
Acknowledgments
We thank Dr. Katie Moore and Mr. Clive Downing for suggestions on the NanoSIMS experiments; Dr. Sverre Myhra for suggestions on AFM experiments; Dr. Jean-Nicolas Audinot and Mr. Patrick Grysan for help on the correlative AFM and NanoSIMS imaging; Dr. Errin Johnson for suggestions on EM sample preparation; and Dr. Angelica Tatar for assistance in carrying out animal experiments. H. J is supported by a scholarship from the China Scholarship Council. L.G.F and S.G.Y are supported by grants from the NIH (HL090553, HL087228) and a Leducq Transatlantic Network Grant (12CVD04). C.G is supported by a postdoctoral fellowship from the American Heart Association, Western States Affiliate. P.D.R. and M.G.R. acknowledge funding from the United Kingdom’s Department of Business, Innovation and Skills, and the European Metrology Research Programme Grant HLT10.
References
- 1.Schoenheimer R, Rittenberg D. Deuterium as an indicator in the study of intermediary metabolism. Science. 1935;82(2120):156–157. doi: 10.1126/science.82.2120.156. [DOI] [PubMed] [Google Scholar]
- 2.Schoenheimer R, Rittenberg D. The application of isotopes to the study of intermediary metabolism. Science. 1938;87(2254):221–226. doi: 10.1126/science.87.2254.221. [DOI] [PubMed] [Google Scholar]
- 3.Zhang H, Li X-j, Martin DB, Aebersold R. Identification and quantification of N-linked glycoproteins using hydrazide chemistry, stable isotope labeling and mass spectrometry. Nature biotechnology. 2003;21(6):660–666. doi: 10.1038/nbt827. [DOI] [PubMed] [Google Scholar]
- 4.Keshishian H, Addona T, Burgess M, Mani D, Shi X, Kuhn E, Sabatine MS, Gerszten RE, Carr SA. Quantification of cardiovascular biomarkers in patient plasma by targeted mass spectrometry and stable isotope dilution. Molecular & cellular proteomics. 2009;8(10):2339–2349. doi: 10.1074/mcp.M900140-MCP200. [DOI] [PMC free article] [PubMed] [Google Scholar]
- 5.Fan TW, Lane AN. NMR-based stable isotope resolved metabolomics in systems biochemistry. Journal of biomolecular NMR. 2011;49(3–4):267–280. doi: 10.1007/s10858-011-9484-6. [DOI] [PMC free article] [PubMed] [Google Scholar]
- 6.Skrisovska L, Schubert M, Allain FHT. Recent advances in segmental isotope labeling of proteins: NMR applications to large proteins and glycoproteins. Journal of biomolecular NMR. 2010;46(1):51–65. doi: 10.1007/s10858-009-9362-7. [DOI] [PubMed] [Google Scholar]
- 7.Tao WA, Aebersold R. Advances in quantitative proteomics via stable isotope tagging and mass spectrometry. Current opinion in biotechnology. 2003;14(1):110–118. doi: 10.1016/s0958-1669(02)00018-6. [DOI] [PubMed] [Google Scholar]
- 8.Boersema PJ, Raijmakers R, Lemeer S, Mohammed S, Heck AJ. Multiplex peptide stable isotope dimethyl labeling for quantitative proteomics. Nature protocols. 2009;4(4):484–494. doi: 10.1038/nprot.2009.21. [DOI] [PubMed] [Google Scholar]
- 9.Van Tendeloo G, Van Dyck D, Pennycook SJ. Handbook of Nanoscopy. Vol. 1. Wiley. com; 2012. [Google Scholar]
- 10.Messenger S, Keller LP, Stadermann FJ, Walker RM, Zinner E. Samples of stars beyond the solar system: Silicate grains in interplanetary dust. Science. 2003;300(5616):105–108. doi: 10.1126/science.1080576. [DOI] [PubMed] [Google Scholar]
- 11.Hoppe P. NanoSIMS: A new tool in cosmochemistry. Applied Surface Science. 2006;252(19):7102–7106. [Google Scholar]
- 12.Kilburn MR, Wacey D. STROMATOLITES: Interaction of Microbes with Sediments. Springer; 2011. Elemental and isotopic analysis by NanoSIMS: insights for the study of stromatolites and early life on Earth; pp. 463–493. [Google Scholar]
- 13.Wacey D, Kilburn MR, McLoughlin N, Parnell J, Stoakes CA, Grovenor CR, Brasier MD. Use of NanoSIMS in the search for early life on Earth: ambient inclusion trails in a c. 3400 Ma sandstone. Journal of the Geological Society. 2008;165(1):43–53. [Google Scholar]
- 14.Moore KL, Schröder M, Lombi E, Zhao FJ, McGrath SP, Hawkesford MJ, Shewry PR, Grovenor CRM. NanoSIMS analysis of arsenic and selenium in cereal grain. New Phytologist. 2010;185(2):434–445. doi: 10.1111/j.1469-8137.2009.03071.x. [DOI] [PubMed] [Google Scholar]
- 15.Smart K, Kilburn M, Salter C, Smith J, Grovenor C. NanoSIMS and EPMA analysis of nickel localisation in leaves of the hyperaccumulator plant< i> Alyssum lesbiacum</i>. International Journal of Mass Spectrometry. 2007;260(2):107–114. [Google Scholar]
- 16.Cameca. NanoSIMS50 biology application booklet. 2009 [Google Scholar]
- 17.McMahon G, Saint-Cyr HF, Lechene C, Unkefer CJ. CN-secondary ions form by recombination as demonstrated using multi-isotope mass spectrometry of 13C- and 15N-labeled polyglycine. Journal of the American Society for Mass Spectrometry. 2006;17(8):1181–1187. doi: 10.1016/j.jasms.2006.04.031. [DOI] [PubMed] [Google Scholar]
- 18.Thompson AW, Foster RA, Krupke A, Carter BJ, Musat N, Vaulot D, Kuypers MM, Zehr JP. Unicellular cyanobacterium symbiotic with a single-celled eukaryotic alga. Science. 2012;337(6101):1546–1550. doi: 10.1126/science.1222700. [DOI] [PubMed] [Google Scholar]
- 19.Kraft ML. Phase Separation of Lipid Membranes Analyzed with High-Resolution Secondary Ion Mass Spectrometry. Science. 2006;313(5795):1948–1951. doi: 10.1126/science.1130279. [DOI] [PubMed] [Google Scholar]
- 20.Lechene CP, Luyten Y, McMahon G, Distel DL. Quantitative Imaging of Nitrogen Fixation by Individual Bacteria Within Animal Cells. Science. 2007;317(5844):1563–1566. doi: 10.1126/science.1145557. [DOI] [PubMed] [Google Scholar]
- 21.Senyo SE, Steinhauser ML, Pizzimenti CL, Yang VK, Cai L, Wang M, Wu TD, Guerquin-Kern JL, Lechene CP, Lee RT. Mammalian heart renewal by pre-existing cardiomyocytes. Nature. 2012 doi: 10.1038/nature11682. [DOI] [PMC free article] [PubMed] [Google Scholar]
- 22.Lechene CP, Lee GY, Poczatek JC, Toner M, Biggers JD. 3D Multi-isotope Imaging Mass Spectrometry Reveals Penetration of 18O-Trehalose in Mouse Sperm Nucleus. PloS one. 2012;7(8):e42267. doi: 10.1371/journal.pone.0042267. [DOI] [PMC free article] [PubMed] [Google Scholar]
- 23.Kraft ML, Fishel SF, Marxer CG, Weber PK, Hutcheon ID, Boxer SG. Quantitative analysis of supported membrane composition using the NanoSIMS. Applied Surface Science. 2006;252(19):6950–6956. [Google Scholar]
- 24.Römer W, Wu TD, Duchambon P, Amessou M, Carrez D, Johannes L, Guerquin-Kern JL. Sub-cellular localisation of a 15N-labelled peptide vector using NanoSIMS imaging. Applied Surface Science. 2006;252(19):6925–6930. [Google Scholar]
- 25.Wilson RL, Frisz JF, Hanafin WP, Carpenter KJ, Hutcheon ID, Weber PK, Kraft ML. Fluorinated colloidal gold immunolabels for imaging select proteins in parallel with lipids using high-resolution secondary ion mass spectrometry. Bioconjugate chemistry. 2012;23(3):450–460. doi: 10.1021/bc200482z. [DOI] [PMC free article] [PubMed] [Google Scholar]
- 26.van Rijnsoever C, Oorschot V, Klumperman J. Correlative light-electron microscopy (CLEM) combining live-cell imaging and immunolabeling of ultrathin cryosections. Nature methods. 2008;5(11):973–980. doi: 10.1038/nmeth.1263. [DOI] [PubMed] [Google Scholar]
- 27.Giepmans BN, Deerinck TJ, Smarr BL, Jones YZ, Ellisman MH. Correlated light and electron microscopic imaging of multiple endogenous proteins using Quantum dots. Nature methods. 2005;2(10):743–749. doi: 10.1038/nmeth791. [DOI] [PubMed] [Google Scholar]
- 28.Lau KH, Christlieb M, SchrÖDer M, Sheldon H, Harris AL, Grovenor CRM. Development of a new bimodal imaging methodology: a combination of fluorescence microscopy and high-resolution secondary ion mass spectrometry. Journal of Microscopy. 2010;240(1):21–31. doi: 10.1111/j.1365-2818.2010.03380.x. [DOI] [PubMed] [Google Scholar]
- 29.Behrens S, Losekann T, Pett-Ridge J, Weber PK, Ng WO, Stevenson BS, Hutcheon ID, Relman DA, Spormann AM. Linking microbial phylogeny to metabolic activity at the single-cell level by using enhanced element labeling-catalyzed reporter deposition fluorescence in situ hybridization (EL-FISH) and NanoSIMS. Applied and Environmental Microbiology. 2008;74(10):3143. doi: 10.1128/AEM.00191-08. [DOI] [PMC free article] [PubMed] [Google Scholar]
- 30.Fike DA, Gammon CL, Ziebis W, Orphan VJ. Micron-scale mapping of sulfur cycling across the oxycline of a cyanobacterial mat: a paired nanoSIMS and CARD-FISH approach. The ISME journal. 2008;2(7):749–759. doi: 10.1038/ismej.2008.39. [DOI] [PubMed] [Google Scholar]
- 31.Moore KL, Schröder M, Wu Z, Martin BG, Hawes CR, McGrath SP, Hawkesford MJ, Ma JF, Zhao FJ, Grovenor CR. High-resolution secondary ion mass spectrometry reveals the contrasting subcellular distribution of arsenic and silicon in rice roots. Plant Physiology. 2011;156(2):913–924. doi: 10.1104/pp.111.173088. [DOI] [PMC free article] [PubMed] [Google Scholar]
- 32.Anderton CR, Lou K, Weber PK, Hutcheon ID, Kraft ML. Correlated AFM and NanoSIMS imaging to probe cholesterol-induced changes in phase behavior and non-ideal mixing in ternary lipid membranes. Biochimica et Biophysica Acta (BBA)-Biomembranes. 2010 doi: 10.1016/j.bbamem.2010.09.016. [DOI] [PubMed] [Google Scholar]
- 33.Amann R, Fuchs BM. Single-cell identification in microbial communities by improved fluorescence in situ hybridization techniques. Nature Reviews Microbiology. 2008;6(5):339–348. doi: 10.1038/nrmicro1888. [DOI] [PubMed] [Google Scholar]
- 34.Moore KL, Chen Y, Meene AM, Hughes L, Liu W, Geraki T, Mosselmans F, McGrath SP, Grovenor C, Zhao FJ. Combined NanoSIMS and synchrotron X-ray fluorescence reveal distinct cellular and subcellular distribution patterns of trace elements in rice tissues. New Phytologist. 2014;201(1):104–115. doi: 10.1111/nph.12497. [DOI] [PubMed] [Google Scholar]
- 35.Helmstaedter M, Briggman KL, Turaga SC, Jain V, Seung HS, Denk W. Connectomic reconstruction of the inner plexiform layer in the mouse retina. Nature. 2013;500(7461):168–174. doi: 10.1038/nature12346. [DOI] [PubMed] [Google Scholar]
- 36.Lichtman JW, Livet J, Sanes JR. A technicolour approach to the connectome. Nature Reviews Neuroscience. 2008;9(6):417–422. doi: 10.1038/nrn2391. [DOI] [PMC free article] [PubMed] [Google Scholar]
- 37.Denk W, Horstmann H. Serial block-face scanning electron microscopy to reconstruct three-dimensional tissue nanostructure. PLoS biology. 2004;2(11):e329. doi: 10.1371/journal.pbio.0020329. [DOI] [PMC free article] [PubMed] [Google Scholar]
- 38.Roiter Y, Minko S. AFM single molecule experiments at the solid-liquid interface: in situ conformation of adsorbed flexible polyelectrolyte chains. Journal of the American Chemical Society. 2005;127(45):15688–15689. doi: 10.1021/ja0558239. [DOI] [PubMed] [Google Scholar]
- 39.Katan AJ, Dekker C. High-speed AFM reveals the dynamics of single biomolecules at the nanometer scale. Cell. 2011;147(5):979–982. doi: 10.1016/j.cell.2011.11.017. [DOI] [PubMed] [Google Scholar]
- 40.Shinozaki Y, Sumitomo K, Tsuda M, Koizumi S, Inoue K, Torimitsu K. Direct observation of ATP-induced conformational changes in single P2X4 receptors. PLoS biology. 2009;7(5):e1000103. doi: 10.1371/journal.pbio.1000103. [DOI] [PMC free article] [PubMed] [Google Scholar]
- 41.Müller DJ, Dufrene YF. Atomic force microscopy as a multifunctional molecular toolbox in nanobiotechnology. Nature nanotechnology. 2008;3(5):261–269. doi: 10.1038/nnano.2008.100. [DOI] [PubMed] [Google Scholar]
- 42.Castellana ET, Cremer PS. Solid supported lipid bilayers: From biophysical studies to sensor design. Surface Science Reports. 2006;61(10):429–444. doi: 10.1016/j.surfrep.2006.06.001. [DOI] [PMC free article] [PubMed] [Google Scholar]
- 43.Richter RP, Bérat R, Brisson AR. Formation of solid-supported lipid bilayers: an integrated view. Langmuir. 2006;22(8):3497–3505. doi: 10.1021/la052687c. [DOI] [PubMed] [Google Scholar]
- 44.Rakowska PD, Jiang H, Ray S, Pyne A, Lamarre B, Carr M, Judge PJ, Ravi J, Gerling UI, Koksch B. Nanoscale imaging reveals laterally expanding antimicrobial pores in lipid bilayers. Proceedings of the National Academy of Sciences. 2013;110(22):8918–8923. doi: 10.1073/pnas.1222824110. [DOI] [PMC free article] [PubMed] [Google Scholar]
- 45.Lloyd GE. Atomic number and crystallographic contrast images with the SEM: a review of backscattered electron techniques. Mineralogical Magazine. 1987;51(359):3–19. [Google Scholar]
- 46.Joy DC, Joy CS. Low voltage scanning electron microscopy. Micron. 1996;27(3):247–263. [Google Scholar]
- 47.WINTER D, DE M, SCHNEIJDENBERG C, LEBBINK M, LICH B, VERKLEIJ A, DRURY M, HUMBEL B. Tomography of insulating biological and geological materials using focused ion beam (FIB) sectioning and low-kV BSE imaging. Journal of Microscopy. 2009;233(3):372–383. doi: 10.1111/j.1365-2818.2009.03139.x. [DOI] [PubMed] [Google Scholar]
- 48.Fjell CD, Hancock RE, Cherkasov A. AMPer: a database and an automated discovery tool for antimicrobial peptides. Bioinformatics. 2007;23(9):1148–1155. doi: 10.1093/bioinformatics/btm068. [DOI] [PubMed] [Google Scholar]
- 49.Zasloff M. Antimicrobial peptides of multicellular organisms. Nature. 2002;415(6870):389–395. doi: 10.1038/415389a. [DOI] [PubMed] [Google Scholar]
- 50.Yang L, Harroun TA, Weiss TM, Ding L, Huang HW. Barrel-stave model or toroidal model? A case study on melittin pores. Biophysical Journal. 2001;81(3):1475–1485. doi: 10.1016/S0006-3495(01)75802-X. [DOI] [PMC free article] [PubMed] [Google Scholar]
- 51.Matsuzaki K, Murase O, Fujii N, Miyajima K. An antimicrobial peptide, magainin 2, induced rapid flip-flop of phospholipids coupled with pore formation and peptide translocation. Biochemistry. 1996;35(35):11361–11368. doi: 10.1021/bi960016v. [DOI] [PubMed] [Google Scholar]
- 52.Pouny Y, Rapaport D, Mor A, Nicolas P, Shai Y. Interaction of antimicrobial dermaseptin and its fluorescently labeled analogs with phospholipid membranes. Biochemistry. 1992;31(49):12416–12423. doi: 10.1021/bi00164a017. [DOI] [PubMed] [Google Scholar]
- 53.Lu W, Pelicano H, Huang P. Cancer Metabolism: Is Glutamine Sweeter than Glucose? Cancer Cell. 2010;18(3):199–200. doi: 10.1016/j.ccr.2010.08.017. [DOI] [PMC free article] [PubMed] [Google Scholar]
- 54.Medina MA. Glutamine and Cancer. Journal of Nutrition. 2001;131(9):2539S–2542S. doi: 10.1093/jn/131.9.2539S. [DOI] [PubMed] [Google Scholar]
- 55.Souba WW. Glutamine and cancer. Annals of surgery. 1993;218(6):715. doi: 10.1097/00000658-199312000-00004. [DOI] [PMC free article] [PubMed] [Google Scholar]
- 56.Wise DR, Thompson CB. Glutamine addiction: a new therapeutic target in cancer. Trends in Biochemical Sciences. 2010;35(8):427–433. doi: 10.1016/j.tibs.2010.05.003. [DOI] [PMC free article] [PubMed] [Google Scholar]
- 57.Le A, Lane AN, Hamaker M, Bose S, Gouw A, Barbi J, Tsukamoto T, Rojas CJ, Slusher BS, Zhang H. Glucose-independent glutamine metabolism via TCA cycling for proliferation and survival in B cells. Cell Metabolism. 2012;15(1):110–121. doi: 10.1016/j.cmet.2011.12.009. [DOI] [PMC free article] [PubMed] [Google Scholar]
- 58.Sonnewald U, Westergaard N, Jones P, Taylor A, Bachelard HS, Schousboe A. Metabolism of [U-13C5]Glutamine in Cultured Astrocytes Studied by NMR Spectroscopy: First Evidence of Astrocytic Pyruvate Recycling. Journal of Neurochemistry. 1996;67(6):2566–2572. doi: 10.1046/j.1471-4159.1996.67062566.x. [DOI] [PubMed] [Google Scholar]
- 59.Gao P, Tchernyshyov I, Chang T-C, Lee Y-S, Kita K, Ochi T, Zeller KI, De Marzo AM, Van Eyk JE, Mendell JT. c-Myc suppression of miR-23a/b enhances mitochondrial glutaminase expression and glutamine metabolism. Nature. 2009;458(7239):762–765. doi: 10.1038/nature07823. [DOI] [PMC free article] [PubMed] [Google Scholar]
- 60.Suzuki S, Tanaka T, Poyurovsky MV, Nagano H, Mayama T, Ohkubo S, Lokshin M, Hosokawa H, Nakayama T, Suzuki Y, Sugano S, Sato E, Nagao T, Yokote K, Tatsuno I, Prives C. Phosphate-activated glutaminase (GLS2), a p53-inducible regulator of glutamine metabolism and reactive oxygen species. Proceedings of the National Academy of Sciences. 2010;107(16):7461–7466. doi: 10.1073/pnas.1002459107. [DOI] [PMC free article] [PubMed] [Google Scholar]
- 61.DeBerardinis RJ, Mancuso A, Daikhin E, Nissim I, Yudkoff M, Wehrli S, Thompson CB. Beyond aerobic glycolysis: transformed cells can engage in glutamine metabolism that exceeds the requirement for protein and nucleotide synthesis. Proceedings of the National Academy of Sciences. 2007;104(49):19345. doi: 10.1073/pnas.0709747104. [DOI] [PMC free article] [PubMed] [Google Scholar]
- 62.Tapia JC, Kasthuri N, Hayworth KJ, Schalek R, Lichtman JW, Smith SJ, Buchanan J. High-contrast en bloc staining of neuronal tissue for field emission scanning electron microscopy. Nature protocols. 2012;7(2):193–206. doi: 10.1038/nprot.2011.439. [DOI] [PMC free article] [PubMed] [Google Scholar]
- 63.Lichtman JW, Denk W. The big and the small: challenges of imaging the brain’s circuits. Science. 2011;334(6056):618–623. doi: 10.1126/science.1209168. [DOI] [PubMed] [Google Scholar]
- 64.Beigneux AP, Davies BS, Gin P, Weinstein MM, Farber E, Qiao X, Peale F, Bunting S, Walzem RL, Wong JS. Glycosylphosphatidylinositol-anchored high-density lipoprotein-binding protein 1 plays a critical role in the lipolytic processing of chylomicrons. Cell Metabolism. 2007;5(4):279–291. doi: 10.1016/j.cmet.2007.02.002. [DOI] [PMC free article] [PubMed] [Google Scholar]
- 65.Davies BS, Beigneux AP, Barnes RH, Tu Y, Gin P, Weinstein MM, Nobumori C, Nyrén R, Goldberg I, Olivecrona G. GPIHBP1 is responsible for the entry of lipoprotein lipase into capillaries. Cell Metabolism. 2010;12(1):42–52. doi: 10.1016/j.cmet.2010.04.016. [DOI] [PMC free article] [PubMed] [Google Scholar]
- 66.Weinstein MM, Goulbourne CN, Davies BS, Tu Y, Barnes RH, Watkins SM, Davis R, Reue K, Tontonoz P, Beigneux AP. Reciprocal metabolic perturbations in the adipose tissue and liver of GPIHBP1-deficient mice. Arteriosclerosis, thrombosis, and vascular biology. 2012;32(2):230–235. doi: 10.1161/ATVBAHA.111.241406. [DOI] [PMC free article] [PubMed] [Google Scholar]
- 67.Young SG, Zechner R. Biochemistry and pathophysiology of intravascular and intracellular lipolysis. Genes & Development. 2013;27(5):459–484. doi: 10.1101/gad.209296.112. [DOI] [PMC free article] [PubMed] [Google Scholar]
Associated Data
This section collects any data citations, data availability statements, or supplementary materials included in this article.