

Abstract
Catalytic promiscuity, the ability of enzymes to catalyze multiple reactions, provides an opportunity to gain a deeper understanding of the origins of catalysis and substrate specificity. Alkaline phosphatase (AP) catalyzes both phosphate and sulfate monoester hydrolysis reactions with a ∼1010-fold preference for phosphate monoester hydrolysis, despite the similarity between these reactions. The preponderance of formal positive charge in the AP active site, particularly from three divalent metal ions, was proposed to be responsible for this preference by providing stronger electrostatic interactions with the more negatively charged phosphoryl group versus the sulfuryl group. To test whether positively charged metal ions are required to achieve a high preference for the phosphate monoester hydrolysis reaction, the catalytic preference of three protein tyrosine phosphatases (PTPs), which do not contain metal ions, were measured. Their preferences ranged from 5 × 10⁶ to 7 × 10⁷, lower than that for AP but still substantial, indicating that metal ions and a high preponderance of formal positive charge within the active site are not required to achieve a strong catalytic preference for phosphate monoester over sulfate monoester hydrolysis. The observed ionic strength dependences of kcat/KM values for phosphate and sulfate monoester hydrolysis are steeper for the more highly charged phosphate ester with both AP and the PTP Stp1, following the dependence expected based on the charge difference of these two substrates. However, the dependences for AP were not greater than those of Stp1 and were rather shallow for both enzymes. These results suggest that overall electrostatics from formal positive charge within the active site is not the major driving force in distinguishing between these reactions and that substantial discrimination can be attained without metal ions. Thus, local properties of the active site, presumably including multiple positioned dipolar hydrogen bond donors within the active site, dominate in defining this reaction specificity.
Many enzymes exhibit the ability to catalyze, at a low level, the native reactions of related enzymes. This catalytic promiscuity likely played a role in the evolution of new enzymes, and comparisons of promiscuous activities within a set of related enzymes provides an opportunity to learn about the enzymatic features and properties used to optimize catalysis of the cognate reaction.1−4
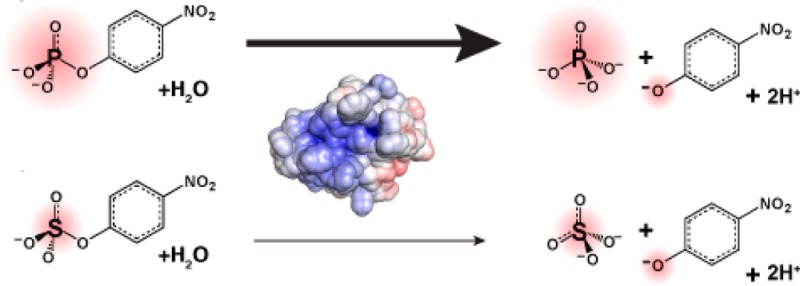
Members of the alkaline phosphatase superfamily catalyze both phosphoryl and sulfuryl transfer reactions but with substantially different catalytic preferences (Table S1, Supporting Information).5−11 While these two reactions proceed through similar, negatively charged, trigonal bipyramidal transition states (Figure 1), alkaline phosphatase (AP) from Escherichiacoli, the superfamily’s namesake, has a 1010-fold preference for hydrolyzing p-nitrophenyl phosphate (pNPP) over p-nitrophenyl sulfate (pNPS) (Table 1).12 In contrast, an aryl sulfatase in the AP superfamily has the opposite preference, catalyzing pNPS hydrolysis with a ∼106-fold preference over pNPP hydrolysis.11 Thus, the specificity differential of AP and aryl sulfatase is ∼1016-fold, but the origins of the extensive differential specificity in the AP superfamily are not understood.
Figure 1.

Phosphate and sulfate monoesters and their transition states. (A) Comparison of phosphate and sulfate monoesters. Bond lengths are for ethyl phosphate and ethyl sulfate.50−52 (A comparison of bond lengths for the p-nitrophenyl esters is not possible because no structure is available for pNPS.) The apparent ground state negative charge reported for each nonbridging oxygen atom was calculated by dividing the total charge of the molecule by the number of nonbridging oxygen atoms. (B) The solution hydrolysis reactions of pNPP and pNPS both involve nucleophilic attack by water and loose transition state structures in which there is little bond formation with the incoming nucleophile and extensive bond cleavage of the leaving group.13,31−39 The size of the “δ−” symbols is meant to qualitatively reflect the relative charge distribution in the transition states.
Table 1. Phosphatase and Sulfatase Activity of AP Mutants and PTPs.
|
kcat/KM (M–1 s–1)a |
rate enhancementb |
||||
|---|---|---|---|---|---|
| pNPP | pNPS | pNPP | pNPS | discriminationc | |
| AP | |||||
| WTd | 3.3 × 10⁷ (5.8 × 10⁸) | 2.8 × 10⁻³ | ≥7 × 10¹⁷ (1 × 10¹⁹) | 3 × 10⁸ | ≥2 × 10⁹ (3 × 10¹⁰) |
| R166Se | 1.0 × 10⁵ | 6.8 × 10⁻⁵ | 2 × 10¹⁵ | 8 × 10⁶ | 3 × 10⁸ |
| PTP | |||||
| Stp1 | 2.6 × 10⁴f | 5.3 × 10⁻⁵ | 2 × 10¹⁴ | 3 × 10⁶ | 7 × 10⁷ |
| PTP1B | 9.3 × 10⁴g | 1.1 × 10⁻³ | 8 × 10¹⁴ | 6 × 10⁷ | 1 × 10⁷ |
| Yop51*Δ162 | 1.6 × 10⁵h | 3.2 × 10⁻³ | 1 × 10¹⁵ | 2 × 10⁸ | 5 × 10⁶ |
See Materials and Methods for kinetic assay conditions.
Rate enhancement = (kcat/KM)/kw; kw is the second-order rate constant for attack of water on the monoester. The kw value for pNPP hydrolysis was determined31 at 39 °C and corrected to 25 °C (5 × 10–11 M–1 s–1), the temperature at which the AP assays were conducted, and 30 °C (1.2 × 10⁻¹⁰ M–1 s–1), the temperature at which the PTP assays were conducted, using the reported temperature dependence.31 The kw value for pNPS hydrolysis at 25 °C (9 × 10–12 M–1 s–1) and 30 °C (1.7 × 10⁻¹¹ M–1 s–1) was corrected from the value35 at 35 °C by using the reported temperature dependence.35
Discrimination = (rate enhancement pNPP)/(rate enhancement pNPS).
The rate constant for pNPP hydrolysis by WT and mutant AP was used to estimate the expected second-order rate constant shown in parentheses for the enzymatic reaction with the chemical step rather than diffusion rate limiting, as described in Text S1, Supporting Information.5 The rate constant for WT AP pNPS hydrolysis was measured here using a discontinuous assay (see Materials and Methods) and agrees well with the previously published value.12
Values are from a literature source.7
Within error of the previously reported value of 3.0 × 10⁴ M–1 s–1.14
Within error of the previously reported value of 1.0 × 105.49
Within error of the previously reported value of 1.3 × 10⁵ M–1 s–1.16
A simple model for how AP achieves preferential stabilization of the phosphoryl group transition state over the sulfuryl group transition state is that the preponderance of formal positive charge from three metal ions and Arg166 in the AP active site (Figure 2A) is well suited to distinguish differences in negative charge between the phosphoryl group and sulfuryl group transition states.13 As shown in Figure 1A, a phosphate monoester substrate carries a −2 charge while a sulfate monoester ester substrate carries only a −1 charge. The additional negative charge on the phosphate monoester substrate presumably results in more negative charge on the nonbridging oxygen atoms of the phosphoryl group transition state compared with the sulfuryl group transition state (Figure 1B). The greater negative charge on the phosphoryl group transition state could therefore lead to stronger electrostatic interactions with the positively charged groups in the AP active site, compared with the corresponding weaker electrostatic interactions with the sulfuryl group. Such preferential electrostatic interactions would lead to greater stabilization and preferential catalysis of the more negatively charged phosphoryl group transition state. Consistent with this model, a previous study with AP demonstrated that catalytic activity increases sharply for a series of substrates with increasing negative charge on the nonbridging oxygen atom situated between the Zn2+ ions of the bimetallo cluster.13
Figure 2.
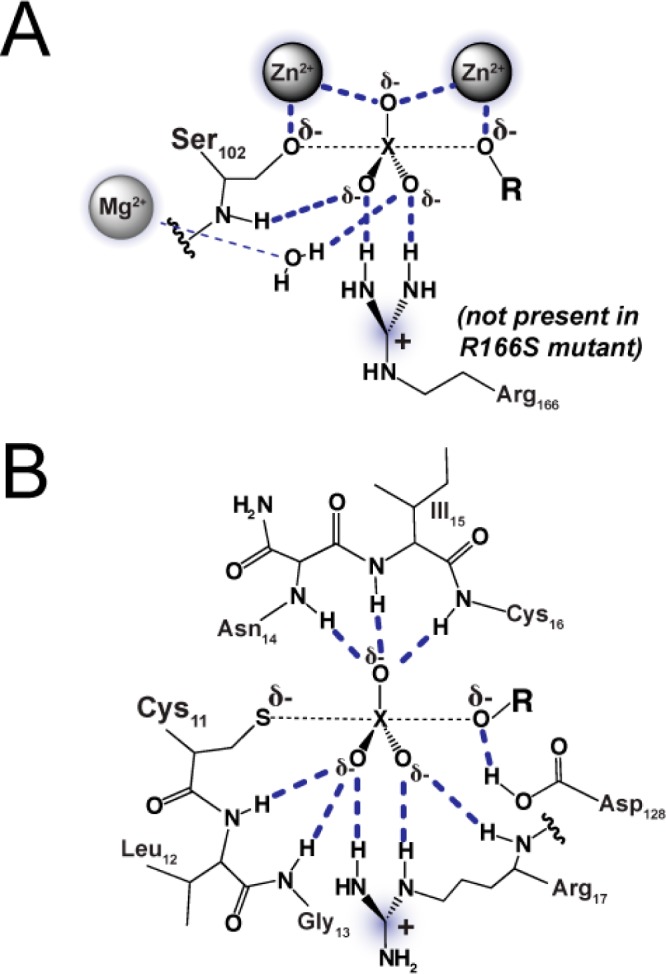
Active site schematic for AP (A) and Stp1 (B) with the expected interactions (dark blue dashes) in the transition state for phosphoryl or sulfuryl transfer from a monoester. The central phosphorus or sulfur atom is denoted by an X. Positively charged active site groups are shaded. The schematic for AP is based on the X-ray structure in ref (57) (PDB code 3TG0). The schematic for Stp1 is based on the X-ray structure of low-molecular weight bovine PTP in ref (56) (PDB code 1Z12). The bovine PTP is highly homologous to Stp1 (47% identity) and shares identical active site residues.
To test whether extensive positive charge, particularly from metal ions as found in the AP active site, is necessary to achieve a strong preference for catalyzing phosphate monoester over sulfate monoester, we turned to a different family of phosphatases. Protein tyrosine phosphatases (PTPs) lack positively charged metal ions in their active sites (cf. to AP in Figure 2), but their preference for phosphate monoester over sulfate monoester catalysis is unknown. A prediction from the above model of substrate discrimination is that the PTPs would have much less of a preference for phosphate monoester hydrolysis, given the paucity of positively charged groups in their active sites. Contrary to this prediction, our results show that PTPs provide robust discrimination. These and additional results suggest that positively charged metal ions or a high formal positively charged active site is not needed to achieve a high degree of discrimination.
Materials and Methods
Materials
All chemicals including substrates, buffers, and salts were obtained from commercial sources and were reagent grade. Site-directed mutants were prepared using a QuikChange site-directed mutagenesis kit (Stratagene).
Protein Expression and Purification
The expression and purification of Stp1 was conducted based on a previous protocol.14 Briefly, E. coli BL21(DE3) cells containing plasmid pT7–7 with the Stp1 sequence were grown to OD600 0.6–0.9 in 2×YT media (5 g of NaCl, 16 g of tryptone, 10 g of yeast extract per liter) and induced with 0.4 mM IPTG for 4–5 h. Cells were pelleted, resuspended in buffer A (20 mM Na acetate, pH 5.1, 100 mM NaCl, and 1 mM EDTA), and lysed by passage through a French press or high-pressure homogenizer. Following centrifugation, the supernatant was filtered through a 0.2 μM membrane (Nalgene) and subjected to FPLC ion exchange chromatography (HiPrep 16/10 CM Sepharose, 20 mL column, flow rate 5 mL/min, at 4 °C), washed with 200 mL of buffer A, and eluted by flowing a gradient from 100% buffer A to 100% buffer B (20 mM Na acetate, pH 5.1, 500 mM NaCl, and 1 mM EDTA) over 200 mL. Fractions containing protein, as determined by absorbance at 280 nm, were pooled, concentrated to ∼1 mL, and passed through (at 0.9 mL/min) a gel filtration column (Suparose-12 column, 100 mL column). Typical protein yields were >15 mg/L. Purity was estimated to be >95% from band intensities of Coomassie Blue-stained SDS-polyacrylamide gels. Protein concentration was determined by absorbance at 280 nm in 6 M guanidine hydrochloride and 20 mM sodium phosphate, pH 6.5, using a calculated extinction coefficient of 12110 M–1 cm–1.
Human PTP1B contained in the pT7-plasmid was overexpressed and purified according to a previously published protocol.15 Purity was estimated to be >95% by SDS-PAGE, and the concentration was determined as above using a calculated extinction coefficient of 59560 M–1 cm–1.
Yop51*Δ162, a PTP from Yersinia pestis having a C235R point mutation and lacking the N-terminal 162 amino acids that is catalytically equivalent to the full length protein, was overexpressed and purified as described previously.16 Purity was estimated to be >95% by SDS-PAGE, and the concentration was determined as above using a calculated extinction coefficient of 15965 M–1 cm–1.
The R166S mutant of AP was purified as described previously.17 Purity was estimated to be >95% by SDS-PAGE, and the concentration was determined by absorbance at 280 nm in 6 M guanidine hydrochloride and 20 mM sodium phosphate, pH 6.5, using a calculated extinction coefficient of 31390 M–1 cm–1. The concentration of R166S AP was also confirmed by activity assays using 1 mM pNPP and agreed with previously reported kcat values within 20%.18
Kinetic Methods
Standard reaction conditions for the PTPs (WT and C11G Stp1, PTP1B, and Yop51*Δ162) were 20 mM Na maleate, pH 6.0, 0.15 M NaCl, 0.1 mM EDTA, and 30 °C. Phosphatase activity toward pNPP was followed in quartz cuvettes (1 mL) by measuring the appearance of the p-nitrophenolate product (extinction coefficient of 1635 M–1 cm–1 at pH 6.0) using a Uvikon 9310 or PerkinElmer λ-25 UV–vis spectrophotometer. Rate constants were obtained from initial rates (typically ≤5% reaction). Reactions were shown to be first order in substrate and enzyme by varying substrate and enzyme over a >10-fold range. Replicate measurements gave rate constants that varied by ≤10%.
Sulfatase activity toward pNPS was followed by the appearance of the p-nitrophenolate product using a discontinuous assay.19 Appearance of the phenolate was monitored by removing aliquots from the reaction, quenching in a relatively small volume of 1 M NaOH, and measuring the absorbance at 400 nm (with background subtraction at 500 nm to control for instrument drift over the long time periods required to measure the sulfatase activity). The example sulfatase assay results for Stp1 in Figure S1, Supporting Information, were also repeated using ∼2-fold lower enzyme concentration (Figure S1, Supporting Information) to demonstrate that the reaction velocity was proportional to the concentration of enzyme as expected. Replicate measurements with Stp1 gave rate constants that varied by ≤25%. This discontinuous assay approach was also validated by using it to follow the phosphatase activity of Stp1 to reproduce the kinetic parameters obtained from the standard assay in which product generation is followed continuously.
The measurement of the R166S AP phosphatase and sulfatase activities was conducted as reported previously12,13 in the standard reaction conditions of 100 mM NaMOPS, pH 8.0, 100 mM NaCl, 1 mM MgCl2, 100 μM ZnCl2, and 30 °C.
Inhibition Measurements
To test whether the observed sulfatase activity was due to Stp1 and not contamination by a small quantity of a proficient sulfatase enzyme, the inhibition constant for Pi was measured by varying the inhibitor concentration at least 10-fold below and above the observed Ki at constant enzyme concentrations and constant, subsaturating concentrations of either pNPP or pNPS in the standard reaction conditions listed above. For inhibition of the phosphatase activity reactions contained 20 nM Stp1 and 50 μM pNPP. For inhibition of the sulfatase activity reactions contained 390 μM WT Stp1 and 1 mM pNPS. Initial velocities for both activities at each concentration of Pi were determined by linear least-squares fits. The inhibition constant was determined by nonlinear least-squares fits using the appropriate equation for competitive inhibition.
The inhibition data for PTP1B and Yop51*Δ162 are shown in Figure S3, Supporting Information. For these enzymes, the inhibitor, inorganic arsenate, was used instead of Pi because the Pi inhibition of these enzymes is weak (>10 mM) and difficult to measure accurately for both phosphatase and sulfatase activities. For inhibition of the PTP1B phosphatase activity, reactions contained 10 nM PTP1B and 100 μM pNPP. For inhibition of the PTP1B sulfatase activity reactions contained 20 μM PTP1B and 5 mM pNPS. For inhibition of the Yop51*Δ162 phosphatase activity reactions contained 20 nM Yop51*Δ162 and 300 μM pNPP. For inhibition of the Yop51*Δ162 sulfatase activity reactions contained 30 μM Yop51*Δ162 and 2 mM pNPS. Initial velocities at each concentration of arsenate were determined by linear least-squares fits. The inhibition constants were determined by nonlinear least-squares fits using the equation for competitive inhibition (see Figure S3, Supporting Information, legend).
Ionic Strength Dependencies
Assays for pNPP and pNPS hydrolysis by R166S AP were conducted in 5 mM NaMOPS, pH 8.0, at 30 °C with 0–800 mM NaCl, except for controls with alternative salts (see Results and Discussion). Assays for Stp1 were conducted in 5 mM Na maleate, pH 6.0, at 30 °C with the same NaCl concentrations and alternative salts.
The observed ionic strength dependencies were insensitive to the concentration of substrate when the substrate concentration was maintained at least 2-fold below the expected KM value. With substrate concentrations significantly above the KM, the substrate-binding step no longer contributes to the observed activity. Under such conditions, electrostatic forces subject to electrostatic screening from increasing ionic strength are not expected to contribute to the observed activity. Consistent with this expectation, the observed activity for pNPP hydrolysis by R166S AP and Stp1 did not change with ionic strength when the pNPP concentration was well above the expected KM (Figure S7, Supporting Information).
The ionic strength of the assay solutions includes contributions from the buffer and was computed using I = 0.5∑cizi2, where I is the ionic strength, ci is the ion molarity of ion i, and zi is the charge number of that ion.
Results and Discussion
Catalytic Discrimination by Protein Tyrosine Phosphatases (PTPs) between Phosphate and Sulfate Monoester Hydrolysis
To determine the catalytic discrimination of a PTP, we first measured the phosphatase activity of the PTP Stp1. Our value for kcat/KM for the hydrolysis of the phosphate monoester, pNPP, of 2.6 × 10⁴ M–1 s–1 (Table 1), agrees with previous measurements with this substrate.14,20 This value corresponds to a rate enhancement over the uncatalyzed reaction rate constant, kw, of (2.2 × 10¹⁴)-fold [= (kcat/KM)/kw] (Table 1). Our Stp1 preparation also exhibited pNPS hydrolysis activity, with kcat/KM = 5.3 × 10⁻⁵ M–1 s–1 (Figure S1, Supporting Information; Table 1). Although this kcat/KM value is very low compared with physiological activities, even with the activated p-nitrophenolate leaving group, it nonetheless would correspond to a substantial rate enhancement above the uncatalyzed reaction of more than a million-fold (Table 1).
Low observed promiscuity, however, raises the concern that the observed activity could be due to a very low concentration of a contaminating enzyme with a high activity for the promiscuous reaction, in this case, sulfate monoester hydrolysis. As carried out previously for AP and its mutants,12,17,21 several controls can be used to test whether Stp1 is responsible for the observed sulfatase activity and whether the reaction occurs in the Stp1 active site. First, we showed that multiple Stp1 preparations had the same activity, within error (Figure S1, Supporting Information). Thus, any potential contamination would have to be constant between protein preparations. Second, we showed that inorganic phosphate (Pi), a competitive inhibitor of Stp1, inhibits the phosphatase and sulfatase activities with the same inhibition constant (Figure 3A), suggesting that both activities arise from a common active site. Further, because the sulfatase activity is several orders of magnitude lower than the phosphatase activity, the pNPS substrate does not react significantly on the time scale of the phosphatase reaction. We could therefore determine whether pNPS inhibits pNPP activity with a Ki value corresponding to the KM value observed for pNPS hydrolysis (Table S1, Supporting Information), as would be expected for reaction from the same enzyme and active site. The inhibition constant for pNPS inhibition was within error of the observed KM value for pNPS hydrolysis (Figure S2 and Table S2, Supporting Information). Finally, we showed that mutation of the active site nucleophile from cysteine to glycine substantially decreases both the phosphatase and sulfatase activities (Figure 3B), providing strong evidence that both reactions are catalyzed by Stp1 and occur within the same active site.
Figure 3.

Evidence that the observed promiscuous sulfatase activity arises from PTP. (A) Coincident inhibition of phosphatase (pNPP hydrolysis, filled circles) and sulfatase (pNPS hydrolysis, open circles) activities by inorganic phosphate (Pi) (see Materials and Methods for assay conditions). For comparison, activity was normalized by dividing the observed rate constant in the presence of inhibitor by the rate constant in the absence of inhibitor. The line represents a nonlinear least-squares fit to the combined data for competitive inhibition of both activities and gave an inhibition constant of Ki = 11.0 ± 0.3 mM. Individual fits to the phosphatase and sulfatase data gave values of Ki that are the same within error (10.9 ± 0.6 and 11.1 ± 0.2, respectively). (B) Phosphatase and sulfatase activity of Stp1 with and without the intact Cys11 nucleophile. Assay conditions are described in the Materials and Methods. The dotted line shows the detection limit for sulfatase activity. The sulfatase activity of C11G Stp1 is below this detection limit. Also, there is no evidence that the remaining very low activities arise from the mutated Stp1 as opposed to contaminating activities present at extremely low levels.
These results strongly suggest that the observed sulfatase activity arises from the Stp1 active site. Comparison of the Stp1 phosphatase and sulfatase activities gives a discrimination of 7 × 10⁷-fold (determined as the ratio of rate enhancements for the pNPP and pNPS hydrolysis reactions; Table 1).
To determine whether the extent of discrimination by Stp1 generalizes to other PTPs, we measured the pNPS activity of PTP1B and Yop51*Δ162, which have conserved active site features that are found in Stp1: a cysteine nucleophile, an arginine in position to contact the nonbridging oxygen atoms of the substrate, and a general acid that protonates the monoester leaving group (Figure 2B).22,23 The catalytic domains of these PTPs also share significant overall sequence identity.22,24−26
Sulfatase activity was detected for both PTPs (Table 1). The phosphatase and sulfatase activities of each of the two PTPs were inhibited equally by inorganic arsenate, providing evidence that both activities are catalyzed by the PTPs and take place in the same active site (Figure S3, Supporting Information). As shown in Table 1, these PTPs exhibit discrimination within ∼10-fold of Stp1, suggesting that the conserved features of the PTP active site are responsible for the similar catalytic preferences for phosphate over sulfate ester hydrolysis.
Comparison of the Catalytic Discrimination of AP and PTPs
The three PTPs tested preferentially catalyze phosphate ester over sulfate ester hydrolysis by (0.5–7) × 107-fold (Table 1). This discrimination is ∼100-fold less than the discrimination of 2 × 10⁹ observed for AP (Table 1), and the AP value is an underestimate of the discrimination in the chemical transition state, because substrate binding is rate-limiting for pNPP reacting with wild-type AP.27−30 Several comparisons suggest that the actual discrimination between the chemical transition states for the AP phosphatase and sulfatase reactions is ∼3 × 10¹⁰ (Table 1; Text S1, Supporting Information), which corresponds to an overall ∼1000-fold greater discrimination by AP than by the PTPs.
On the surface, these results might suggest a considerable contribution to discrimination from the AP metal ions. However, the PTP active sites that lack metal ions provide ∼107-fold discrimination, and mutation of AP to remove its active site arginine residue (R166) leaves all three active site metal ions unafffected18 but reduces the phosphatase/sulfatase discrimination to 3 × 10⁸, within 10-fold of the discrimination achieved by a metal-free PTP (Table 1).
Testing Possible Origins of the Observed Catalytic Discrimination by AP and PTPs
The results above indicate that substantial discrimination between phosphate and sulfate esters of greater than a million fold can be achieved without the involvement of metal ion interactions and in active sites with little formal positive charge. To test whether there might nevertheless be a similar overall electrostatic component to discrimination by AP and the PTPs such that a strong long-range electrostatic attraction was felt for more highly charged substrates to both AP and PTP active sites, we compared the ionic strength dependences of each enzyme with the phosphate monoester dianion and sulfate monoester monoanion substrates.
Calculation of the surface electrostatic potentials for AP and Stp1 using a Poisson–Boltzmann equation solver reveal positive potentials near the active sites (Figure 4) that could contribute to discrimination by preferentially attracting more negatively charged substrates into the active site and thereby favor formation of the enzyme and substrate complex for the more highly charged substrate. If a long-range attractive electrostatic potential contributes to the AP and Stp1 catalyzed reactions, the presence of counterions would be expected to decrease this attraction so that the catalytic activity would decrease as the ionic strength of the reaction solution is raised and decrease more for a more highly charged enzyme. Because increased ionic strength will screen long-range charge–charge interactions and not local interactions, this experiment cannot probe local electrostatic and dipolar interactions that are within the active site and involved in the progression from the enzyme/substrate to the enzyme/transition state complex. In addition, because nonideal effects of ions on enzymes are common, comparison of the ionic strength dependence of reactions of the (phosphate ester) dianion versus (sulfate ester) monoanion substrates for each enzyme is important in controlling for such effects.
Figure 4.
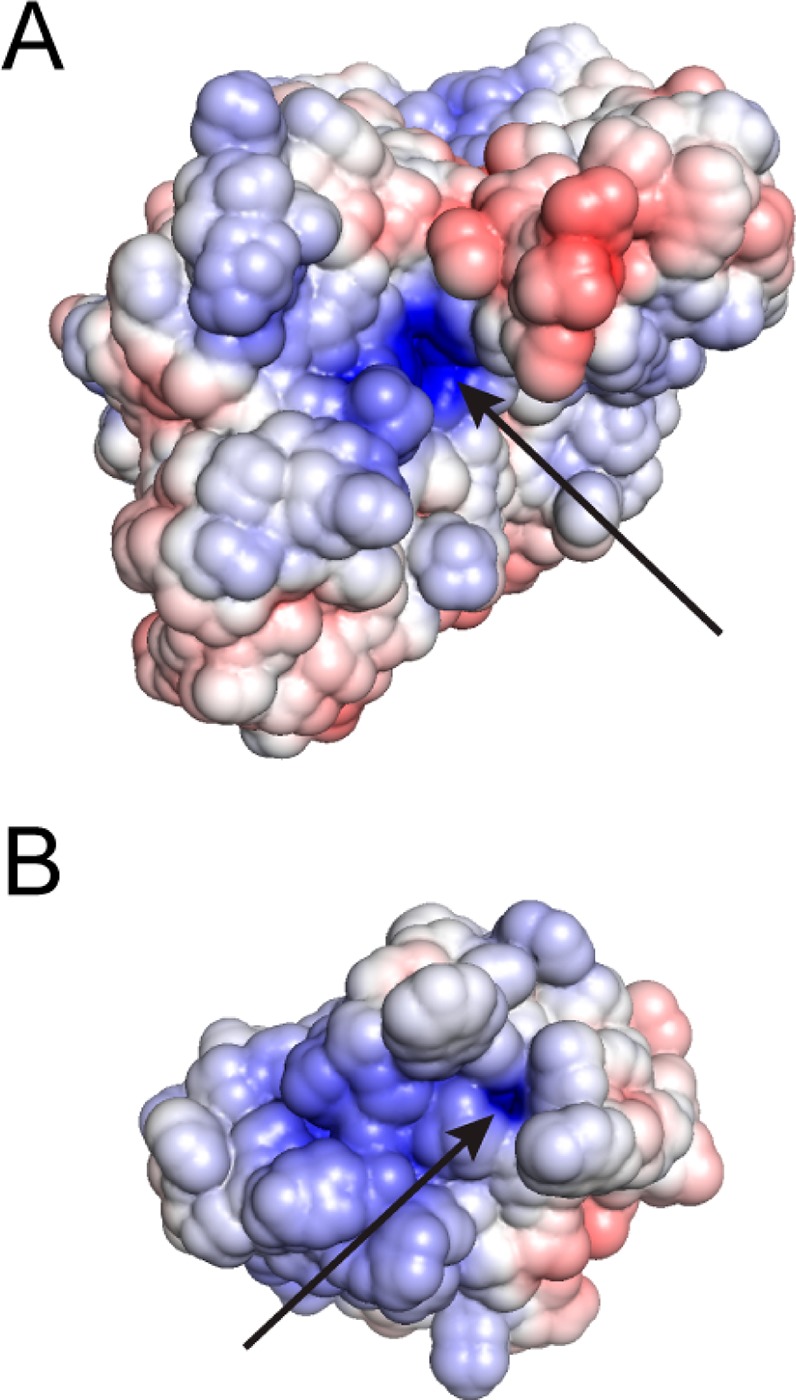
Models of the electrostatic surface potential for WT AP (A) and Stp1 (B) with arrows pointing to the active site nucleophile. For modeling AP, the X-ray structure from ref (57) was used (PDB code 3TG0). For modeling Stp1, the X-ray structure of low-molecular weight bovine PTP in ref (56) (PDB code 1Z12) was used to generate a structural homology model of Stp1 using the program Modeller.53 The protein surface is colored according to electrostatic potential (positive, blue; negative, red; ±6kT/e). For the electrostatic calculation, the active site nucleophiles of AP and Stp1 were deprotonated, and for Stp1, the Asp28 general acid was protonated. Created with AMBER/ABPS in MacPyMOL.54,55
The ionic strength dependencies of activity for AP and Stp1 are shown in Figure 5A,B, respectively. The pNPP hydrolysis activity of WT AP is limited by diffusion rather than the chemical step.27−30 To allow for a consistent comparison of ionic strength dependent activity, R166S AP was used in Figure 5A because neither its pNPP nor its pNPS reaction is diffusion-limited13,18 so that the binding and hydrolysis steps contribute to the observed hydrolysis activities for both substrates. Although R166S AP contains one less active site positive charge than WT AP, the active site of R166S AP still contains five more formal positive charges than the Stp1 active site and its calculated electrostatic surface potential map also suggests significant positive potential near the surface of the active site entrance (Figure S4D, Supporting Information).
Figure 5.

Ionic strength dependencies for the hydrolysis of pNPP (circles) and pNPS (triangles) by R166S AP (A) and Stp1 (B). See Materials and Methods for assay conditions. For comparison, fraction activity was calculated by dividing each observed rate constant by the rate constant measured at the lowest ionic strength measured. The slope [log(fraction activity)/(ionic strength)1/2] provides an estimate for the product of the interacting charges of substrate (Z0) and the enzyme (Zenz) according to the Debye–Hückel equation log(fraction activity) = 2AZ0Zenz(ionic strength)1/2 + C, where A is 0.516 at 30 °C, C is the fraction activity as the ionic strength approaches zero (C = 1.30 and 1.01 for pNPP and pNPS in panel A and 1.23 and 0.85 for these two substrates in panel B); and Z0 is fixed at −2 for the pNPP data and at −1 for the pNPS data. Solid lines show global best fits, and dashed lines show individual best fits and yield Zenz values reported in Table 2. (C) The discrimination of pNPP hydrolysis activity over pNPS hydrolysis activity for R166S AP (filled diamonds) and Stp1 (open diamonds). Solid lines show the best fits to the linear Debye–Hückel model treating the value of the slope as a variable. The y-axis is on a logarithmic scale.
Ionic strength dependencies can also be complicated by direct binding of ions to the active site or by ionic-strength dependent changes in active site conformations of the enzyme. Control reactions, using KCl or NaBr to test for ion-specific effects, gave essentially the same dependencies as that with NaCl for both AP and Stp1 (Figure S5, Supporting Information), as expected for effects arising from electrostatic screening in the absence of specific binding. In addition, if the ionic strength dependence were due to the screening of electrostatic potential between the substrate and active site, the steepness of the dependence would be predicted to be proportional to the formal charge of the reactants, that is, the absolute charge of the substrate and the enzyme. Fitting the ionic strength dependent data gives a slope for the pNPP hydrolysis activity that is two times greater than the corresponding slope of the pNPS activity for both R166S AP (Figure 5A) and Stp1 (Figure 5B), as expected from the charge differential of the two substrates. This differential dependence of pNPP and pNPS hydrolysis strongly suggests that the ionic strength dependences reflect screening of electrostatic potential between the active site and substrate.
With these controls in hand, we set out to assess potential electrostatic differences between the enzymes that could contribute to reactions starting from free enzyme and free substrate. Because the R166S AP active site contains six formal positive charges, compared with the Stp1 active site’s single formal positive charge, it might have been expected that the decrease in activity for a given change in ionic strength would be much greater for the R166S AP-catalyzed reactions. However, this was not the case. Indeed, the dependence for Stp1 with each substrate was steeper than that for R166S AP (Figure 5; cf. parts A and B). These slopes can be converted, according to a simple Debye–Hückel formalism, into apparent overall charges of the enzyme, which give, as expected based on the differential steepness, a larger value for Stp1 than for R166S AP (Table 2).
Table 2. Effective Enzyme Charge for R166S AP and Stp1 Determined by the Ionic Strength Dependence of Activitya.
|
Zenz |
|||
|---|---|---|---|
| pNPP (Z0 = −2) | pNPS (Z0 = −1) | global fit | |
| R166S AP | +0.49 ± 0.03 | +0.43 ± 0.03 | +0.48 ± 0.02 |
| Stp1 | +0.75 ± 0.02 | +0.92 ± 0.12 | +0.78 ± 0.08 |
Values of the effective ionic charge of the enzyme, Zenz, were determined from fits to the Debye–Hückel equation to the ionic strength dependent data in Figure 4A,B.
We next wanted to calculate the ionic strength dependence for the discrimination by each enzyme and to compare them. Because no significant ionic strength dependence is observed for the uncatalyzed rates of hydrolysis of pNPP or pNPS (Figure S6, Supporting Information), the catalytic discrimination at each ionic strength can be determined from the ratios of rate constants in Figure 5A,B for R166S AP and Stp1, respectively. This discrimination, shown in Figure 5C, is only modestly affected, and the effect is nearly the same for the two enzymes: for a change in ionic strength from 0.004 to 0.8 M, the discrimination changes only ∼3-fold for both enzymes (2.8- and 3.5-fold for R166S AP and Stp1, respectively). At the highest ionic strength shown in Figure 5C (0.8 M), 108.1-fold discrimination remains for R166S AP and 107.4-fold discrimination remains for Stp1.
Conclusions and Implications
The discrimination of AP between its cognate phosphate monoester dianion and noncognate sulfate monoester monoanion reactions is very high, ≥2 × 10⁹-fold, and estimated to be ∼3 × 10¹⁰ (Table 1; Text S1, Supporting Information). We have shown that this discrimination is not uniquely a function of the high formal charge density of its active site, because the PTPs tested, which have only one positively charged active site group instead of the +7 formal positive charges in the AP active site, also exhibited high levels of discrimination, (0.5–7) × 107-fold (Table 1; Figure 2). Removal of the single nonmetal ion positive charge from AP, to give the R166S mutant, reduced discrimination to 3 × 10⁸, similar to that for the PTPs, despite the remaining six positive charges from AP’s three active site divalent metal ions.
Increasing the concentration of ions in solution had only modest effects on the discrimination between the dianionic and monoanionic substrates. Thus, the formal charges of the AP metal ions are apparently sufficiently balanced by the anionic metal ion ligands and other negatively charged groups such that there is no large global electrostatic attraction between free enzyme and free substrate that accounts for the bulk of the observed discrimination for AP.
The factor or factors involved in discrimination by AP and by PTPs remain to be elucidated. We briefly note potential factors and then close by noting a striking correlation between discrimination and overall rate enhancement.
Differential catalysis via differential nucleophile activation and leaving group stabilization could contribute to greater phosphatase than sulfatase activity. However, the transition states for phosphoryl and sulfuryl transfer are indistinguishable,a both in solution13,31−39 and at the AP active site, as assessed by leaving group 18O isotope effects40,41 (see also ref (42)), so that differential catalysis via nucleophile activation and leaving group stabilization would not be expected. Given the larger charge density on the phosphoryl oxygen atoms, relative to the sulfuryl oxygen atoms, stronger hydrogen bond and other local electrostatic interactions, which were not assessed in our experiments, could provide all or some of the observed discrimination. It is also possible that precise arrangement of groups within the AP and PTP active sites allow discrimination despite the very modest geometrical differences of only ∼0.1 Å (Figure 1).45−47 Finally, the hydrolysis of phosphate monoester dianions is greatly accelerated in largely organic solvents in the presence of very little water, whereas sulfate monoester monoanion hydrolysis is much less affected so that differential solvation energetics of the ground and transition states in solution and in the enzyme active site need to be considered and may contribute to phosphate ester versus sulfate ester specificity.44,48 Conversely, we do not understand how sulfatases, which also have a preponderance of charged and polar active site groups, discriminate in favor of sulfate ester hydrolysis over phosphate ester hydrolysis.11 These observations of reversed discrimination indicate that features beyond simple accounting of potential active site electrostatic interaction energies need to be invoked and dissected in order to understand the observed discriminations and, ultimately, to predict and design binding and catalytic specificity.
An Intriguing Correlation of Catalytic Efficiency and Discrimination
Figure 6A shows the phosphate/sulfate monoester discrimination as a function of the catalytic efficiency for hydrolysis of phosphate monoester dianions for all enzymes for which these parameters have been measured of which we are aware. Based on this limited sample set, there is a strong correlation, but it appears that sulfatase activity remains at a similar level (Figure 6B) so that the correlation is driven by increased phosphatase activity; that is, as phosphatase activity is increased, sulfatase activity does not increase commensurately (Figure 6B). Active site features that provide optimal phosphatase catalysis may affect only or predominantly this reaction, or increased catalytic power toward phosphate esters may be accompanied by selective pressure against also increasing activity for sulfatase side reactions.
Figure 6.

Analysis of relative rate enhancements for cognate reactions with their ability to discriminate between phosphate and sulfate ester substrates. (A) Correlation of the enzymatic rate enhancement of pNPP hydrolysis with the extent of catalytic discrimination between pNPP and pNPS hydrolysis by AP superfamily members and PTPs. Data are from results herein and prior studies and are summarized in Table S1, Supporting Information. The linear least-squares fit has a slope of 0.9 log units (R2 = 0.74). Key: circles for AP and mutants thereof; diamond for PafA; squares for PTPs; triangle for PAc; inverted triangle for NPP; right angle triangle for PMH; open circle for PAS. See Table S1, Supporting Information, for enzyme abbreviations. The data point for PAS was not included in the fit because this enzyme prefers to hydrolyze pNPS over pNPP. (B) Plot of the enzymatic rate enhancement of pNPP hydrolysis with the enzymatic rate enhancement of pNPS hydrolysis by AP superfamily members and PTPs (excluding the AP superfamily member PAS). Key: same as in panel A). The data point for PAS is omitted to allow better visualization of the other data points but is included in an analogous plot in the Supporting Information (Figure S8).
A grand challenge will be to reach a sufficient level of understanding to allow enzymes to be designed with catalytic power rivaling those of natural enzymes and with specificity and promiscuity that can be dialed up or down by following a set of engineering principles grounded in physical and chemical understanding.
Acknowledgments
We thank Professor Zhong-Yin Zhang for generously providing PTP expression plasmids. We also thank members of the Herschlag lab for comments on the manuscript.
Glossary
Abbreviations
- AP
E. coli alkaline phosphatase
- PTP
protein tyrosine phosphatase
- pNPP
p-nitrophenyl phosphate
- pNPS
p-nitrophenyl sulfate
- KIE
kinetic isotope effect
Supporting Information Available
A table of kinetic parameters for PTPs, AP superfamily member enzymes, and mutants thereof, plots of reaction progress curves, Michaelis–Menten curves, and inhibition curves, a discussion of the rate-limiting step for AP hydrolysis of pNPP, a table of PTP kinetic parameters, two-dimensional active site schematics and electrostatic surface potential representations of wild type AP, R166S AP, and wild type PTP, plots of ionic strength dependencies, and a plot of pNPP and pNPS rate enhancements for AP superfamily members and PTPs. This material is available free of charge via the Internet at http://pubs.acs.org.
The authors declare no competing financial interest.
This work was supported by a grant from the National Institutes of Health (NIH) to D.H. (GM64798). L.D.A was supported in part by an NIH training grant (R1GM064798). J.G.Z. was supported in part by a Hertz Foundation Graduate Fellowship.
Funding Statement
National Institutes of Health, United States
Footnotes
The value of the 18O isotope effect for the leaving group oxygen atom is identical, within error, for the solution phosphoryl and sulfuryl transfer reactions [KIE for solution reactions of pNPP2– and pNPS1– is 1.0189 and 1.0210, respectively].43,44 The KIE’s measured for AP are also identical, as follows. The 18O IE for R166S AP with pNPP is 1.0091 ± 0.0006.40 (The value for WT AP cannot be used because the chemical step is not rate limiting for this reaction.) This IE is the same as that for the pNPS (sulfatase) reaction with WT AP, 1.0084 ± 0.001.40 [Here WT AP is used because the R166S AP/pNPS reaction is too slow to get accurate IEs; We can directly compare WT AP and R166S AP because the presence or absence of R166 does not change the IE, as demonstrated with the substrate pNPPS (the phosphorothioate substrate) where the IEs are 1.0094 ± 0.0004 (WT) and 1.0098 ± 0.0003 (R166S).41]
Supplementary Material
References
- Jensen R. A. (1976) Enzyme recruitment in evolution of new function. Annu. Rev. Microbiol. 30, 409–425. [DOI] [PubMed] [Google Scholar]
- O’Brien P. J. (2006) Catalytic promiscuity and the divergent evolution of DNA repair enzymes. Chem. Rev. 106, 720–752. [DOI] [PubMed] [Google Scholar]
- Aharoni A.; Gaidukov L.; Khersonsky O.; Gould S. M.; Roodveldt C.; Tawfik D. S. (2004) The ‘evolvability’ of promiscuous protein functions. Nat. Genet. 37, 73–76. [DOI] [PubMed] [Google Scholar]
- Khersonsky O.; Tawfik D. S. (2010) Enzyme promiscuity: A mechanistic and evolutionary perspective. Annu. Rev. Biochem. 79, 471–505. [DOI] [PubMed] [Google Scholar]
- O’Brien P. J.; Herschlag D. (2002) Alkaline phosphatase revisited: Hydrolysis of alkyl phosphates. Biochemistry 41, 3207–3225. [DOI] [PubMed] [Google Scholar]
- Zalatan J.; Fenn T.; Brunger A.; Herschlag D. (2006) Structural and functional comparisons of nucleotide pyrophosphatase/phosphodiesterase and alkaline phosphatase: Implications for mechanism and evolution. Biochemistry 45, 9788–9803. [DOI] [PubMed] [Google Scholar]
- Lassila J.; Herschlag D. (2008) Promiscuous sulfatase activity and thio-effects in a phosphodiesterase of the alkaline phosphatase superfamily. Biochemistry 47, 12853–12859. [DOI] [PMC free article] [PubMed] [Google Scholar]
- Berlutti F.; Passariello C.; Selan L.; Thaller M. C.; Rossolini G. M. (2001) The Chryseobacterium meningosepticum PafA enzyme: Prototype of a new enzyme family of prokaryotic phosphate-irrepressible alkaline phosphatases?. Microbiology 147, 2831–2839. [DOI] [PubMed] [Google Scholar]
- Kim A.; Benning M. M.; OkLee S.; Quinn J.; Martin B. M.; Holden H. M.; Dunaway-Mariano D. (2011) Divergence of chemical function in the alkaline phosphatase superfamily: Structure and mechanism of the P-C Bond cleaving enzyme phosphonoacetate hydrolase. Biochemistry 50, 3481–3494. [DOI] [PMC free article] [PubMed] [Google Scholar]
- Van Loo B.; Jonas S.; Babtie A. C.; Benjdia A.; Berteau O.; Hyvonen M.; Hollfelder F. (2010) An efficient, multiply promiscuous hydrolase in the alkaline phosphatase superfamily. Proc. Natl. Acad. Sci. U.S.A. 107, 2740–2745. [DOI] [PMC free article] [PubMed] [Google Scholar]
- Olguin L. F.; Askew S. E.; O’Donoghue A. C.; Hollfelder F. (2008) Efficient catalytic promiscuity in an enzyme superfamily: An arylsulfatase shows a rate acceleration of 1013 for phosphate monoester hydrolysis. J. Am. Chem. Soc. 130, 16547–16555. [DOI] [PubMed] [Google Scholar]
- O’Brien P. J.; Herschlag D. (1998) Sulfatase activity of E. coli alkaline phosphatase demonstrates a functional link to arylsulfatases, and evolutionarily related enzyme family. J. Am. Chem. Soc. 120, 12369–12370. [Google Scholar]
- Nikolic-Hughes I.; O’Brien P.; Herschlag D. (2005) Alkaline phosphatase catalysis is ultrasensitive to charge sequestered between the active site zinc ions. J. Am. Chem. Soc. 127, 9314–9315. [DOI] [PubMed] [Google Scholar]
- Zhang Z. Y.; Zhou G.; Denu J. M.; Wu L.; Tang X.; Mondesert O.; Russell P.; Butch E.; Guan K. L. (1995) Purification and characterization of the low molecular weight protein tyrosine phosphatase, Stp1, from the fission yeast Schizosaccharomyces pombe. Biochemistry 34, 10560–10568. [DOI] [PubMed] [Google Scholar]
- Zhang Y. L.; Zhang Z. Y. (1998) Low-affinity binding determined by titration calorimetry using a high-affinity coupling ligand: A thermodynamic study of ligand binding to protein tyrosine phosphatase 1B. Anal. Biochem. 261, 139–148. [DOI] [PubMed] [Google Scholar]
- Zhang Z. Y.; Clemens J. C.; Schubert H. L.; Stuckey J. A.; Fischer M. W.; Hume D. M.; Saper M. A.; Dixon J. E. (1992) Expression, purification, and physicochemical characterization of a recombinant Yersinia protein tyrosine phosphatase. J. Biol. Chem. 267, 23759–23766. [PubMed] [Google Scholar]
- Zalatan J.; Fenn T.; Herschlag D. (2008) Comparative enzymology in the alkaline phosphatase superfamily to determine the catalytic role of an active-site metal ion. J. Mol. Biol. 384, 1174–1189. [DOI] [PMC free article] [PubMed] [Google Scholar]
- O’Brien P. J.; Lassila J. K.; Fenn T. D.; Zalatan J. G.; Herschlag D. (2008) Arginine coordination in enzymatic phosphoryl transfer: Evaluation of the effect of Arg166 mutations in Escherichia coli alkaline phosphatase. Biochemistry 47, 7663–7672. [DOI] [PMC free article] [PubMed] [Google Scholar]
- Zalatan J.; Herschlag D. (2006) Alkaline phosphatase mono-and diesterase reactions: Comparative transition state analysis. J. Am. Chem. Soc. 128, 1293–1303. [DOI] [PMC free article] [PubMed] [Google Scholar]
- Wu L.; Zhang Z. Y. (1996) Probing the function of Asp128 in the lower molecular weight protein-tyrosine phosphatase-catalyzed reaction. A pre-steady-state and steady-state kinetic investigation. Biochemistry 35, 5426–5434. [DOI] [PubMed] [Google Scholar]
- O’Brien P. J.; Herschlag D. (2001) Functional interrelationships in the alkaline phosphatase superfamily: phosphodiesterase activity of Escherichia coli alkaline phosphatase. Biochemistry 40, 5691–5699. [DOI] [PubMed] [Google Scholar]
- Zhang Z. Y. (1998) Protein-Tyrosine phosphatases: Biological function, structural characteristics, and mechanism of catalysis. Crit. Rev. Biochem. Mol. Biol. 33, 1–52. [DOI] [PubMed] [Google Scholar]
- Zhang Z. Y.; Dixon J. E. (1994) Protein tyrosine phosphatases: Mechanism of catalysis and substrate specificity. Adv. Enzymol. Relat. Areas Mol. Biol. 68, 1–36. [DOI] [PubMed] [Google Scholar]
- Barford D.; Das A. K.; Egloff M. P. (1998) The structure and mechanism of protein phosphatases: Insights into catalysis and regulation. Annu. Rev. Biophys. Biomol. Struct. 27, 133–164. [DOI] [PubMed] [Google Scholar]
- Zhang Z. Y.; Wang Y. A.; Dixon J. E. (1994) Dissecting the catalytic mechanism of protein-tyrosine phosphatases. Proc. Natl. Acad. Sci. U.S.A. 91, 1624–1627. [DOI] [PMC free article] [PubMed] [Google Scholar]
- Fischer E. H.; Charbonneau H.; Tonks N. K. (1991) Protein tyrosine phosphatases - a diverse family of intracellular and transmembrane enzymes. Science 253, 401–406. [DOI] [PubMed] [Google Scholar]
- Labow B. I.; Herschlag D.; Jencks W. P. (1993) Catalysis of the hydrolysis of phosphorylated pyridines by alkaline phosphatase has little or no dependence on the pKa of the leaving group. Biochemistry 32, 8737–8741. [DOI] [PubMed] [Google Scholar]
- Hengge A. C.; Edens W. A.; Elsing H. (1994) Transition-state structures for phosphoryl-transfer reactions of p-nitrophenyl phosphate. J. Am. Chem. Soc. 116, 5045–5049. [Google Scholar]
- Simopoulos T. T.; Jencks W. P. (1994) Alkaline phosphatase is an almost perfect enzyme. Biochemistry 33, 10375–10380. [DOI] [PubMed] [Google Scholar]
- O’Brien P. J.; Herschlag D. (2002) Alkaline phosphatase revisited: Hydrolysis of alkyl phosphates. Biochemistry 41, 3207–3225. [DOI] [PubMed] [Google Scholar]
- Kirby A.; Jencks W. (1965) The reactivity of nucleophilic reagents toward the p-nitrophenyl phosphate dianion. J. Am. Chem. Soc. 87, 3209–3216. [Google Scholar]
- Kirby A.; Varvoglis A. (1967) The reactivity of phosphate esters. Monoester hydrolysis. J. Am. Chem. Soc. 89, 415–423. [Google Scholar]
- Thatcher G. R. J.; Kluger R. (1989) Mechanism and catalysis of nucleophilic substitution in phosphate esters. Adv. Phys. Org. Chem. 25, 99–265. [Google Scholar]
- Hengge A. (2005) Mechanistic studies on enzyme-catalyzed phosphoryl transfer. Adv. Phys. Org. Chem. 40, 49–108. [Google Scholar]
- Benkovic S. J.; Benkovic P. A. (1966) Studies on sulfate esters. I. Nucleophilic reactions of amines with p-nitrophenyl sulfate. J. Am. Chem. Soc. 88, 5504–5511. [Google Scholar]
- Fendler E. J.; Fendler J. H. (1968) Hydrolysis of nitrophenyl and dinitrophenyl sulfate esters. J. Org. Chem. 33, 3852–3859. [Google Scholar]
- Hopkins A.; Day R. A.; Williams A. (1983) Sulfate group transfer between nitrogen and oxygen: Evidence consistent with an open “exploded’ transition state. J. Am. Chem. Soc. 105, 6062–6070. [Google Scholar]
- Bourne N.; Hopkins A.; Williams A. (1985) Single transition state for sulfuryl group (-SO3-) transfer between pyridine nucleophiles. J. Am. Chem. Soc. 107, 4327–4331. [Google Scholar]
- Lassila J. K.; Zalatan J. G.; Herschlag D. (2011) Biological phosphoryl transfer reactions: Understanding mechanism and catalysis. Annu. Rev. Biochem. 80, 669–702. [DOI] [PMC free article] [PubMed] [Google Scholar]
- Catrina I.; O’Brien P. J.; Purcell J.; Nikolic-Hughes I.; Zalatan J. G.; Hengge A. C.; Herschlag D. (2007) Probing the origin of the compromised catalysis of E. coli alkaline phosphatase in its promiscuous sulfatase reaction. J. Am. Chem. Soc. 129, 5760–5765. [DOI] [PMC free article] [PubMed] [Google Scholar]
- Zalatan J. G.; Catrina I.; Mitchell R.; Grzyska P. K.; O’Brien P. J.; Herschlag D.; Hengge A. C. (2007) Kinetic isotope effects for alkaline phosphatase reactions: Implications for the role of active-site metal ions in catalysis. J. Am. Chem. Soc. 129, 9789–9798. [DOI] [PMC free article] [PubMed] [Google Scholar]
- Nikolic-Hughes I.; Rees D. C.; Herschlag D. (2004) Do electrostatic interactions with positively charged active site groups tighten the transition state for enzymatic phosphoryl transfer?. J. Am. Chem. Soc. 126, 11814–11819. [DOI] [PubMed] [Google Scholar]
- Hengge A. C.; Edens W. A.; Elsing H. (1994) Transition-state structures for phosphoryl-transfer reactions of p-nitrophenyl phosphate. J. Am. Chem. Soc. 116, 5045–5049. [Google Scholar]
- Hoff R. H.; Larsen P.; Hengge A. C. (2001) Isotope effects and medium effects on sulfuryl transfer reactions. J. Am. Chem. Soc. 123, 9338–9344. [DOI] [PubMed] [Google Scholar]
- Sigala P.; Kraut D.; Caaveiro J.; Pybus B.; Ruben E.; Ringe D.; Petsko G.; Herschlag D. (2008) Testing geometrical discrimination within an enzyme active site: Constrained hydrogen bonding in the ketosteroid isomerase oxyanion hole. J. Am. Chem. Soc. 130, 13696–13708. [DOI] [PMC free article] [PubMed] [Google Scholar]
- Fuhrmann C. N.; Kelch B. A.; Ota N.; Agard D. A. (2004) The 0.83 A resolution crystal structure of alpha-lytic protease reveals the detailed structure of the active site and identifies a source of conformational strain. J. Mol. Biol. 338, 999–1013. [DOI] [PubMed] [Google Scholar]
- Elias M.; Wellner A.; Goldin-Azulay K.; Chabrire E.; Vorholt J.; Erb T.; Tawfik D. S. (2012) The molecular basis of phosphate discrimination in arsentate-rich environments. Nature 491, 134–137. [DOI] [PubMed] [Google Scholar]
- Abell K.; Kirby A. (1986) Acceleration of P-O cleavage reactions of phosphate monoester dianions in dipolar aprotic solvents. Tetrahedron Lett. 27, 1085–1088. [Google Scholar]
- Montserat J.; Chen L.; Lawrence D. S.; Zhang Z. Y. (1996) Potent low molecular weight substrates for protein-tyrosine phosphatase. J. Biol. Chem. 271, 7868–7872. [DOI] [PubMed] [Google Scholar]
- McDonald W. S.; Cruickshank D. W. (1971) Crystal structure of dipotassium ethyl phosphate tetrahydrate K2(C2H5)PO4.4H2O: A problem in pseudo-symmetry. Acta Crystallogr. B27, 1315–1319. [Google Scholar]
- Jarvis J. A. J. (1953) Crystal structure of potassium ethyl sulphate. Acta Crystallogr. 6, 327–330. [Google Scholar]
- Truter M. R. (1958) A detailed refinement of the crystal structure of potassium ethyl sulphate. Acta Crystallogr. 11, 680–685. [Google Scholar]
- Sali A.; Blundell T. L. (1993) Comparative protein modeling by satisfaction of spatial restraints. J. Mol. Biol. 234, 779–815. [DOI] [PubMed] [Google Scholar]
- DeLano W. (2007) MacPyMOL: A PyMOL-based molecular graphics application for MacOS X, DeLano Scientific LLC, Palo Alto, CA. [Google Scholar]
- Baker N. A.; Sept D.; Joseph S.; Holst M. J.; McCammon J. A. (2001) Electrostatics of nanosystems: Application to microtubules and the ribosome. Proc. Natl. Acad. Sci. U.S.A. 98, 10037–10041. [DOI] [PMC free article] [PubMed] [Google Scholar]
- Zhang M.; Zhou M.; Van Etten R. L.; Stauffacher C. V. (1997) Crystal structure of bovine low molecular weight phosphotyrosyl phosphatase complexed with the transition state analog vanadate. Biochemistry 36, 15–23. [DOI] [PubMed] [Google Scholar]
- Bobyr E.; Lassila J.; Wiersma-Koch H.; Fenn T.; Lee J.; Nikolic-Hughes I.; Hodgson K.; Rees D.; Hedman B.; Herschlag D. (2012) High-resolution analysis of Zn2+ coordination in the alkaline phosphatase superfamily by EXAFS and x-ray crystallography. J. Mol. Biol. 415, 102–117. [DOI] [PMC free article] [PubMed] [Google Scholar]
Associated Data
This section collects any data citations, data availability statements, or supplementary materials included in this article.