ABSTRACT
Objectives:
With the introduction of smaller probes (S1, S2), the use of transient elastography has been expanded to children. Accordingly, we aimed to address points of consideration in probe choice and interpretation of measured liver stiffness by applying and comparing FibroScan S and M probes in biliary atresia.
Methods:
Using S1, S2, and M probes, 3 liver stiffness measurements, success rates, and interquartile ranges were obtained from 100 patients. Patients were assigned to 2 groups according to thoracic perimeter (≤45 cm vs >45 cm). In both groups, obtained values were compared and the relation between liver stiffness measurement and aspartate aminotransferase-to-platelet ratio index was analyzed.
Results:
In the small-thorax group, the success rate was highest with the S1 probe and the intraclass correlation coefficient (ICC) was highest for S1 versus S2 (0.98), compared with that for S1 versus M (0.69) and S2 versus M (0.77). In the large-thorax group, ICC was the highest for S2 versus M (0.88), compared with that for S1 versus S2 (0.69) and S1 versus M (0.51). In the small-thorax group, correlations between aspartate aminotransferase-to-platelet ratio index and liver stiffness measurement were stronger for S1 (0.65) and S2 (0.64) than for M (0.49). In the large-thorax group, all probes showed good correlation, S1 (0.68), S2 (0.62), and M (0.62).
Conclusions:
We recommend that the S1 probe is more appropriate for use in small children, especially those with a thorax perimeter of <45 cm. If no S probe is available, the M probe may be acceptable in children whose thorax perimeter is >45 cm.
Keywords: biliary atresia, children, liver fibrosis, transient elastography
See “Scanning the Scars: The Utility of Transient Elastography in Young Children” by Fitzpatrick and Dhawan on page 551.
Transient elastography (TE) is known as a useful noninvasive tool for the evaluation of liver fibrosis or prediction of esophageal/gastric varices in chronic liver disease, even in children (1,2). The S probes (S1, S2) of FibroScan, a TE, have been developed for use in children or small adults with thin subcutaneous tissue, narrow intercostal spaces, and small livers. The use of these S probes for children appears to be appropriate, and some studies have assessed the feasibility of these probes in children (3,4). Control values of TE for children (4.7 ± 1.08 kPa) have also been introduced (4); however, clinical data for small children are lacking. Goldschmidt et al systematically analyzed technical issues for TE in children (5). Based on their study, we further analyzed practical issues for TE in much younger and more severely affected patients than in previous studies (4,5). Biliary atresia, as a subject of study, was believed to be appropriate because of its rapid progression of liver fibrosis, even in infancy, and its wide spectrum of liver stiffness values. We applied S1, S2, and M probes in young patients with biliary atresia in an attempt to provide guidelines for probe choice and interpretation of results.
METHODS
Study Population and Data Collection
From October 2010 to September 2012, 100 patients (mean age 3.87 years) with biliary atresia were enrolled consecutively who had undergone Kasai hepatoportoenterostomy but had not received liver transplantation. TE was not performed for the patients who were experiencing acute cholangitis, hepatic failure, and significant ascites. Patients whose thoracic perimeter was >75 cm were excluded, because we were to evaluate the characteristics of pediatric patients with small body size. Patients’ height, weight, and thoracic perimeter were measured, and body mass index was calculated. TE and laboratory tests, including complete blood cell count and aspartate aminotransferase assessment, were performed on the same day. The aspartate aminotransferase-to-platelet ratio index (APRI), one of the validated noninvasive markers of liver fibrosis, was calculated and compared with the results of TE (6). The present study protocol was approved by the institutional review board of the Severance Children's Hospital.
Transient Elastography
TE (FibroScan, Echosens, Paris, France) was performed by 1 well-trained and experienced nurse who was not informed of patients’ clinical data (7,8). The M probe has a transducer with a diameter of 7 mm and can measure 35 to 75 mm depth of the liver, whereas the S1 and S2 probes have transducers of 5 mm diameter (to accommodate the narrow intercostal space of children) and are designed to measure 15 to 40 and 20 to 50 mm depth of the liver, respectively. The ultrasonic frequency of M probe is set at 3.5 MHz, and that of S1 and S2 probes is set at 5 MHz because of the thinner tissue between skin and the liver parenchyma. The measurements were performed by placing a probe tip on the intercostal space at the area of the right lobe of the liver. The optimal target area was selected by ultrasound examination, avoiding large vascular structures. TE measurements were conducted according to the manufacturer's recommendations without administering sedative drugs. All of the patients were examined with the 3 types of probes even though the manufacturer had recommended a single suitable probe for the patients’ thoracic perimeter (S1 probe for ≤45 cm, S2 probe for 45–75 cm, and M probe for >75 cm). Liver stiffness was measured repeatedly using the S1, S2, and M probes in each patient for obtaining >10 valid measurements per probe. Success rates (the ratio of valid shots to the total number of shots) with the probes were recorded and analyzed. For determining reproducibility of measurements, interquartile range (IQR)/median liver stiffness was recorded.
Statistical Analysis
Patients were divided into 2 groups based on their thoracic perimeter (≤45 and >45 cm). Thoracic perimeters were measured at the level of the xiphoid process. Basic patient characteristics were compared using the t test. Liver stiffness measurement (LSM), success rate, and IQR/LSM of each probe in both groups were compared using a mixed model (post hoc Bonferroni correction). Intraclass correlation coefficient (ICC) analyses were performed to evaluate the reliability of LSM between different probes in each patient group. A Bland-Altman plot was drawn to determine the reproducibility and reliability of measurements. Correlations between LSMs obtained using each probe and the patients’ APRI were analyzed. All statistical analyses were performed using PASW Statistics software (version 18.0, SPSS Inc, Chicago, IL). A P value <0.05 was considered statistically significant.
RESULTS
Patient Characteristics
Among the 100 patients, 26 were assigned to the small thoracic perimeter group (≤45 cm) and 74 were assigned to the large thoracic perimeter group (>45 cm). Characteristics of the study population are listed in Table 1. Age, height, weight, and body mass index differed among the groups (P < 0.05), but APRI and LSM did not.
TABLE 1.
Characteristics of the study population
| Indicator | Total patients (N = 100) | Thoracic perimeter ≤45 cm (n = 26) | Thoracic perimeter >45 cm (n = 74) | P |
| Sex, male:female | 38:62 | 11:15 | 27:47 | NS |
| Age (range), y | 3.9 ± 3.3 | 0.4 ± 0.3 (0.2–1.4) | 5.7 ± 2.8 (1.0–13.6) | <0.001 |
| Thoracic perimeter, cm | 54.0 ± 10.0 | 40.0 ± 3.1 | 58.9 ± 6.1 | <0.001 |
| Height, cm | 97.4 ± 28.3 | 60.4 ± 10.6 | 110.4 ± 19.6 | <0.001 |
| Weight, kg | 17.4 ± 10.3 | 7.7 ± 11.4 | 20.8 ± 7.4 | <0.001 |
| BMI | 16.27 ± 2.23 | 15.10 ± 2.30 | 16.70 ± 2.10 | 0.003 |
| Direct bilirubin, mg/dL | 0.9 ± 1.0 | 1.8 ± 1.3 | 0.5 ± 0.6 | <0.001 |
| Albumin, g/dL | 3.9 ± 0.6 | 3.4 ± 0.5 | 4.0 ± 0.6 | <0.001 |
| APRI | 2.04 ± 1.71 | 2.19 ± 2.12 | 1.99 ± 1.56 | 0.624 |
| LSM by S1 probe, kPa | 20.6 ± 17.9 | 19.5 ± 20.0 | 21.1 ± 17.2 | 0.712 |
| LSM by S2 probe, kPa | 15.4 ± 12.8 | 17.3 ± 18.1 | 14.4 ± 10.1 | 0.440 |
| LSM by M probe, kPa | 12.3 ± 9.8 | 12.0 ± 11.2 | 12.5 ± 9.8 | 0.874 |
APRI = aspartate aminotransferase-to-platelet ratio index; BMI = body mass index; LSM = liver stiffness measurement; NS = not significant.
Comparison of Success Rates Among Probes
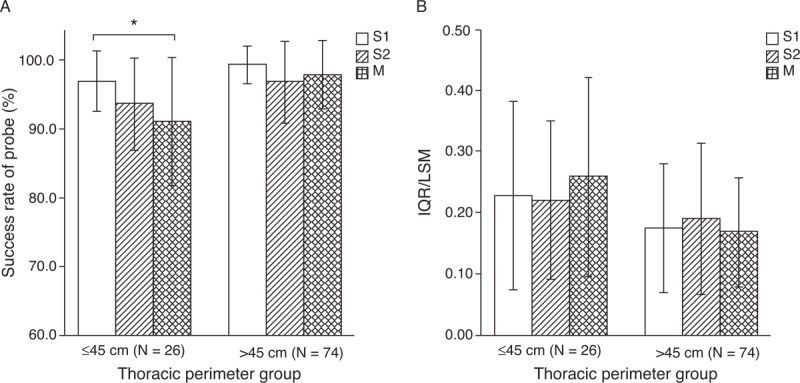
Success rates of TE with each probe were recorded in both groups (Fig. 1A). Success rates of the S1, S2, and M probes were 96.9% ± 4.4%, 93.6% ± 6.7%, and 91.0% ± 9.2%, respectively, in patients with a small thoracic perimeter; the corresponding values were 99.3% ± 2.7%, 96.8% ± 5.9%, and 97.0% ± 5.0%, respectively, in patients with a large thoracic perimeter. The success rate of the S1 probe was significantly higher than that of the M probe in the small thoracic perimeter group (P < 0.01).
FIGURE 1.

Success rates (A) and IQR/LSM ratios (B) of S1, S2, and M probes in the large thoracic perimeter group and the small thoracic perimeter group. (∗) Success rate of the S1 probe was significantly higher than that of the M probe in the small thoracic perimeter group (P = 0.0016). The IQR/LSM ratio among probes in both groups was not significantly different. Data are expressed as mean ± standard deviation. IQR = interquartile range; LSM = liver stiffness measurement.
Comparison of IQR/LSM Among Probes
The IQR/LSM ratios with the S1, S2, and M probes were calculated to assess the reliability of the test. The results were 0.23 ± 0.15, 0.20 ± 0.13, and 0.26 ± 0.16, respectively, in the small thoracic perimeter group and 0.17 ± 0.10, 0.14 ± 0.09, and 0.17 ± 0.09, respectively, in the large thoracic perimeter group. The mean IQR/LSM was larger in the small thoracic perimeter group (Fig. 1B).
Correlation of Measured Liver Stiffness Between Probes: S1 Versus S2, S1 Versus M, and S2 Versus M
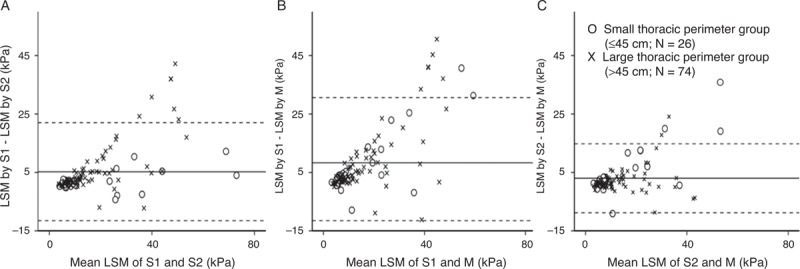
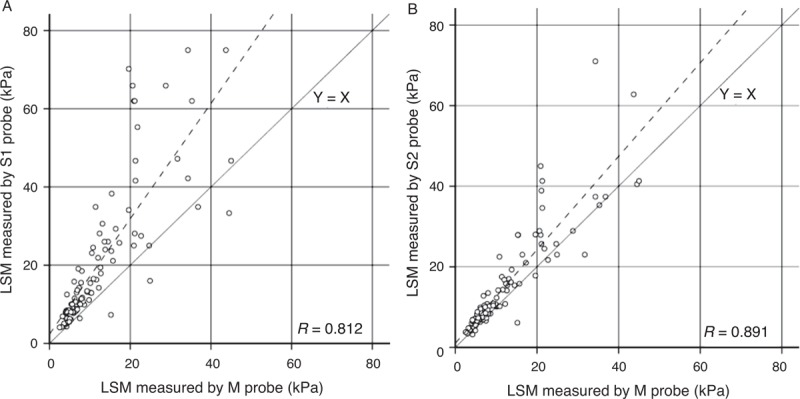
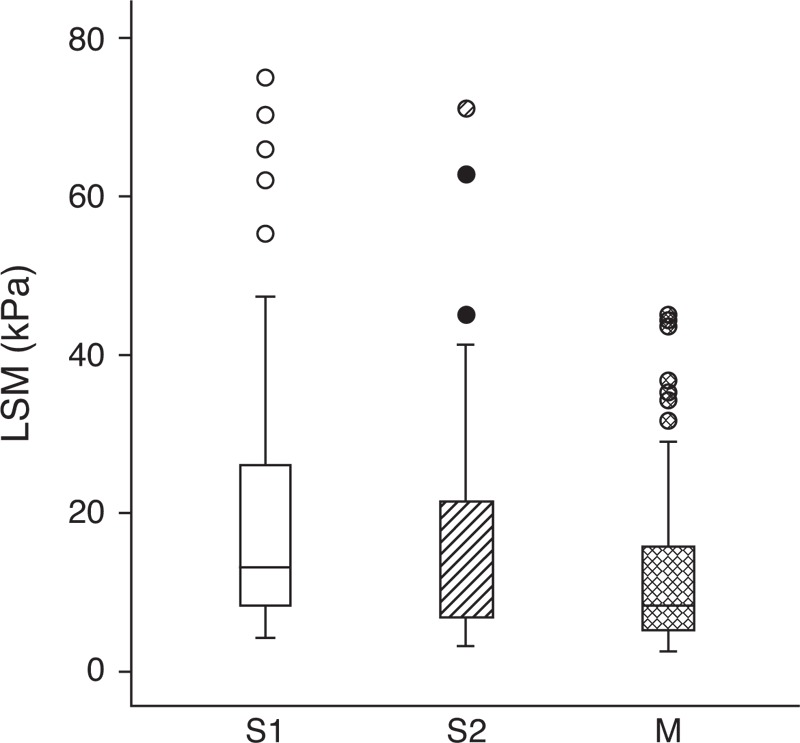
ICC was used to evaluate the correlation of LSM among the various probes (Table 2). In the small thoracic perimeter group, the ICC of S1 versus S2 was highest (0.98). In the large thoracic perimeter group, the ICC of S2 versus M was highest (0.88). Regardless of thoracic perimeter, the ICC of LSM obtained using every probe showed more than moderate correlation (ICC >0.50). On the Bland-Altman plot, most points were within 2 standard deviations, thus demonstrating fair consonance between results with the 2 probes; however, some outliers were noted in patients with large mean LSM (Fig. 2). On a simple scatterplot, S probe seems to show large LSM compared with the M probe (Fig. 3). According to the linear mixed model, LSMs (mean ± SD) of the S1, S2, and M probes were 20.6 ± 17.9, 15.4 ± 12.8, and 12.3 ± 9.8 kPa, respectively; significant differences were observed among probes: S1 versus S2 (P < 0.001), S1 versus M (P < 0.001), and S2 versus M (P = 0.003). Figure 4 shows distributions of LSM values according to the probe with box-and-whisker plots.
TABLE 2.
Intraclass correlation coefficient (ICC) between probes
| ICC (95% confidence interval) of LSM measured by each probe | |||
| S1 and S2 | S1 and M | S2 and M | |
| Total (N = 100) | 0.80 (0.72–0.86) | 0.56 (0.41–0.68) | 0.83 (0.76–0.88) |
| ≤45 cm (n = 26) | 0.98 (0.95–0.99) | 0.69 (0.42–0.85) | 0.77 (0.55–0.89) |
| >45 cm (n = 74) | 0.69 (0.55–0.79) | 0.51 (0.32–0.66) | 0.88 (0.82–0.92) |
LSM = liver stiffness measurement.
FIGURE 2.

Bland-Altman plot of the difference in LSM by 2 different probes versus the mean of LSM. The solid lines indicate mean difference, and dotted lines represent 2 standard deviations between 2 probes. A, S1 and S2, 5.2 ± 16.8 kPa; (B) S1 and M, 8.3 ± 22.3 kPa; and (C) S2 and M, 3.0 ± 11.8 kPa. Outliers are noted in patients with high mean LSM. LSM = liver stiffness measurement.
FIGURE 3.

Correlations among LSMs determined using various probes. A, S1 and M; (B) S2 and M. LSM determined using S1 and S2 probes was higher than that determined using the M probe. LSM = liver stiffness measurement.
FIGURE 4.

Box-and-whisker plot of LSM showing distributions of LSM according to the probe. The box represents the interquartile range, and the line in the box shows the median value. The whiskers indicate the highest and lowest values, and the circles represent outliers. LSM = liver stiffness measurement.
Analysis of Correlation Between APRI and LSM
In the small thoracic perimeter group, the correlation coefficient of APRI and LSM measured with the S1 and S2 probes was 0.65 and 0.64, respectively; however, the correlation coefficient of APRI and LSM measured with M probe in this group showed a relatively low value of 0.49. In contrast, in the large thoracic perimeter group, the correlation of APRI and LSM was good with all probes (S1 = 0.68, S2 = 0.63, and M = 0.62) (Table 3).
TABLE 3.
Correlation between APRI and LSM by each probe
| ≤45 cm (N = 26) | >45 cm (N = 74) | |||||
| LSM by S1 | LSM by S2 | LSM by M | LSM by S1 | LSM by S2 | LSM by M | |
| R | 0.65 | 0.64 | 0.49 | 0.68 | 0.63 | 0.62 |
| P | <0.001 | <0.001 | 0.011 | <0.001 | <0.001 | <0.001 |
APRI = aspartate aminotransferase-to-platelet ratio index; LSM = liver stiffness measurement; R = correlation coefficient.
DISCUSSION
Determination of the degree of fibrosis in a chronically diseased liver is valuable because it provides physicians the ability to predict the development of liver-related complications. Although histopathologic examination of the liver is regarded as the criterion standard for assessing liver fibrosis (9), the invasiveness of the test seriously limits its application. In particular, repeated examinations on serial follow-up, especially in infants and children, are nearly impossible. In contrast, TE, a physical (ultrasonographic) method for evaluating fibrosis, is simple and noninvasive (10) and has been analyzed in many adults and some pediatric studies (2,3,11,12). Because of its noninvasiveness, TE has already been widely used in children, despite a lack of clinical data. For more valid application, studies on normal values have been conducted: a study of a healthy Chinese population revealed different normal LSM values, according to sex and age (13). Also, Engelmann et al reported age-dependent reference values for LSM in children (4.40–5.10 kPa) that showed high stiffness in older children (4).
In the present study, we attempted to outline some practical issues when measuring TE in small patients. To highlight the impact of small body size, patients with biliary atresia of a much younger age than those in previous studies (9.11 and 10.7 years vs 3.87 years) were enrolled (2,3). Furthermore, to our knowledge, this is the first direct comparison of S1, S2, and M probes.
All of the probes used in both of our thoracic perimeter groups had success rates of >90%. This high rate may reflect the skill of our operator, who was well trained and has performed >15,000 TE examinations (7,8). The success rate was higher in the large thoracic perimeter group, which probably illustrates the difficulty of measuring LSM in smaller children. We also found that in children with a small thoracic perimeter, the success rate of the S1 probe was significantly higher than that of the M probe, thus illustrating that the smaller probe is advantageous for the examination of small children. The IQR/LSM, the index of reliability and reproducibility (14,15), was higher in children with a small thoracic perimeter than in those with a large thoracic perimeter. These findings suggest that TE has some limitations in small children. Although there were no statistically significant differences, the IQR/LSM of the S1 and S2 probes were lower than those of the M probe in children with a small thoracic perimeter, further illustrating the advantage of using the S probes for small patients. When obtaining LSM in children, irritability or motion can hamper repeated measurement of the same area of the liver, and relatively small structures can make it difficult to identify just the parenchyma of the liver. Furthermore, narrow intercostal space may interrupt the propagation of the elastic shear wave (4). In the small thoracic perimeter group, the S probes showed better correlation than the M probe with APRI, which is known to be correlated with the degree of liver fibrosis (6). Although we did not compare the probes with the criterion standard, these findings support the usage of S probe for small children.
For routine application of the S probe, however, there are some issues that need to be clarified. In our study, LSM tended to decrease with increase in the size of the probes (S1 > S2 > M), as has been reported (16,17). Some studies (5,18) have regarded this phenomenon as “overestimation of the S probe”; however, it may reflect “underestimation of the M probe” on the basis of better correlation between the S probe and APRI. We also found that the tendency toward differences in LSM among the probes used was larger in patients with high LSM, a result similar to that reported previously (17). Therefore, caution is needed when interpreting values measured by the S probe and patients with high LSM values. Goldschmidt et al (5) reported that measuring conditions such as feeding status or general anesthesia can influence the results of TE. For objective evaluation, standardization of measuring protocol is needed. There are limitations to the present study. One is that we could not keep the same nil per os time before measuring LSM in all of the patients. Furthermore, liver biopsy should have been performed for decisive comparison.
In conclusion, the S probe has distinct merits in its high success rate and good correlation with APRI, especially in small children. Therefore, we recommend the use of the S1 probe in patients whose thoracic perimeter is <45 cm, and if the S probe is not available, the M probe may be acceptable for use in pediatric patients whose thoracic perimeter is >45 cm. Because of possible differences, LSM values measured with a different probe should not be compared directly. For using LSM as an objective indicator, further clarification of reference ranges or cutoff values for each probe is needed.
Acknowledgments
The authors are grateful to Hye Sun Lee, PhD, and Dong Wook Kim, PhD, in the Department of Research Affairs, Biostatistics Collaboration Unit, Yonsei University College of Medicine, for invaluable help with the statistical analysis.
Footnotes
The present study was supported by a faculty research grant of Yonsei University College of Medicine for 2013 (6-2013-0102).
The authors report no conflicts of interest.
REFERENCES
- 1.Fitzpatrick E, Quaglia A, Vimalesvaran S, et al. Transient elastography is a useful noninvasive tool for the evaluation of fibrosis in paediatric chronic liver disease. J Pediatr Gastroenterol Nutr 2013; 56:72–76. [DOI] [PubMed] [Google Scholar]
- 2.Chongsrisawat V, Vejapipat P, Siripon N, et al. Transient elastography for predicting esophageal/gastric varices in children with biliary atresia. BMC Gastroenterol 2011; 11:41. [DOI] [PMC free article] [PubMed] [Google Scholar]
- 3.de Ledinghen V, Le Bail B, Rebouissoux L, et al. Liver stiffness measurement in children using FibroScan: feasibility study and comparison with Fibrotest, aspartate transaminase to platelets ratio index, and liver biopsy. J Pediatr Gastroenterol Nutr 2007; 45:443–450. [DOI] [PubMed] [Google Scholar]
- 4.Engelmann G, Gebhardt C, Wenning D, et al. Feasibility study and control values of transient elastography in healthy children. Eur J Pediatr 2012; 171:353–360. [DOI] [PubMed] [Google Scholar]
- 5.Goldschmidt I, Streckenbach C, Dingemann C, et al. Application and limitations of transient liver elastography in children. J Pediatr Gastroenterol Nutr 2013; 57:109–113. [DOI] [PubMed] [Google Scholar]
- 6.Kim SY, Seok JY, Han SJ, et al. Assessment of liver fibrosis and cirrhosis by aspartate aminotransferase-to-platelet ratio index in children with biliary atresia. J Pediatr Gastroenterol Nutr 2010; 51:198–202. [DOI] [PubMed] [Google Scholar]
- 7.Jung KS, Kim SU, Ahn SH, et al. Risk assessment of hepatitis B virus-related hepatocellular carcinoma development using liver stiffness measurement (FibroScan). Hepatology 2011; 53:885–894. [DOI] [PubMed] [Google Scholar]
- 8.Kim SU, Lee JH, Kim do Y, et al. Prediction of liver-related events using FibroScan in chronic hepatitis B patients showing advanced liver fibrosis. PLoS One 2012; 7:e36676. [DOI] [PMC free article] [PubMed] [Google Scholar]
- 9.Castera L. Assessing liver fibrosis. Expert Rev Gastroenterol Hepatol 2008; 2:541–552. [DOI] [PubMed] [Google Scholar]
- 10.Yang HR, Kim HR, Kim MJ, et al. Noninvasive parameters and hepatic fibrosis scores in children with nonalcoholic fatty liver disease. World J Gastroenterol 2012; 18:1525–1530. [DOI] [PMC free article] [PubMed] [Google Scholar]
- 11.Castera L, Vergniol J, Foucher J, et al. Prospective comparison of transient elastography, Fibrotest, APRI, and liver biopsy for the assessment of fibrosis in chronic hepatitis C. Gastroenterology 2005; 128:343–350. [DOI] [PubMed] [Google Scholar]
- 12.Sini M, Sorbello O, Civolani A, et al. Non-invasive assessment of hepatic fibrosis in a series of patients with Wilson's disease. Dig Liver Dis 2012; 44:487–491. [DOI] [PubMed] [Google Scholar]
- 13.Fung J, Lee CK, Chan M, et al. Defining normal liver stiffness range in a normal healthy Chinese population without liver disease. PLoS One 2013; 8:e85067. [DOI] [PMC free article] [PubMed] [Google Scholar]
- 14.Wong GL, Wong VW, Chim AM, et al. Factors associated with unreliable liver stiffness measurement and its failure with transient elastography in the Chinese population. J Gastroenterol Hepatol 2011; 26:300–305. [DOI] [PubMed] [Google Scholar]
- 15.Cohen EB, Afdhal NH. Ultrasound-based hepatic elastography: origins, limitations, and applications. J Clin Gastroenterol 2010; 44:637–645. [DOI] [PubMed] [Google Scholar]
- 16.Myers RP, Pomier-Layrargues G, Kirsch R, et al. Feasibility and diagnostic performance of the FibroScan XL probe for liver stiffness measurement in overweight and obese patients. Hepatology 2012; 55:199–208. [DOI] [PubMed] [Google Scholar]
- 17.de Ledinghen V, Wong VW, Vergniol J, et al. Diagnosis of liver fibrosis and cirrhosis using liver stiffness measurement: comparison between M and XL probe of FibroScan(R). J Hepatol 2012; 56:833–839. [DOI] [PubMed] [Google Scholar]
- 18.Pradhan F, Ladak F, Tracey J, et al. Feasibility and reliability of the FibroScan S2 (pediatric) probe compared with the M probe for liver stiffness measurement in small adults with chronic liver disease. Ann Hepatol 2013; 12:100–107. [PubMed] [Google Scholar]


