Abstract.
We present portable preclinical low-coherence interference (LCI) instrumentation for aiding fine needle aspiration biopsies featuring the second-generation LCI-based biopsy probe and an improved scoring algorithm for tissue differentiation. Our instrument and algorithm were tested on 38 mice with cultured tumor mass and we show the specificity, sensitivity, and positive predictive value of tumor detection of over 0.89, 0.88, and 0.96, respectively.
Keywords: low coherence interferometry, fine-needle aspiration biopsy, tissue-type differentiation, breast cancer biopsy aiding capabilities
1. Introduction
Each year in the US alone, over 200,000 women are diagnosed with breast cancer and 1 in 8 women will carry the diagnosis over the course of a lifetime.1 Breast cancer remains a leading cause of death in women as it is responsible for about 40,000 deaths each year in the US.1 Since the rate of cancer survival rapidly declines with the delay in diagnosis and treatment,2 there is a pressing need for accurate detection of breast cancer during the initial exam at early stages to reduce the potential revision operations.
Although various techniques such as magnetic resonance imaging, x-ray computed tomography (CT), ultrasound, and mammography are clinically used to detect the presence of breast cancer, breast biopsy is needed to definitively establish the diagnosis prior to treatment. Although the diagnostic yield of breast biopsy remains relatively high (over 90%) for large masses,3 smaller masses are more difficult to sample with a reduced diagnostic yield of about 60%.4 Among the three major types of breast biopsies that are routinely performed—fine-needle aspiration biopsy (FNAB), core needle biopsy, and excisional lumpectomy—FNAB using a 23 gauge (Ga) or smaller needle is the least invasive and, therefore, the least risky and most tolerable procedure.5,6 For palpable mass lesions, most FNAB procedures are performed without the aid of ultrasound-guidance. Although this technique is certainly adequate in many instances, the diagnostic yield of the FNAB may be relatively modest depending on the training of the biopsy physician.7
Ultrasound-based imaging techniques have shown to increase the diagnostic yield by helping the radiologist to more precisely place the needle within the suspicious mass.8,9 Improved diagnosis and early detection of cancer could spare patients from more invasive and traumatizing surgical procedures. However, in addition to proper needle placement, several factors can impact the success of the biopsy. Such factors include tumor heterogeneity, which results in sampling errors, suboptimal preparation of the cytology/histology slides, and limited experience of the radiologist and cytopathologist. In particular, tumor heterogeneity plays an important role in biopsy yield.10,11 Tumors can have varying degrees of necrosis, fibrosis, and tissue repair admixed with tumor tissue. These additional tissue types negatively impact the diagnostic yield. For example, the aspiration of the nonviable area of the tumor results in a nondiagnostic FNAB in about 20% of the cases.3 Therefore, acquiring adequate aspirate material that can be used for cytologic interpretation remains challenging. Needle placement in a cancer-rich environment would substantially reduce the number of nondiagnostic aspirates and, therefore, the frequency of repeated biopsies. Although nonoptical image-guidance modalities, such as CT or ultrasound, help to see a mass distinct from the normal breast tissue, their limited resolution does not allow identifying tissue cellularity, which is defined as the composition of the tissue with regards to the categories of constituent cells.
Optical approaches such as optical coherence tomography (OCT) and low-coherence interferometry (LCI), the nonimaging variant of OCT, have been successfully applied toward tissue discrimination between cancerous and noncancerous breast lesions.12–16 OCT and LCI are advantageous over radiological and ultrasonic imaging because they can probe the tissue with high resolution (5 to ) and thus they can be used to evaluate cellularity. Furthermore, these techniques use a probe that can be fitted in a fine needle bore providing the potential for real-time analysis during the initial FNAB.11,16 The main challenge remains in building reliable minimally invasive probes that can be used in conjunction with very small bore biopsy needles (22 to 25 Ga) and in automatically processing LCI or OCT findings to provide real-time feedback to the physician performing the biopsy. Our group has previously demonstrated prototype OCT probes and automated algorithms for differentiating among tumor, adipose, and fibrous human breast tissues.16–18
In this paper, we report advancements in the LCI instrumentation and data processing for aiding FNABs. A new highly engineered instrument and a recently designed hand-held LCI/biopsy probe, as well as an improved scoring algorithm for automated differentiation of the three major tissue types (adipose, muscle, and tumor) are presented. This technology was tested in vivo on the tumor masses of mice and correlated with cytology/histology results. The capability of the algorithm for reliable differentiation of tissue types at the tip of the biopsy needle was demonstrated. We report improved sensitivity, specificity, and the positive predictive value (PPV) over our previous studies.
2. Methods
2.1. Instrumentation
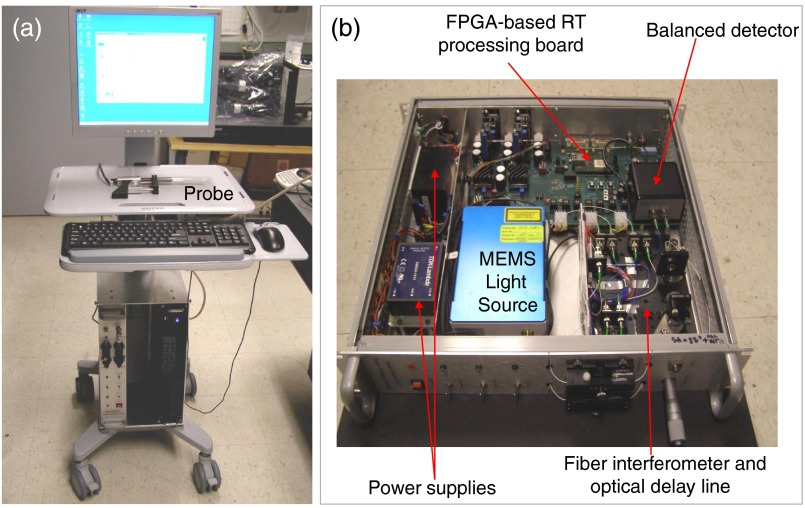
An LCI instrument, based on the Fourier domain swept source approach, was developed and used in our study. The instrument is based on a fiber optic Michelson interferometer that uses a 1310 nm 16 kHz MEMS-based light source (SANTEC, Japan) with a bandwidth of about 80 nm and a specially designed LCI-biopsy probe in the sample arm. The theoretical axial resolution provided by the source is in the order of in tissue (given by , where is the bandwidth of the light source and is the refractive index of the tissue). The instrument was engineered to meet the clinical requirements: portability, ease of setting, use of a hand-held probe, and relatively small overall foot print. Pictures of the instrument are shown in Fig. 1.
Fig. 1.
Low-coherence interference (LCI) instrument. (a) General view and (b) detail of the instrumentation unit.
The instrumentation box and the computer are compact (2U/19 in. format). The instrumentation box includes the light source, the power supplies, a fiber optic interferometer, and an optical delay line. The processing of the LCI signal (background subtraction, interpolation, fast Fourier transforms, and dispersion compensation) is performed in the field programmable gate array while a graphical processing unit (GPU), residing in the computer, is used for LCI data analysis and display.
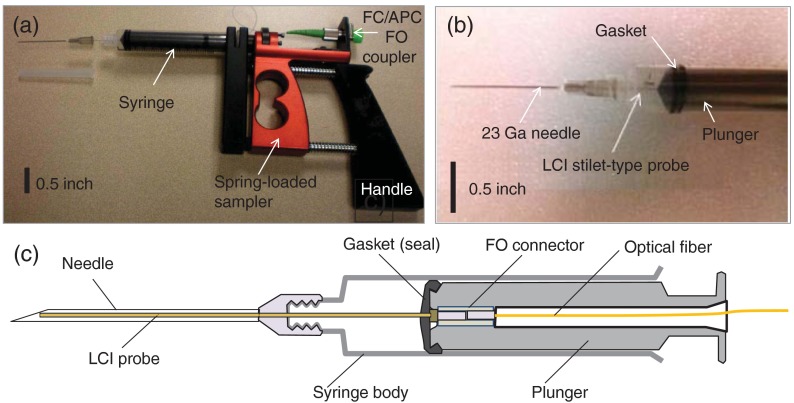
This instrument uses a specially designed biopsy gun (see Fig. 2) that has a dual functionality: tissue type investigation with LCI and biopsy specimen collection. This dual functionality aspect is extremely important because the specimen has to be collected from the exact same location as the LCI sampling.
Fig. 2.
(a) Biopsy gun; (b) syringe distal end showing the stilet attached to the plunger; (c) schematic of the modified syringe with the LCI probe passing through the bore of the biopsy needle.
The biopsy gun uses a regular 10 cc syringe with a modified plunger that allows for passing an optical fiber to a microconnector. A disposable stilet-type fiber probe is attached to the plunger distal end and sealed with the plunger gasket to maintain a negative pressure in the syringe body when the plunger is pulled to produce an aspirate. In this way, when pulling the plunger, the stilet is pulled as well, allowing for the biospecimen to be collected within the bore of the needle. The stilet consists of a outer diameter stainless steel hypodermic tube and a single mode fiber (SMF28) inside. The fiber is polished at 8 deg to minimize back-reflections. The stilet can be passed through a regular 23 Ga biopsy needle. The biopsy gun allows for placing the syringe plunger into a spring-loaded mechanism such that the operator has to compress the spring when collecting a specimen, and then just release the handle to express the specimen on a microscope slide.
2.2. Data Processing
A previously reported data processing algorithm18 has been further improved and used for this study. The main goal was to further improve tissue differentiation specificity. Briefly, the algorithm is based on the processing of the individual A-lines to extract tissue-type specific information. The acquired LCI data from a fixed position (1000 A-lines with 1024 depth pixels in each A-line, representing tissue reflectivity profile), with the DC component removed, are time averaged over 25 A-lines. Then a low-pass filter is applied to each averaged profile to get a linear fit and determine its slope. To extract the AC signal, the filtered signal is subtracted from the averaged profile. Changes in the slope can indicate the presence of one or more tissue types within the same A-line. Therefore, the A-line is divided into small windows (minimum 100 pixels each), and the local slopes are first calculated. If there is a change in the slope, the analysis of the AC signal is performed separately in each window. Otherwise, the processing is performed over the entire A-line. Examples of the low-pass filtered profiles and slope estimation are shown in Figs. 3(b), 3(e), and 3(h).
Fig. 3.
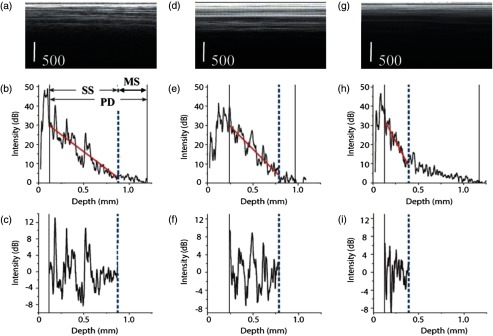
Illustration of the initial processing steps applied to three data sets corresponding to adipose (a), fibrous (d), and tumorous tissue (g) each frame has 100 A-lines. Corresponding depth profiles and linear fit are shown in (b), (e), and (h). The profile variation around the linear fit on the single scattering (SS) contribution is shown in (e). MS stands for the contribution of multiple scattering, while PD stands for the full penetration depth. The extracted AC components of the reflectivity profiles are shown in (c), (f), and (i).
Strong inherent backreflections from the stilet tip can cause significant changes in the intensity of the signal that often causes a deviation from the linear fits. To avoid such deviations, the first 25 depth points are averaged and used as a starting point for a linear fit. The total depth of a profile is determined as the distance from the initial point of fitting to the depth location corresponding to the 4% signal level of the initial point. The minimum length of fit was set as the smaller value between 20% of the profile depth and 100 pixels. Within the profile depth, the fitting is performed iteratively involving the calculation of (linear fit goodness) value. This iterative fitting is performed on the entire profile depth. The end point of the linear fit is varied to maximize the value. For all fits, it is assumed that no more than one tissue type is present in a single window. Again, the window here refers to a portion of the reflectivity profile that has a constant slope.
Six parameters are derived from this signal and used in our processing algorithm. The first parameter used in the tissue differentiation algorithm, standard deviation (Std), is obtained from subtracting the raw profile from the linear fit in the linear region and calculating its variance. Std varies from one tissue type to another as a function of the scattering properties. Std is high in adipose tissues due to the high scattering of the cell membrane and very low scattering from the cytoplasm. Std is moderate to high for muscle and fibrotic tissues or tissue stroma, depending on the exact nature of the tissue, and is relatively small for tumor tissues that are formed by densely packed cells with relatively similar size.
The MeanPeakDistance or the average distance between consecutive peaks within an A-line or depth scan is the second parameter. This parameter is indicative of the cellular boundaries, as well as of the nuclear/cytoplasmic ratio. In adipose tissues, it shows the approximate size of the fat cells, while on the muscle, stromal, and tumor tissues, it is indicative of the nuclear/cytoplasmic ratio.
Std PeakDistance is the third parameter used in the algorithm. It estimates the Std of the distance between the peaks. The adipose/fibroadipose, stromal, and even muscle tissues can be quite heterogeneous, and thus the value of the StdPeakDistance can be relatively high (over ) for these tissues. Tumor tissues are packaged with uniformly distributed cells; therefore, the StdPeakDistance is relatively small (tens of meters) for this tissue class.
The next two parameters, PeakNr and PeakArea, are derived by calculating the power spectrum of the signal. The power spectrum is first normalized to its maximum. Then the number of power spectrum peaks (PeakNr) is derived by counting the number of frequency peaks greater than or equal to a threshold value, experimentally set to 0.35. These peaks indicate the number of dominant frequencies. A heterogeneous tissue, such as fibroadipose, has a larger number of peaks than a more homogeneous tissue, such as tumor. These peaks correspond to significant variations of the cytoplasm/nuclei ratios. The total area of the peaks (PeakArea) identifies the spread of the dominant frequencies. A high spread of the dominant frequencies was found for adipose tissue where the cell size can vary, while the lowest spread was found for the tumor tissue which has densely packed cells with enlarged nuclei, and thus these frequencies have a relatively small spread.
The new parameter used in our algorithm measures the ratio of the single scattering (SS) depth to the total penetration depth (PD). Therefore, it is called the SS versus PD ratio. The single backscattering regime can be approximated with a linear fit of a depth profile, while the multiple scattering regime starts at a depth point where the linear fit ends.19 As is well known, besides the single scattered photons, also called ballistic photons, the multiple scattered (MS) photons can contribute to the LCI signal if they reach the detector within the coherence gate, which is a function of the bandwidth of the light source used. The amplitude of the MS wave does not decrease as rapidly with depth as that of the SS wave, and this translates into a less steep slope of the tail of the LCI signal than the slope of the SS portion. As observed from Fig. 3, SS is significantly shorter for tumor tissue than for the other two tissue types (adipose and muscle). Adipocytes do not scatter light significantly; scattering occurs mostly on the cell membrane. Therefore, ballistic photons from higher depths than those from tumor tissues at the same depth can reach the detector within the coherence gate. However, muscle fibers scatter light more intensively than adipocytes, therefore, the SS depth is slightly smaller than in the adipose case. Furthermore, tumor tissue is formed by densely packed cells with enlarged nuclei, and scatters light more intensively than the adipose and even muscle tissues to result in the shortest SS depth of the three tissue types.
Figure 4 summarizes the new set of six parameters and their statistical significance in tissue discrimination. It is noted that all of the parameters have statistical significance over at least one tissue type and only the SS/PD parameter is statistically significant among all tissue types.
Fig. 4.

Parameters from the training set. Statistically significant values are labeled for values (*); (**); and (***).
This set of six parameters (Std, PeakArea, PeakNr, MeanPeakDistance, StdPeakDistance, and SS versus PD ratio) is calculated for a training set of tissues with known pathologies. The training set is carefully selected based on a histology report to represent each tissue type to be evaluated in a validation set. First, mean values of each parameter are calculated for the three major tissue types: adipose (), muscle (), and tumorous (). Next, covariance matrices for all tissue types are computed via
| (1) |
where is the number of samples in each tissue type of the training set, and the superscript T indicates matrix transpose.20
For tissue classification, a quadratic discrimination score is calculated using the mean values and covariance matrices by
| (2) |
where is the matrix determinant, is the inverse matrix of and is the column vector with six parameters of an unknown tissue. It should be noted that the quadratic discrimination score is the logarithmic probability that a certain sample belongs to each tissue type. To determine the tissue type of an unknown sample, all scores are calculated and the tissue type that gives the maximum score to the particular sample is chosen as the result of the diagnosis.
2.3. Animal Model and Data Collection
A tumor xenograft animal model was used in this study. The xenograft models are widely used to investigate the main factors involved in malignant transformation, invasion, and metastasis, as well as to examine responses to therapy.21 In such models, human tumor cells are injected into immunocompromised mice that do not reject human cells. In our case, subcutaneous injection of approximately breast carcinoma human cells (MDA-MB-231) was performed in the mammary fat pad of mice without immune response. In a relatively short time after implantation, these cells start to proliferate in an uncontrolled manner. This process is known to be caused by the mutations in the genes responsible for regulating the growth of the cells. As a result, the cells gain the ability to keep dividing without control or order, producing more cells which invade nearby healthy tissue and make their way into the underarm lymph nodes.
In our study tumors started to develop 2 weeks after cell implantation. To avoid distress, tumor growth was evaluated daily by simple palpation of the injected area. After the tumors have grown to approximately 5 to , the animals were considered ready for the biopsy study. Out of the 70 animals used in our study, 58 developed tumors with a moderate growth rate, while four animals had to be sacrificed before starting the LCI study because of very rapid tumor growth and signs of discomfort. Eight animals did not develop any tumor over the course of our study.
One issue with this animal model is that the incidence of the fibrotic stroma around the tumor is infinitively smaller compared to humans, therefore, we could not precisely place the needle in the stromal tissue to build a library of benign stromal tissue. The closest tissue type, in terms of light absorption/scattering properties, was muscle. However, the algorithm trained on the muscle cannot be further applied to the stromal tissue. Whenever the algorithm is applied to differentiate specific tissue types, it needs proper training on matching tissue types.
The mice were prepared (sedated) for the biopsy by Ketamine/xylazine injection ( body weight). Following anesthesia, biopsy aspirates were collected from the tumor site. In most cases, the tumor was palpable. In cases where the tumor was not palpable, a portable ultrasound machine was used to locate the tumor. The optical biopsy needle was inserted into the presumed subcutaneous tumor site (3 to 5 mm from skin surface), fat pad, and muscle, and LCI measurements were collected over the course of about 10 s. Since the instrument was able to collect data with a speed of (1000 A-lines/frame), about 200 frames were collected from each measurement location. A tissue aspirate was then obtained from the LCI measurement site. The needle insertion site was marked with India ink for histology correlation. After completing the biopsy procedure, the animals were sacrificed (Pentobarbital i.p.).
The animals used for this study were divided in two groups: 30 for a training set study and 40 for a validation set study. The training set data were needed for building the covariance matrices with the six training set parameters, while the data collected from the validation set were used to test the algorithm capability for differentiating tissue types. Two biopsies for each tissue type (fat, fibromuscular, and tumor) were performed for the training set (180 biopsies in total). Multiple LCI data sets were recorded for each biopsy site. The animals from the training set were sacrificed after recording the LCI measurements and performing the biopsies. Histology and cytology results were used to classify tissue types and correctly assign the LCI measurements to each tissue type. The main reason for using combined histology/cytology analysis instead of cytology alone was that FNAB has limited sampling capabilities, and thus tumor can be missed. India ink markings of needle incision location were used as reference points for histology analysis.
For the validation set, at least three biopsies were performed in each animal. This number of biopsies was reasonable considering the fact that each biopsy was done under general anesthesia and did not take . The animals from the validation set were sacrificed as well after performing the LCI measurements and the biopsy aspirates. Histology was also performed to eliminate the doubt of nonconclusive cytology results (i.e., presence of necrotic or adipose cells only on the aspirates). However, since eight animals from the validation set did not develop visible tumors and four animals had to be sacrificed before starting the LCI study because of tumor burden and signs of discomfort, the validation set was reduced to 28 tumor bearing animals and eight animals without any tumor. Out of the 28 animals, about half had developed small to medium size tumors ( in diameter), and thus they were the most suitable candidates for excising sufficient fat pad tissue for histology. Therefore, for histology correlation, we used 28 tumor specimens in our study and 40 normal specimens (20 muscle and 20 adipose) from the 12 animals with small tumors and from the eight animals that were tumor free.
Cytological/histological analysis was performed by an experienced pathologist. The correlated histological/cytological findings were used as the gold standard to associate each tissue type to a specific class: adipose, fibrous, and tumor. The cytopathologist used a three-category diagnosis comprising present, few, and scant or none. When a tissue carried the diagnosis of present or few, it was diagnosed to be tumorous. When only necrotic or adipose cells were present on the biopsy location, the cytology results were categorized as “nondiagnostic.”
3. Results and Discussion
First, the LCI data collected from the training set of animals was used to build up the set of six parameters (Std, PeakArea, PeakNr, MeanPeakDistance, StdPeakDistance, and SS versus PD ratio) for each tissue type. Then, the decision algorithm was retrospectively applied to the training set of LCI data. Over 97% correlation between algorithm findings and histology was obtained, indicating algorithm suitability for the validation study. Figure 5 shows the representative LCI images and corresponding findings of the algorithm for the three tissue types: adipose [Figs. 5(a) and 5(a′)], fibrous [Figs. 5(b) and 5(b′)], and tumor [Figs. 5(c) and 5(c′)]. Figures 5(a′′)–5(c′′) show the representative histology appearance for these three tissue types. It is to be noted that only the cells from Fig. 5(c′′) exhibit dark staining, confirming their tumoral nature.
Fig. 5.
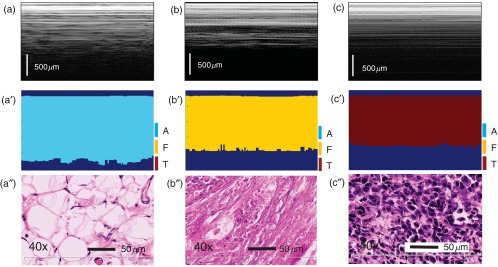
Representative results of automated algorithm findings within the training set. (a)–(c) LCI frames of adipose (a), fibrous (b), tumor, and (c) tissues. (a′)–(c′) Corresponding algorithm assignment of tissue type. (a″)–(c″) Associated histology ( magnification). H&E staining was used. The LCI frames were truncated in depth (512 pixels out of the 1024 are shown).
Then the algorithm was applied to the validation set of LCI data. Since the intended goal of this technology is to provide feedback to the clinician performing the biopsy to properly orient the needle and reach the viable tumor cells to produce an aspirate, we tested algorithm capability for distinguishing between viable tumor tissue, normal tissue (adipose, muscle, and combination of adipose and muscle), and nonviable tumor tissue (necrotic cells). Note that the aspiration of fat or necrotic cells does not provide any diagnostic value.
Histology findings were tested against algorithm findings. The sensitivity and specificity of the diagnostic results were calculated with
| (3) |
where TP is the true positive value that was correctly attributed as positive to cancer findings, FN is the false negative value that was falsely ascribed to tumor as nontumorous, TN is the true negative value that was properly assigned to the normal tissue, and FP is the false positive value that was falsely assigned as tumorous to normal tissues.
Finally, cytology findings were tested against histology and algorithm findings. The results of the correlations are summarized in Table 1. Sensitivity and specificity of 0.89 and 0.875 were found with only five FP cases. The PPV, as defined by the ratio of true positives to the total number of positive calls, was 0.96. While all of these results outperform the reported values in previously reported ex vivo as well as in vivo studies, the PPV was improved by the biggest margin when compared to the previous values of 0.73 and 0.78.21,22 It is to be noted that the cytology/histology correlation was 94.1%. Out of the 68 correlated specimens, cytology failed to provide a diagnostic result in only four cases, when only fluid was aspirated (no cells were found within the aspirate). However, this is not the usual outcome when measurements are taken in humans with tumors that have a high degree of heterogeneity. The false negatives and the nondiagnostic aspirates can be relatively high in these cases.3–7 Necrotic cells admixed with viable tumor cells were found as well in multiple aspirates.
Table 1.
The results of the automated algorithm.
| Automated algorithm results | ||||
|---|---|---|---|---|
| Cytology interpretation | Histology interpretation | Normal tissue (fibroadipose or fibrous) | Tumor or tumor admixed tissue | |
| Normal tissue | 40 (36 normal and 4 nondiagnostic-no cells found) | 40 | 35 (TN) | 5 (FP) |
| Tumor or tumor admixed tissue | 28 (tumor cells admixed with adipose muscle, or necrotic cells | 28 (clear tumor areas or infiltration of tumor cells within muscle or adipose tissue) | 3 (FN) | 25 (TP) |
| Total samples | 68 | 68 | Sensitivity: 0.89; Specificity: 0.875 | |
A representative case of algorithm findings is shown in Fig. 6. The LCI frames (1000 A-lines/frame) are displayed in the first row, while algorithm interpretation of LCI data is presented in the second row. Averaging over 25 A-lines was used to reduce the impact of motion and speckle artifacts. Lastly, cytology data are displayed in the third row. It is to be noticed that the algorithm/cytology correlation was still not 100% over the entire frame, especially for the fibrous and tumor tissue. This can be explained by the temporal variations in the LCI signal and limited specificity of the algorithm, which cannot correctly interpret every A-line.
Fig. 6.
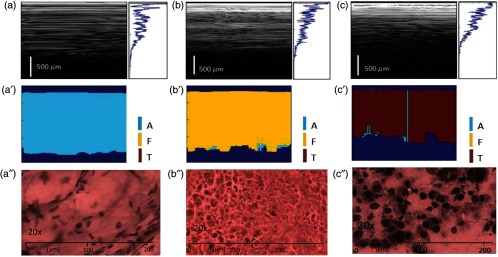
Representative results of automated algorithm from in vivo biopsy imaging. (a)–(c) LCI frames and frame averaged reflectivity profile of adipose (a), fibrous (b), tumor, and (c) tissues. (a′)–(c′) Corresponding algorithm assignment of tissue type. (a′′)–(c′′) Cytology results. The biopsied tissue cells were expressed (smeared) on a microscope glass slides and stained. Staining of the cell nuclei is observed only on (c′′), indicating their tumoral nature.
Although in most of the cases we observed one single tissue type within the LCI depth reflectivity profile, there were some cases where at least two tissue types were present. A representative case is shown in Fig. 7 where muscle and tumor tissue were present within the same depth reflectivity profile. The changes in the slope from the frame averaged reflectivity profile from Fig. 7(b) suggest the presence of at least two tissue types. Indeed, the algorithm has found muscle and tumor tissue within the same A-scan. Again, the percentage of each tissue-type is automatically calculated by the algorithm and the clinician can then decide if sufficient viable tumor is present to produce an aspirate that will provide a diagnostic value. Both histology and cytology confirm these findings [see Figs. 7(d)–7(f)]. Histology correlation was aided by marking with India ink the biopsy site (see dark areas in the histology slide).
Fig. 7.
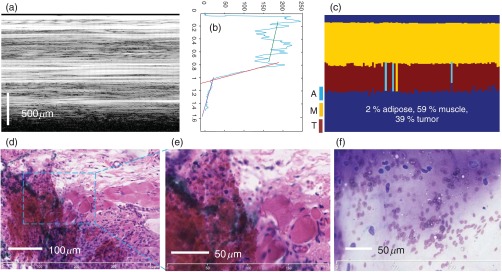
Representative case of admixed tissue. (a) LCI frame; (b) frame averaged reflectivity profile over 100 A-lines; (c) algorithm assignment of tissue type; (d, e) histology correlation (H&E staining); and (f) cytology results.
Algorithm capability for identifying necrotic areas of the tumors was tested as well. As discussed, the necrotic tissue does not provide any diagnostic value, therefore, an aspiration from the necrotic area has to be avoided. Several animals have developed larger tumors that became necrotic. The LCI probe was intentionally oriented toward the center of the tumor to reach the necrotic area and then toward tumor periphery. The locations of needle insertion as well as its insertion depth were carefully determined every time for LCI/histology correlation. The PD parameter was the weighting factor in the tissue differentiation algorithm to differentiate between viable and necrotic cancer. The threshold for depth penetration was determined experimentally. Less than a 20% PD ratio (PD relative to the length of the A-line) was determined as providing about a 90% correlation with the histology data (9 out of the 10 examined necrotic core tumors were correctly retrieved by the algorithm).
A representative case for necrotic core detection is shown in Fig. 8.
Fig. 8.
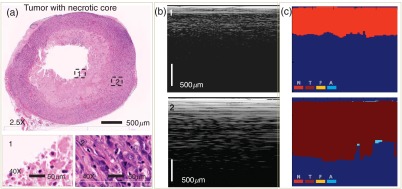
LCI differentiation between viable and necrotic cancer. (a) Histology; (b) LCI frames; (c) algorithm results: N, necrotic; T, tumor; F, fibrous; and A, adipose. The LCI frames were truncated in depth (512 pixels out of the 1024 are shown).
The two marked areas on the histology image were magnified to determine the tissue nature. During histology processing, the area near the center of the tumor did not preserve the blood and dead cancer cells suspended in the blood and tumor ulceration fluid. Therefore, the core of the tumor shows up in the histology as an empty area. LCI shows a clear difference in the PD between the necrotic core and viable tumor locations. This is explained by the high scattering of the blood cells from the necrotic core and the high absorption of the ulceration fluid.
To test the performance of the modified algorithm against the previously tested algorithm, we generated receiver operating characteristic (ROC) curves (see Fig. 9). An ROC curve graphically illustrates the performance of each binary classifier by plotting the true positive rate (TPR) against the false positive rate (FPR) as its discrimination threshold is varied.22 TPR is defined as sensitivity and FPR as (1-specificity). The discrimination threshold is defined as the amount of tumor diagnosis within a single LCI frame above which the automated algorithm determines the tissue type as tumor and it varied from 49% to 80%. The dotted diagonal line in Fig. 9 represents the random guesses and ROC curves; points above the line of random guesses are considered good classifiers, with the best ones near the (0, 1) coordinate that maximize the area under the curve (AUC). The points along the ROC curves are generated from all samples used in this study, including both tumorous and normal.
Fig. 9.
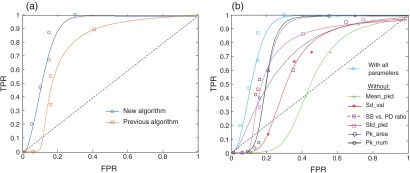
(a) Comparison of the receiver operating characteristics (ROCs) for the current and previous algorithm; (b) ROC curves for two types of classifiers: with all six parameters and with one parameter sequentially eliminated. TPR, true positive rate and FPR, false positive rate.
To illustrate the contribution of the SS versus PD radio parameter, we compared the ROC of the previous model with the ROC for the improved model [see Fig. 9(a)]. As seen in Fig. 9(a), the modified classifier used in this paper with the SS versus PD radio parameter showed an improved discrimination performance over previous classifiers without this parameter. It also helped to differentiate between the necrotic and viable tumors. The tumor diagnosis threshold value that resulted in the best sensitivity and specificity was computed to be 51% for the SS versus the PD radio parameter included classifier.
In addition, to test the contribution of each parameter, we also compared the ROC for all six parameters with the ROC for five parameters by sequentially eliminating one parameter at the time [see Fig. 9(b)]. As observed, the new added parameter plays an important role in tissue discrimination. Moreover, the deletion of three parameters deemed redundant or insignificant (slope, PeakFrequency, and StdFrequency) used in the previous work with OCT did not affect the classification performance; the AUC values with the original parameters was 0.73 while the five parameter algorithm without the SS versus PD ratio AUC was 0.72.
4. Discussion and Conclusion
In this paper, we have presented a portable preclinical LCI instrumentation featuring the second generation LCI-based biopsy probe and improved scoring algorithm for tissue differentiation. With the refinement of the algorithm including the addition of a new parameter related to the ratio between the SS depth and the total PD, we were able to enhance the differentiation of tissue types in vivo and reach a specificity of , sensitivity over 0.89, and PPV of 0.96. The respective 95% confidence intervals for specificity and sensitivity computed with the Wilson score interval23 were [0.53 0.98] and [0.72 0.97].
The instrumentation and tissue differentiation algorithm are not intended to replace the current biopsy, but rather to aid it by “telling” the biopsy physician if the tissue at the needle tip belongs to the desirable class (viable tumor) or not before performing an aspiration. In this way, the physician can move the needle tip around searching for the viable tumor tissue.
Our preliminary results suggest that the improved LCI instrumentation and algorithm for aiding FNABs have the potential for robust differentiation of tumor tissues from surrounding normal parenchymal tissues on the basis of adequate and well-documented training sets. However, since the LCI signatures for human fibrous breast parenchyma are quite different than those of the animal muscle, the training set for the animal study does not apply to the human study. A new training set has to be developed for the human tissue and algorithm validation has to be performed using this new training set. The actual version of the algorithm has only been tested on muscle, adipose, and tumor mouse tissue. A training set has to be established for each tissue class coming for a given organ before applying the algorithm. For example, breast and liver, or breast and kidneys have vastly different tissue types. Therefore, the algorithm has to be trained for each organ/tissue type, especially when there is a clear difference among the type and the sizes of the cells in various organs.
The current algorithm is not sensitive to tumor development stage, meaning that it cannot differentiate between rapidly growing tumors and slowly developing ones. The analysis is based on the changes within the LCI reflectivity profile, which reflects the micron scale changes within the refractive index of the tissue over the measured depth. It is also not sensitive to the tissue vascularization status. The presence of blood weakens LCI signal due to the highly scattering nature of blood cells, as well as due to the absorption in blood plasma. Based on this, additional metrics, such as Doppler presence in the LCI signal, can be added to account for the blood passage and thus for tissue vascularization status.
The advantage of the proposed LCI approach is that it is based on a nonscanning approach, enabling the use of relatively simple small probes that can be passed through the bore of fine needles of 23 and potentially 24 or 25 Ga, which are suitable for an aspiration biopsy. On the other hand OCT, which is the scanning variant of LCI, has clear superiority over LCI in imaging true tissue morphology. Due to access to the tissue morphology data, texture analysis can be performed to differentiate tissue types with very good sensitivity and specificity as shown by other investigators.24 OCT imaging through core needles (18 Ga), using fast scanning mechanisms, and probe protection that minimizes tissue disruption has been published before.25 Therefore, OCT imaging may also be considered for guiding biopsies. However, the probe would be more complex, imaging would require a longer acquisition time, and real-time data analysis would require the use of fast parallel processing approaches.
This technology may become suitable for clinical use if it will enable reliable real-time clinical feedback. The current processing time in MATLAB is . Due the parallel processing capabilities of GPU, this time can be easily reduced by a factor of 5 (to 0.1 s or less), providing a reasonable refresh rate () of the processed signal. Therefore, it is clear that further work is needed to optimize and improve the processing speed of the algorithm. Fortunately, advancements in the parallel processing with graphics processing units seem to enable real-time data processing and thus might allow for real-time tissue differentiation. Furthermore, the Doppler capability may be added to the data processing algorithm to account for changes in tissue vascularization, and thus to determine tumor development stages and aggressiveness. Fortunately, advancements in both technology and algorithm development might help to make this technology more effective and potentially translatable to the clinic.
Acknowledgments
Dr. Guillermo J. Tearney consults for NinePoint Medical. Massachusetts General Hospital has a licensing arrangement with NinePoint Medical. Dr. Tearney has the right to receive royalties from this licensing arrangement. He also consults for Samsung Advanced Institute of Technology.
Biographies
Nicusor Iftimia received his BS, MS, and PhD degrees in physical engineering from Bucharest University and his postdoctoral training in biomedical imaging from Harvard Medical School. He is a principal research scientist at Physical Sciences Inc. His current research interests include optical coherence tomography, confocal microscopy, near-infrared fluorescence imaging, and multimodal imaging, all applied to disease diagnosis and therapy guidance. He is a member of SPIE and a senior member of OSA. He is author/coauthor of more than 50 peer-reviewed publications, several book chapters, and the editor of a book.
Biographies of the other authors are not available.
References
- 1.“Estimated new cases and deaths from breast cancer in the United States in 2014,” http://www.cancer.gov/cancertopics/types/breast.
- 2.Farshid G., et al. , “Assessment of 1183 screen-detected, category 3B, circumscribed masses by cytology and core biopsy with long-term follow up data,” Br. J. Cancer 98(7), 1182–1190 (2008). 10.1038/sj.bjc.6604296 [DOI] [PMC free article] [PubMed] [Google Scholar]
- 3.Boerner S., Sneige N., “Specimen adequacy and false‐negative diagnosis rate in fine‐needle aspirates of palpable breast masses,” Cancer Cytopathol. 84(6), 344–348 (1998). 10.1002/(ISSN)1097-0142 [DOI] [PubMed] [Google Scholar]
- 4.Pisano E., et al. , “Fine-needle aspiration biopsy of nonpalpable breast lesions in a multicenter clinical trial: results from the radiologic diagnostic oncology group,” Radiology 219(3), 785–792 (2001). 10.1148/radiology.219.3.r01jn28785 [DOI] [PubMed] [Google Scholar]
- 5.Rubin M., et al. , “Use of fine needle aspiration for solid breast lesions is accurate and cost-effective,” Am. J. Surg. 174(6), 694–696 (1997). 10.1016/S0002-9610(97)00192-X [DOI] [PubMed] [Google Scholar]
- 6.Yen H., et al. , “Fine‐needle aspiration of a metaplastic breast carcinoma with extensive melanocytic differentiation: a case report,” Diagn. Cytopathol. 23(1), 46–50 (2000). 10.1002/(ISSN)1097-0339 [DOI] [PubMed] [Google Scholar]
- 7.Ljung B., et al. , “Diagnostic accuracy of fine‐needle aspiration biopsy is determined by physician training in sampling technique,” Cancer Cytopathol. 93(4), 263–268 (2001). 10.1002/cncr.v93:4 [DOI] [PubMed] [Google Scholar]
- 8.Grady I., et al. , “Ultrasound-guided, vacuum-assisted, percutaneous excision of breast lesions: an accurate technique in the diagnosis of atypical ductal hyperplasia,” J. Am. Coll. Surg. 201(1), 14–17 (2005). 10.1016/j.jamcollsurg.2005.02.025 [DOI] [PubMed] [Google Scholar]
- 9.Azavedo E., et al. , “Stereotactic fine-needle biopsy in 2594 mammographically detected non-palpable lesions,” Lancet 333(8646), 1033–1036 (1989). 10.1016/S0140-6736(89)92441-0 [DOI] [PubMed] [Google Scholar]
- 10.Criscitiello C., et al. , “Biopsy confirmation of metastatic sites in breast cancer patients: clinical impact and future perspectives,” Breast Cancer Res. 16, 205 (2014). 10.1186/bcr3630 [DOI] [PMC free article] [PubMed] [Google Scholar]
- 11.Sneige N., Tulbah A., “Accuracy of cytological diagnoses made from touch imprints of image-guided needle biopsy specimens of non palpable breast abnormalities,” Diagn. Cytopathol. 23, 29–34 (2000). 10.1002/(ISSN)1097-0339 [DOI] [PubMed] [Google Scholar]
- 12.Hsiung P., et al. , “Benign and malignant lesions in the human breast depicted with ultrahigh resolution and three-dimensional optical coherence tomography,” Radiology 244(3), 865–874 (2007). 10.1148/radiol.2443061536 [DOI] [PubMed] [Google Scholar]
- 13.Bydlon T., et al. , “Performance metrics of an optical spectral imaging system for intra-operative assessment of breast tumor margins,” Opt. Express 18(8), 8058 (2010). 10.1364/OE.18.008058 [DOI] [PMC free article] [PubMed] [Google Scholar]
- 14.Nguyen F., et al. , “Intraoperative evaluation of breast tumor margins with optical coherence tomography,” Cancer Res. 69(22), 8790–8796 (2009). 10.1158/0008-5472.CAN-08-4340 [DOI] [PMC free article] [PubMed] [Google Scholar]
- 15.Zysk A., et al. , “Clinical feasibility of microscopically-guided breast needle biopsy using a fiber-optic probe with computer-aided detection,” Technol. Cancer Res. Treat. 8(5), 315 (2009). 10.1177/153303460900800501 [DOI] [PMC free article] [PubMed] [Google Scholar]
- 16.Iftimia N. V., et al. , “Spectral-domain low coherence interferometry/optical coherence tomography system for fine needle breast biopsy guidance,” Rev. Sci. Instrum. 80(2), 024302 (2009). 10.1063/1.3076409 [DOI] [PMC free article] [PubMed] [Google Scholar]
- 17.Goldberg B. D., et al. , “Automated algorithm for differentiation of human breast tissue using low coherence interferometry for fine needle aspiration biopsy guidance,” J. Biomed. Opt. 13(1), 014014 (2008). 10.1117/1.2837433 [DOI] [PubMed] [Google Scholar]
- 18.Mujat M., et al. , “Automated algorithm for breast tissue differentiation in optical coherence tomography,” J. Biomed. Opt. 14(3), 034040 (2009). 10.1117/1.3156821 [DOI] [PMC free article] [PubMed] [Google Scholar]
- 19.Sharma U., et al. , “Long-wavelength optical coherence tomography at for enhanced imaging depth,” Opt. Express 16(24), 19712 (2008). 10.1364/OE.16.019712 [DOI] [PMC free article] [PubMed] [Google Scholar]
- 20.Johnson R. A., Wichern D. W., Applied Multivariate Statistical Analysis, Vol. 5, p. 767 Prentice Hall, Upper Saddle River, New Jersey: (2002). [Google Scholar]
- 21.Iorns E., et al. , “A new mouse model for the study of human breast cancer metastasis,” PLoS One 7(10), e47995 (2012). 10.1371/journal.pone.0047995 [DOI] [PMC free article] [PubMed] [Google Scholar]
- 22.Molodianovitch K., et al. , “Comparing the areas under two correlated ROC curves: parametric and non‐parametric approaches,” Biometric. J. 48(5), 745–757 (2006). 10.1002/(ISSN)1521-4036 [DOI] [PubMed] [Google Scholar]
- 23.Wilson E. B., “Probable inference, the law of succession, and statistical inference,” J. Am. Stat. Assoc. 22(158), 209–212 (1927). 10.1080/01621459.1927.10502953 [DOI] [Google Scholar]
- 24.Gossage K. W., et al. , “Texture analysis of optical coherence tomography images: feasibility for tissue classification,” J. Biomed. Opt. 8(3), 570–575 (2003). 10.1117/1.1577575 [DOI] [PubMed] [Google Scholar]
- 25.McLaughlin R. A., et al. , “Static and dynamic imaging of alveoli using optical coherence tomography needle probes,” J. Appl. Physiol. 113, 967–974 (2012). 10.1152/japplphysiol.00051.2012 [DOI] [PubMed] [Google Scholar]


