

Abstract
To date, prediction of Alzheimer's disease (AD) is mainly based on clinical criteria because no well-established biochemical biomarkers for routine clinical diagnosis of AD currently exist. We developed an approach to aid in the early diagnosis of AD by using principal component analysis (PCA)-based spectral analysis of oxidized protein electrophoretic profiling. We found that the combination of capillary electrophoresis and PCA analysis of S-glutathionylation distribution characterization can be used in the sample classification and molecular weight (Mw) prediction. The comparison of leave-one-out AD versus non-AD gives the sensitivity of 100% and 93.33% in brain tissues and blood samples, respectively, while the specificity of 100% in brain and 90.0% in blood samples. Our findings demonstrate that PCA of S-glutathionylation electrophoretic profiling detects AD pathology features, and that the molecular weight based electrophoretic profiling of blood and brain S-glutathionylated proteins are sensitive to change, even at the early stage of the disease. Our results offer a previously unexplored diagnostic approach by using electrophoretic characteristics of oxidized proteins to serve as a predictor of AD progression and early stage screening.
Keywords: Alzheimer's disease prediction, capillary gel electrophoresis with laser induced fluorescence detection (CGE-LIF), principle component analysis (PCA), S-glutathionylated proteins (Pr-SSG)
INTRODUCTION
Alzheimer's disease (AD) often has a long stage of neuropathological changes and cognitive decline starting at a molecular level, possibly decades earlier than the decline is detected by current neuropsychological testing [1]. Currently, AD cannot be diagnosed clinically before the disease has progressed far enough with the presence of dementia. S-glutathionylation (Pr-SSG) is a specific post-translational modification of cysteine residues by the addition of glutathione. S-glutathionylated proteins induced by oxidative or nitrosative stress plays an essential role in understanding the pathogenesis of the aging and AD. Studies have supported a fundamental role for S-glutathionylation in oxidative stress implicated pathophysiological processes [2]. In severely affected regions of the AD brain, protein S-glutathionylation formation is increased [3]. In our previous study, it was suggested that the protein S-glutathionylation may occur as an early event prior to AD progression [4].
To date, prediction of AD is mainly based on clinical criteria. There are no well-established biochemical biomarkers for routine clinical diagnosis of AD. Researchers have demonstrated the potential for new biomarkers in staging of AD using a variety of modalities including imaging and biochemical analyses for brain or blood or cerebrospinal fluid samples. A lot of studies focused on imaging techniques for diagnosis of AD. Several groups measured specific brain atrophy pattern in AD using automated deformation-based analysis of magnetic resonance imaging (MRI) scans [5, 6], while others found that the changes in cortical thickness were good predictors of diagnosis from normal to mild cognitive impairment (MCI) and AD [7]. These findings show the regional brain volume/thickness change parallels AD pathogenesis. However, MRI analyses are fairly complex and automated MRI is highly sophisticated [6]. Other studies examined molecular based biomarkers association of amyloid, such as tau and amyloid-β protein (Aβ42) [8], pro-neuro inflammatory cytokines [9]. Unfortunately, the sensitivity, specificity, and validity of these biomarkers are not desirable to date [10].
Thus, new diagnostic tools to aid in the early diagnosis of AD are very important. To have a better understanding of AD progression, the AD-transgenic (Tg) mice [B6.Cg-Tg (AβPPswe, PSEN1dE9) 85Dbo/J, stock no. 005864] and the age-matched wild-type (WT) controls [C57BL/6J background strain] at 1-, 5-, and 11-month-olds were analyzed. The goal of this project is to characterize the complex S-glutathionyl profiles of proteins associated with the age and genotype (AD-Tg/WT), and address the most critical issue—use of biomarkers to predict who will develop AD. In this study, we propose a combined capillary gel electrophoresis with laser induced fluorescence detection (CGE-LIF) and principal component analysis (PCA) analysis of brain and blood S-glutathionylation electrophoretic characteristics to assess a potential diagnostic tool of AD.
PCA is a common technique that is widely used for dimension reduction, feature extraction, and data visualization [11]. It can select out the principal components responsible for most variation in a population [12]. It has been widely applied to functional imaging of AD patients to determine the specific clinical brain impairment [5, 6]. Also, it has been used to extract patterns in electropherographical data that are diffi-cult to analyze by other means [13–15]. For example, PCA-based spectral analysis successfully revealed the age-dependent and muscle-type-related difference in protein carbonyl profiles of muscle mitochondria [15].
PCA analysis facilitates CGE-LIF to detect age- and genotype-dependent differences in protein S-glutathionyl profiles from the brain and blood samples in an AD mouse model. So, we evaluated the combination of S-glutathionylation distribution characterization and PCA analysis with predictive values for AD neuropathology greater than 100% and 93.3% in brain and blood samples, respectively. Therefore, it has an important role to differentiate the S-glutathionyls of B6.Cg mice from the age-matched controls and serves as a screening tool even in the 1-month-old. This electrophoretic distribution of oxidative damage biomarkers in blood samples and brain tissues, even with unknown identity, may become a useful addition to the AD predicting profile. Compared with imaging techniques, our study is simpler, less costly, and has great potential for clinical use for the blood test at the early stage for AD diagnosis.
METHODS
Materials and reagents
Sodium dodecyl sulfate (SDS), 2-[4-(2-hydroxyethyl)piperazin-1-yl] ethanesulfonic acid (HEPES), ethylenediaminetetraacetic acid (EDTA), methanol, sodium hydroxide, hydrochloric acid, neocuproine, dextran from Leuconostoc mesenteroides (average molecular weight (Mw) 64–76 kDa), trypsin inhibitor (20 kDa), glyceraldehyde-3-phosphate dehydrogenase (GAPDH, 36 kDa), albumin from chicken egg white (44 kDa), bovine serum albumin (BSA, 66 kDa), bovine gamma globulin (BGG, 140 kDa), and trichloroacetic acid (TCA) were all from Sigma. Amicon ultra-4 (Mw cutoff of 3 kDa) spin columns were purchased from Millipore. Recombinant Grx-3 (C14S, C65Y) from Escherichia coli was obtained from IMCO. Glutathione reductase was from Roche. Nicotinamide adenine dinucleotide phosphate (NADPH), reduced glutathione (GSH), and glutathione disulfide (GSSG) were all from Calbiochem. Diamide was from Research Organics Inc. 5, 5′ -Dithiobis (2-nitrobenzoic acid) was from Biodynth. DL-dithiothreitol was from Fluka. Iodoacetic acid and Triton X-100 were obtained from Alfa Aesar. Ultra Trol dynamic pre-coat LN was from Target Discovery. N-Ethylmaleimide (NEM), Dylight 488 maleimide, dimethyl sulfoxide, immobilized tris-2-carboxyethyl phosphate disulfide reducing gel, bicinchonic acid (BCA) protein assay kit were all purchased from Thermo Scientific.
Transgenic mice and genotyping using melting curves
Double hemizygous AD-Tg mice with over expression of mutated forms of AβPPswe, PSEN1dE9 (B6.Cg-Tg, stock no. 005864, Jackson Laboratory) and age-matched wild type (WT) littermates [C57BL/6J background strain] were used for all experiments. B6.Cg-Tg begins to develop amyloid plaques at 6–7 months of age [16–19]. This Tg mouse has proven to be a valuable model system to study the pathological alterations in AD [20–24], because these Tg mice display many features known to occur in the early AD pathogenesis such as increased oxidative stress, Aβ alterations, and loss of bioenergetic function.
In order to understand the early and progressive glutathione changes in AD development and progression, the transgenic mice were divided into three groups based on their disease progression stages: long before (1-month, n = 5), immediately before (5-months, n = 5), and after (11-months, n = 5), the appearance of amyloid pathology and cognitive impairment [25]. Age-matched WT mice were used as controls. A total of 30 mice (5 pairs Tg and WT at the three stages) were used in this study. All procedures for handling of mice were approved by the Institutional Animal Care and Use Committee at Louisiana Tech University. Since young adult mice at 11-month-old are commercially unavailable to be purchased, we bred and performed genotyping studies for each animal.
Real time quantitative polymerase chain reaction (qPCR) and high resolution melting curve analysis were used for genotyping the AD-Tg mice. The primer sets for the AβPP transgenic gene were: forward 5′-GAC TGA CCA CTC GAC CAG GTT CTG-3′ and reverse 5′ -CTT GTA AGT TGG ATT CTC ATA TCC G-3′). Primer sets for the PSEN1 mutant gene were: forward 5′ -AAT AGA GAA CGG CAG GAG CA-3′ and reverse 5′ -GCC ATG AGG GCA CTA ATC AT-3′ [26]. Briefly, mouse tail snips were obtained and DNA was extracted in 25 mM NaOH/0.2 mM EDTA at 98°C for 1 h. The sequence of AβPP gene was amplified by qPCR and then analyzed by melting curve analysis with a thermal cycler coupled with a fluorometer (LC 32 Scanner, Idaho Technology).
Total homogenate prepared from brain tissues and blood samples
The mice were anesthetized by intraperitoneal injection of sodium pentobarbital (60 mg/kg) and the animals were perfused transcardially with ice-cold saline. Blood samples and brain tissues were isolated from five pairs of AD-Tg/WT mice at each stage. Brain tissues were homogenized in ice-old 0.1 M phosphate buffer and precipitated in 5% TCA at 4°C for 15 min, followed by centrifugation at 10,000 × g for 10 min. The protein pellets were retained for next derivatization and labeling of Pr-SSG and consecutive analysis using CGE-LIF. Each blood sample followed the same procedures except homogenization step [27]. The total protein concentration was measured using BCA kit according to manufacturer's protocol. The absorbance of the protein samples at 562 nm was determined by NanoDrop 2000/2000c Spectrophotometer (Thermo Scientific).
S-glutathionylated protein derivatization and labeling
To be able to have a better understanding of formation of Pr-SSG during AD development, the Pr-SSG level in brain tissue and blood samples at the 3 age stages (1-, 5-, and 11-months) of AD-Tg/WT mice determination was performed using our previous described CGE-LIF [4].
The glutaredoxin-catalyzed cysteine derivatization has been described previously [28, 29]. Briefly, for alkylation of free thiol groups, 50 μl protein sample of each preparation was incubated in 40 mM NEM and 25 mM HEPES, 0.2 mM EDTA, 0.01 mM neocuproine, and 2.5% SDS at pH 7.7 for 30 min at 4°C [28]. The excess NEM was removed by extensive wash (5 times) with spin columns. The washing solvent was PBS at pH 7.4 and each wash involved centrifugation at 4000 × g for 20 min. For deglutathionylation, the blocked Pr-SSG sample was subsequently incubated with 2.5 μg/ml Grx-3, 4 U/ml GSSG reductase, 1 mM GSH, 1 mM NADPH for 60 min at 37°C [29]. The excess GSH and NADPH were removed by using spin columns again. Last, for the labeling of newly generated free thiols from S-glutathionyl group, 2 μl of 12.5 mM Dylight 488 maleimide was used and vortex mixed overnight. The excess dye was later removed by spin columns, and a final volume of 100 μl protein sample was obtained. These derivatized samples were then separated using a previously introduced size-based CGE and LIF detection method for characterizing the S-glutathionylation electrophoretic profiles [4].
CE calibration and Mw determination
To characterize the detection response of LIF and further construct a calibration curve for S-glutathionyl quantification, in vitro BSA-SSG was firstly generated by subjecting 5 mg/ml BSA to 2.5 mM diamide at 37°C for 30 min [28, 30]. The S-glutathionyl contents were then indirectly determined using a sulfhydryls quantitation reagent, DTNP Ellman's reagent [31, 32]. The concentration of S-glutathionyls in BSA-SSG (nmol glutathiols/mg of BSA) was quantified and spectrometrically determined at 412 nm [2]. For calibration, a series of five concentrations (1-, 1.3-, 2-, 4-, and 10-fold dilution) of in vitro BSA-SSG ranging from 92.0 to 9.2 nmol S-glutathionyl/mg protein were firstly derivatized and labeled, then followed with CGE-LIF measurement.
Five protein standards, including trypsin inhibitor, GAPDH, albumin from chicken egg white, BSA, BGG with different molecular mass ranging from 20 to 140 kDa, were measured using CGE-LIF. To transform the migration time into protein Mw, the standard curve between the logarithm of protein size and electrophoretic mobility were calculated. The relationship is shown in supplementary Figure 1 (available online: http://www.j-alz.com/issues/30/vol30-4.html#supplementarydata06).
Capillary electrophoresis
After specific labeling of S-glutathionyls, each of the samples was analyzed by CGE-LIF (Beckman Coulter P/ACE MDQ system) for obtaining a size-based electrophoretic profile of protein S-glutathionylation [4]. For excitation, the LIF detector used an argon-ion laser (488 nm line, 3 mW) that was directed to a detector window in the capillary using a fiber optic [15]. A 520DF20 bandpass filter (~510–530 nm) was used to select the Dylight 488 fluorescence before the photo-multiplier tube where the output signals were sampled at 4 Hz. The total capillary length and the length to the detection window were 30.8 cm and 12 cm, respectively, with a separation performed at −570 V/cm. The electroosmotic flow was reduced by pre-coating inner capillary wall with UltraTrol LN, a class of linear polyacrylamide made of N-substituted acrylamide copolymers [15]. The sample was injected hydrodynamically at 11 kPa for 4 s into the capillary containing the sieving matrix buffer, which consisted of 15% dextran (64–76 kDa), 0.5% SDS, 20 mM Tris and 20 mM Tricine.
Electropherogram-based Pr-SSG quantification
Igor Pro software (Wavemetrics) has been utilized to analyze data and electrophorograms, including migration time and peak area for each individual sample. To generate a calibration curve of S-glutathionyls, in vitro BSA-SSG was used for plotting S-glutathionyl amounts with respect to fluorescence peak area. Therefore, amounts of Pr-SSG from brain tissue and whole blood of AD-Tg/WT mice were calculated based on this curve.
Statistical analysis between groups was done by oneway ANOVA. A value of p < 0.05 was accepted as significant. All values are expressed as mean ± S.D.; n = 5 for each group. Specifically, one-way ANOVA was used to compare the age and genotype effect in AD-Tg/WT mouse brain and blood sample at the 3 age groups.
Principal component analysis
PCA was then applied to the Pr-SSG profiling spectrum data to extract the reduced feature set. The Mw of the Pr-SSG were predicted after PCA. Based on the distribution of the electropherographical data projected onto the PCs, K-means clustering technique [33] and probability for Gaussian distribution [34, 35] were applied to classify the age and genotype of the samples from the complex S-glutathionyl profiles. A block diagram summary of the overall procedure is illustrated in Fig. 1.
Fig. 1.
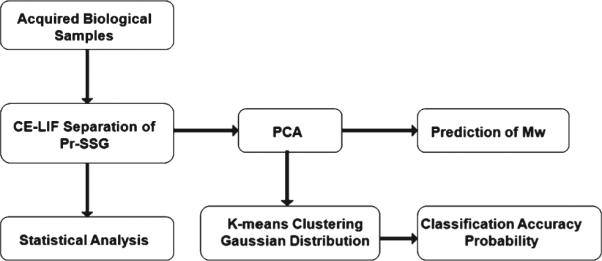
A schematic block diagram describing overall experimental procedure.
The Statistical Pattern Recognition Toolbox (STPRtool) in Matlab was used in this study [34]. The electrophoretic data was transformed into a set of uncorrelated PCs. These PCs were ranked according to each of their contributions based on the data variance; data complexity was then reduced by eliminating redundant, orthogonal, and independent PCs. The electropherogram data from six groups (consisting of different genotype and age) contain many features that are difficult to directly visualize and capture. To classify the data samples into one of the six groups based on their electropherogram profiles, PCA was used to project the data onto PCs with large data variances. The variance in each component is easily calculated by corresponded eigenvalues divided by total eigenvalues. PCA score was used to inform us the cumulative variance of the data. Up to 85.2% of the total variance within the data can be accounted for using three PCs (see supplemental Table 1 for details). Every electropherogram has 3600 data points which are migration time points with their corresponding fluorescence intensity values and each data point was treated as an independent variable. A PC was considered significant when the contribution to the total variances was >1%. Each sample was analyzed in triplicate and averaged to have the result in a single average electropherogram for each sample. If the Mahalanobis distance of samples from center of the score plot were greater than the threshold then tagged as outliers and were eliminated from the data set.
K-means clustering algorithm
K-means clustering algorithm [33, 34] was used to partition the data set into some number of clusters based on the genotype and age. A 5-fold cross-validation procedure [36] was used to evaluate different classification tasks. Eighty percent (80%) of the data for each study was randomly chosen to be the training set. The mean value of the training data set belonging to the same group was computed in the three dimensional PC feature space. The remaining 20% of the data was assigned to be the testing set. Each data point in the testing set was assigned to the nearest known cluster. The classification accuracy was defined to be the percentage of correctly identified testing data point. The data randomization, clustering, and testing procedure were repeated five times. Overall, twelve classifiers were created (six using blood, and six using brain Pr-SSG data), as outlined: (a) 3 – Genotype classifiers, one at the each age (1-month WT versus Tg; 5-month WT versus Tg; 11-month WT versus Tg). (b) 2 – Age classifier, one for each genotype (WT: 1-month versus 5-month versus 11-month; Tg: 1-month versus 5-month versus 11-month). (c) 1 – Combination genotype and age classifier (1-month WT versus 1-month Tg versus 5-month WT versus 5-month TG versus 11-month WT versus 11-month Tg).
Probability for Gaussian distribution
A Leave-One-Out cross-validation method [37] was used to test the probability of membership of each data point to each genotype and age. A multivariate Gaussian probability density function was used,
| (1) |
where x indicates each data point vector, μ represents the mean vector, and Σ is the covariance matrix (a positive-definite and symmetric matrix). The output vector is the probability density function between Gaussians. The probability of membership for each point x was obtained by adding the six probabilities (from the six groups) and normalizing it to give a sum of 1. The probability of membership represents the probability that the data point belongs to one of the Gaussians [34, 35]. The whole procedure was repeated for brain tissues and blood samples.
RESULTS
S-glutathionyl abundance in protein profiles
We previously developed an ultrasensitive CGELIF method for the detection and quantification of S-glutahionyl, reaching the lowest limit of Pr-SSG detection at 1.8 attomole level, reported to date [4]. Here, we used this analytical method to quantify S-glutathionyl abundance in brain and blood preparations obtained from 5 pair of AD-Tg/WT mice at the three age stages (10 animals/age group, total of 30 animals).
The S-gluathionylation level from in vitro oxidized model - BSA subjected to diamide exposure was quantified as 92 nmol S-glutathionyl/mg protein using Ellman spectrophotometric assay. Five different concentrations (1-, 1.3-, 2-, 4-, and 10-fold dilution) of this in vitro S-glutathionylated BSA was firstly derivatized and labeled, then followed with electrophoretic separation using CGE-LIF. After S-glutathionylation derivatization and labeling, a final concentration of in vitro S-glutathionylated BSA ranging from 5.2 μM to 52 μM was obtained. Accounting for the fact that only 1.1 nL volumes of samples were hydrodynamically injected for the capillary electrophoresis analysis, a calibration curve for S-glutathionyls ranging from 5.6 fmol to 56 fmol (10−15 moles) was generated. Here, x and y indicates the amount (moles) and the peak area of S-glutathionyls, respectively. The slope and intercept from the calibration curve provide a tight linear relationship between peak area and the amount of S-glutathionyls.
| (2) |
After calibration, each biological sample was analyzed in triplicate. The representative electro-pherograms of S-glutathionylated proteins profiling in Tg/WT mouse brain and blood at various disease progression were revealed (see Fig. 2 a–d). Based on the Equation (2) and the measured peak area for the S-glutathionylated peaks, the total S-glutathionyl content (in fmol) for each injected protein sample preparation (in ng) was calculated. Statistical analysis was done by one-way ANOVA. The results in Fig. 2e and f suggest that S-glutathionyl levels of Tg mice brains increased with aging (p < 0.001) except at the 5-month-old, and Pr-SSG levels at 1-, 5-, and 11-month-olds were 43.0 ± 7.2, 36.6 ± 7.0, and 129.8 ± 14.2 nmol/mg protein, respectively. No significant change with aging was observed in the WT mouse brain. For the genotype effect, there is a significant increase in S-glutathionylation abundance in Tg brain tissues compared with controls’ at the 1-month (p < 0.05) and 11-month-olds (p < 0.001). For blood samples, Pr-SSG contents increased with aging for both control and Tg mice (p < 0.001). Specifically at three AD staging, the Pr-SSG levels were measured as 10.6 ± 1.0, 18.0 ± 1.3, and 32.1 ± 4.1 nmol/mg protein, respectively, whereas Tg counterparts had Pr-SSG levels of 10.7 ± 2.5, 33.3 ± 7.1, and 46.9 ± 11.4 nmol/mg protine, respectively. In terms of the genotype effect, blood Pr-SSG abundance in Tg mice at 5-month (p < 0.01) and 11-month-olds (p < 0.5) was significantly higher than their age-matched control mice. These results are in agreement with the results of previous studies [4]. All Pr-SSG values are expressed as mean ± standard deviation (S.D.).
Fig. 2.

Electropherograms of S-glutathionylated proteins of Tg (a)/WT (b) mouse brain and Tg (c)/WT (d) blood at 1-, 5-, and 11-months. Hydrodynamic injection at pH 8 and 11 kpa for 4 s; separation in gel containing 15% dextran (65.5 kDa), 0.5% SDS, 20 mM Tris and 20 mM Tricine at −570 V/cm. Yellow arrows point out Pr-SSG peaks at the 3 age stages. The unlabeled peaks belong to Dylight 488 maleimide. Top trace is offset in the y-axis for the clarity. Pr-SSG levels in AD-Tg/WT brain (e) and blood (f) samples at the 3 age groups. Data are expressed as nmol/mg protein and presented as mean ± S.D. (n = 5/group). Age effect: 1-month versus 5-months versus 11-months. +++p < 0.001. Genotype effect: Tg versus WT. *p < 0.05, **p < 0.01, ***p < 0.001.
Principal component analysis
Due to the nature of CE separation, this chromatographic method also produces a protein Mw based profile of S-glutathionylated proteins. These complex data matrices are desirable for powerful multivari ate analysis. The primary research objectives are to assess whether reactive oxygen species-induced protein oxidative stress such as S-glutathionylated proteins distribution as a function of Mw (1) differs between AD and control subjects; and (2) exhibits different features at different stages of AD progression. We evaluated the utility of the combination of S-glutathionyls profiling and PCA analysis for AD diagnosis. Particular attention was paid to the number of PCs, as they are viewed as a critical factor to determine the outcome of the PCA model. As seen in supplementary Table 1, the first three PCs from brain tissues and blood samples, account for up to 85.2% and 82.4% of the total variance in six age/genotype groups, respectively. Figure 3 shows that the brain and blood in the six age/genotype groups were distinguished by principal component scores. Since it can sometimes be difficult to appreciate the degree to which these individual groups are separated in a three-dimensional plot, we have also prepared a two-dimensional score plot for each genotype-WT and Tg shown in supplementary Figure 1.
Fig. 3.

The score plots of PCA analysis for the brain (a) and blood (b) S-glutathionylated protein electropherograms.
Prediction of Mw
PCA can be utilized to evaluate the “importance” of variables, such as protein Mw values converted from the migration times (see supplementary Figure 2 for details) by examining the loading vectors of PCs. The contribution of protein Mw to this PCA model was evaluated by inspecting the loading vector of the first PC shown in Fig. 4. The first PC accounts for 53.22% of the total variance in supplementary Table 1. The contribution of any given Mw value to the total variance was determined by the loading vector value: the higher loading vector value indicates the bigger contribution of the corresponding Mw. Arbitrary, 50% of the loading vector maximum (0.03/dashed line in Fig. 3) was set as the threshold to inspect which regions were considered as the most contributors to this model variance. The main Mw regions in mice brains were found at 1.4 kDa and 8.4 ~ 20.3 kDa. For blood samples, the Mw ranges were located at 8.3 kDa and 13.2~37.2 kDa. The first region is associated with small, non-protein fluorescent species present in the sample. The second region predicts the Mw range where the most age-related and genotype-related S-glutathionylations occur.
Fig. 4.
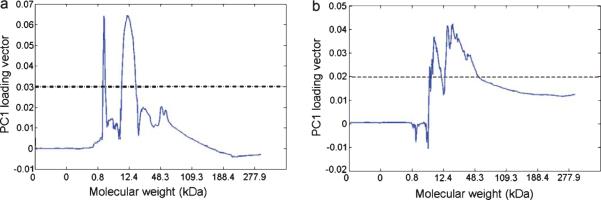
Loading vector of the first principle component (PC) of mouse PCA model in brain (a) and blood (b). The loading vector represents how variables (i.e., Dylight 488 maleimide fluorescence values corresponding to proteins in 3600 migration time points) contribute to the variance explained by the first PC. The variables with the most contribution found above the threshold (dashed line).
Sample categorization
Classification of each sample data into one of six groups based on its electropherogram profile feature was achieved using a K-means clustering method. The boxplots of classification accuracy based on a 5-fold cross-validation method are shown in Fig. 5. The binary classifiers for the discrimination of geno-type at the three age groups are shown in Fig. 5a and 5b. The accuracies of distinguishing the WT versus Tg genotype at the three age stages of brain/blood samples were found to range from 70.00% to 100.00%, with sufficient discrimination power. Regardless of the data sample type, at 5-month, the classification accuracy was always the lowest with half the data samples testing no better than chance classification. At 1-month and 11-month-olds, most data can be correctly classi fied to be either WT or Tg genotype. Next, the age of the Tg and WT mice can be distinguished better than chance as seen in Fig. 5c, with accuracies ranging from 93–100% and 66.67–73.34% for brain tissues and blood samples respectively. Fig. 5d shows the combined age/genotype classification results. An overall classification accuracy of 70.02% can be achieved using brains and 60.00% using blood samples. So the disease progression stage contributed significantly to group separation for both AD and controls, while genotyping contributed very pronouncedly to group separation at 1- and 11-month-olds, except at 5-month old, right before the amyloid deposition.
Fig. 5.

Boxplots for 5-fold cross-validation classification accuracy data for age/genotype groups of brain and blood S-glutathionylated protein. (a) and (b) show the binary classification accuracies for the discrimination of genotype in the three age groups. (c) shows the three-class age discrimination in Tg and WT mice using blood and brain samples. (d) shows the overall six-group classification of both age & genotype. In each of these subplots, the horizontal dotted line represents the accuracy of a chance (random) classifier. The mean classification accuracy for each group is also shown on the top of the each bar chart.
A leave-one-out validation method was also applied to test the classification accuracy for the age and geno-type. To classify samples into one of six groups based on their S-glutathionylation profiles, six disjoint PCA models were used for pattern recognition and sample classification. The normalized Gaussian distribution probabilities of membership using S-glutathionylated protein electrophoretic profiling data of both brain tissues and blood samples were computed. Table 1 showed the final results using brain data, with 28 correct assignments out of 30 samples (>95% confidence). The difference between AD and control at three disease progression stages in the brain can be separated out and further the correct classification was obtained. Using the blood data from Table 2, however, only 13 out of 30 samples were assigned correctly with >95% confidence. Despite the seemingly low accuracy level using blood samples, this result is still more than twice as high as the random classifier. It is probably more appropriate in single-trial classifica tion applications where a new brain or blood sample is compared with the Gaussian clusters obtained from an existing data base of existing AD versus non-AD samples.
Table 1.
Probabilty of membership in the six age/geno-type groups-brain
| Sample | 1-month Tg | 1-month WT | 5-month Tg | 5-month WT | 11-month Tg | 11-month WT |
|---|---|---|---|---|---|---|
| 1-mo. Tg1 | 1.00 | 3.15E-13 | 1.56E-21 | 0 | 0 | 2.34E-28 |
| 1-mo. Tg2 | 0.93 | 4.74E-08 | 0 | 0 | 0.07 | 0 |
| 1-mo. Tg3 | 1.00 | 6.69E-04 | 0 | 0 | 9.61E-05 | 0 |
| 1-mo. Tg4 | 0.95 | 6.26E-16 | 0 | 0 | 0.05 | 0 |
| 1-mo. Tg5 | 1.00 | 0 | 9.57E-16 | 0 | 0 | 0 |
| 1-mo. WT1 | 4.21E-14 | 1.00 | 0 | 0 | 1.87E-03 | 0 |
| 1-mo. WT2 | 0 | 1.00 | 0 | 0 | 1.52E-23 | 0 |
| 1-mo. WT3 | 1.03E-16 | 1.00 | 0 | 0 | 1.85E-04 | 0 |
| 1-mo. WT4 | 0 | 1.00 | 3.50E-18 | 0 | 2.92E-12 | 2.36E-15 |
| 1-mo. WT5 | 7.49E-07 | 1.00 | 0 | 0 | 4.58E-04 | 1.07E-20 |
| 5-mo. Tg1 | 3.96E-03 | 0 | 0.37 | 0 | 0 | 0.63 |
| 5-mo. Tg2 | 0 | 1.36E-13 | 0.96 | 8.54E-14 | 0 | 0.04 |
| 5-mo. Tg3 | 0 | 0 | 1.00 | 2.55E-12 | 0 | 0 |
| 5-mo. Tg4 | 0 | 2.66E-21 | 1.00 | 4.72E-09 | 0 | 2.86E-12 |
| 5-mo. Tg5 | 0 | 0 | 0.95 | 0.05 | 0 | 0 |
| 5-mo. WT1 | 0 | 0 | 0.02 | 0.98 | 0 | 0 |
| 5-mo. WT2 | 0 | 0 | 3.95E-15 | 1.00 | 0 | 3.93E-16 |
| 5-mo. WT3 | 0 | 0 | 3.51E-06 | 1.00 | 0 | 0 |
| 5-mo. WT4 | 0 | 0 | 9.18E-15 | 1.00 | 0 | 0 |
| 5-mo. WT5 | 0 | 0 | 4.78E-12 | 1.00 | 0 | 0 |
| 11-mo. Tg1 | 0 | 1.05E-12 | 0 | 0 | 1.00 | 0 |
| 11-mo. Tg2 | 6.67E-20 | 0 | 0 | 0 | 1.00 | 0 |
| 11-mo. Tg3 | 0 | 0 | 0 | 0 | 1.00 | 0 |
| 11-mo. Tg4 | 0.04 | 0 | 0 | 0 | 0.96 | 0 |
| 11-mo. Tg5 | 0 | 0 | 0 | 0 | 1.00 | 0 |
| 11-mo. WT1 | 0 | 1.47E-03 | 5.07E-12 | 0 | 0 | 1.00 |
| 11-mo. WT2 | 7.17E-25 | 6.08E-05 | 1.83E-08 | 0 | 0 | 1.00 |
| 11-mo. WT3 | 9.69E-28 | 1.57E-04 | 3.01E-16 | 0 | 0 | 1.00 |
| 11-mo. WT4 | 2.59E-18 | 2.02E-17 | 2.67E-06 | 0 | 0 | 1.00 |
| 11-mo. WT5 | 0 | 1.77E-06 | 2.28E-04 | 0 | 0 | 1.00 |
Notes: Mo = Month; Tg = Transgenic; WT = Wild-type; The highest probability value in the each row indicates that a sample belong to a particular class (boldface). The italized numbers indicate the correct classification with confidence level above 95%.
Table 2.
Probabilty of membership in the six age/genotype groups-blood
| Sample | 1-month Tg | 1-month WT | 5-month Tg | 5-month WT | 11-month Tg | 11-month WT |
|---|---|---|---|---|---|---|
| 1-mo. Tg1 | 0.97 | 0.03 | 2.42E-08 | 1.07E-03 | 4.09E-06 | 7.72E-04 |
| 1-mo. Tg2 | 0.99 | 3.17E-11 | 5.73E-11 | 7.24E-04 | 3.76E-03 | 9.06E-04 |
| 1-mo. Tg3 | 1.00 | 1.48E-05 | 2.85E-08 | 7.59E-04 | 1.40E-04 | 6.53E-04 |
| 1-mo. Tg4 | 0.99 | 3.50E-10 | 2.07E-10 | 9.22E-04 | 3.82E-03 | 1.35E-03 |
| 1-mo. Tg5 | 0.98 | 8.69E-12 | 9.84E-07 | 2.06E-03 | 9.24E-03 | 4.06E-03 |
| 1-mo. WT1 | 0 | 1.00 | 8.02E-05 | 2.68E-03 | 3.22E-04 | 4.34E-07 |
| 1-mo. WT2 | 0.05 | 0.94 | 8.78E-06 | 3.58E-03 | 1.18E-08 | 1.53E-03 |
| 1-mo. WT3 | 0.02 | 0.98 | 1.90E-04 | 3.65E-03 | 3.76E-08 | 1.85E-03 |
| 1-mo. WT4 | 0 | 0.94 | 0.06 | 1.49E-03 | 8.21E-06 | 2.00E-07 |
| 1-mo. WT5 | 0 | 0.99 | 9.52E-03 | 3.93E-04 | 8.49E-07 | 1.26E-10 |
| 5-mo. Tg1 | 1.46E-11 | 1.03E-28 | 0.23 | 0.09 | 0.32 | 0.35 |
| 5-mo. Tg2 | 0 | 0 | 1.00 | 2.14E-04 | 3.66E-04 | 5.43E-18 |
| 5-mo. Tg3 | 0 | 0 | 0.53 | 0.14 | 0 | 0.33 |
| 5-mo. Tg4 | 0 | 3.77E-25 | 0.24 | 2.24E-04 | 0.76 | 2.88E-15 |
| 5-mo. Tg5 | 0 | 0 | 0.98 | 0.02 | 0 | 3.12E-08 |
| 5-mo. WT1 | 2.10E-07 | 2.04E-15 | 0.22 | 0.14 | 0.32 | 0.32 |
| 5-mo. WT2 | 0 | 0 | 0.60 | 0.38 | 0 | 0.02 |
| 5-mo. WT3 | 0 | 0 | 1.41E-09 | 0.81 | 0 | 0.19 |
| 5-mo. WT4 | 0 | 0 | 0 | 0.98 | 0 | 0.02 |
| 5-mo. WT5 | 0 | 0 | 0 | 0.96 | 0 | 0.04 |
| 11-mo. Tg1 | 5.95E-08 | 1.48E-24 | 0.09 | 0.11 | 0.53 | 0.28 |
| 11-mo. Tg2 | 0 | 0 | 0 | 6.01E-12 | 1.00 | 0 |
| 11-mo. Tg3 | 0 | 3.94E-05 | 0.13 | 1.63E-03 | 0.87 | 3.54E-12 |
| 11-mo. Tg4 | 0 | 3.56E-15 | 0.24 | 6.28E-05 | 0.76 | 1.11E-16 |
| 11-mo. Tg5 | 0 | 3.87E-23 | 0.24 | 3.20E-03 | 0.76 | 6.12E-11 |
| 11-mo.WT1 | 1.19E-15 | 0 | 0.30 | 0.11 | 0.09 | 0.49 |
| 11-mo. WT2 | 0 | 0 | 0.03 | 0.11 | 3.20E-22 | 0.86 |
| 11-mo. WT3 | 0 | 0 | 0.01 | 0.31 | 1.12E-09 | 0.67 |
| 11-mo. WT4 | 0 | 0 | 0.41 | 0.10 | 0 | 0.49 |
| 11-mo. WT5 | 0 | 0 | 6.84E-20 | 0.38 | 5.56E-29 | 0.62 |
Notes: Mo = Month; Tg = Transgenic; WT = Wild-type; The highest probability value in the each row indicates that a sample belong to a particular class (boldface). The italic numbers indicate the correct classification with confidence level above 95%.
Finally, we performed a receiver operating characteristics analysis for both brain tissues and blood samples with only classifying AD and non-AD phenotypes, without taking disease progression staging into consideration. The 30 brain electropherograms (5 pairs of AD and WT at each of three age stages) that were used to differentiate AD and non-AD pheno-types reached 100% in both sensitivity and specificity (as shown in Fig. 6a). Also, Fig. 6b suggests that the validation cohort of the 30 blood electrophoretic profiles achieved high discrimination power, with both sensitivity and specificity of 93.3%. These preliminary results suggested that PCA is a powerful method for multivariate analysis of complex data, such as electro-pherograms describing S-glutathionyl profiles for the diagnosis of AD.
Fig. 6.

Results of the receiver operating characteristic analyses generated by the threshold percentage votes needed to classify a S-glutahionylation electropherogram as Alzheimer's disease. The area under the curve was calculated as 1 and 0.9867 for brain (a) and blood (b), respectively.
DISCUSSION
The issue for the early screening of individuals who will progress to AD is a very critical one. Although various imaging tools that facilitate the identification are present, using capillary electrophoresis combined with PCA analysis to characterize oxidized protein biomarkers would be of a powerful tool. In our approach, we used principal component scores as quantitative markers for each mouse S-glutathionylation electrophoretic profile. The spatially distributed six groups in the three dimensional PCA plots were observed. Additionally, we used a cross validation method to determine the use of principal component scores, and to predict the classification. This analysis provides a great estimate at the early stage of AD progression.
Can PCA analysis of blood and brain S-glutathionyls electrophoretic profiles predict AD?
S-glutathionyl levels in brain tissues and blood samples of AD-Tg/WT mice at different age stages were quantitatively determined using CGE-LIF. Overall, our study demonstrated that Pr-SSG in AD-Tg mouse brain significantly increased with aging except at 5-month-old. The difference of S-glutathionylation between AD and WT indicated that S-glutathionylation might be an early event prior to the AD progression. The principal component scores, served as quantitative markers, were able to discriminate AD from WT types, and even differentiate various AD staging groups.
We assessed the performance of the S-gluathionylation profiles in the classification of unknown samples. Specifically, we carried out a “leave-one-out” prediction for a “six-class” prediction for “Alzheimer's” or “control” phenotype at three disease progression. It was shown in Tables 1 and 2 that the sensitivity and accuracy of using blood S-glutathionylation profiles appears suboptimal compared with brain oxidative stress. Also, from PCA plot (Fig. 3B), it was observed that the difference in these six group classification was more pronounced in brain tissues than blood samples. This observation may suggest that peripheral blood-based markers reflect mechanism of central nervous system (CNS) in AD, to some extent, but not completely. Peripheral blood is a highly convenient source of biomarkers, which has been studied in research settings. However, it is unclear how and what proteins that originate as a result of brain pathology, would be transited from the brain to the blood since blood brain barrier may limit the potential diagnostic blood-based markers to small or lipophilic molecules, or ones with specific transporters [38].
However, it is notable that these observations of subpar prediction using blood S-gluathionylation profiles are only correct when including a consideration of AD progression stages. Not considering AD staging but only predicting AD and non-AD phenotypes, the most critical issue, the predicting specificity and sensitivity using blood S-glutathionyaltion profiles reached 93.3% and 90.0%, respectively. Other reports have also pointed to that the AβPP metabolism alteration and oxidative imbalance does not only exist in neuronal plaque, but also in peripheral blood [39]. Hence, the oxidative imbalance in blood of AD subjects could mirror the physiological events in CNS, to some extent [40]. In our case, the change of blood S-glutationylation profile is sufficient enough to be detected and used for prediction. Even though brain proteins that pass into blood stream become diluted into a complex medium, it displays that our CGELIF analytical method is sensitive enough to detect these low abundant oxidative stress related biomarkers. These S-glutathionylated proteins can provide insight into processes such as inflammation and oxidative damage. This study remains fully validated by future studies, such as determining key biomarkers to predict pathological diagnosis and further narrow treatment options. Despite the absence of precise knowledge about the identity of these biomarkers, we can still distinguish AD from non-AD, which is a very attractive feature of this method. Our results show clinical usefulness of a panel of unknown biomarkers associated with S-glutathionylation from the blood.
Do different stagings of AD have the same diagnostic use?
Surprisingly, the classification accuracy assessed for 5-month S-glutathionylation spectral PCA analysis has great variance, while 1-month and 11-month old mice have significantly higher classification accuracy than random chance. This interesting finding suggest that targeted oxidized protein long before and long after amyloid plaque deposition are indicative predictors of AD screening. However, immediately before amyloid plaque formation, the oxidative stress induced S-glutathionylation becomes ambiguous in terms of classification. This could be attributed by various factors, such as antioxidant capacity surge to overcome the protein modification at 5-month right before plaque deposition. What is more interesting, is that our previous study of characterizing S-glutathionylation redox status showed that brain GSSG and Pr-SSG levels in 5-month-old mice were lower than 1-month-olds, suggesting that the 5-month-old brain may be more resistant to oxidative stress [41]. Our electrophoretic spectra of targeted S-glutathionylation at 5-month-old seems to be agreeable to the previous observation on the “dip-down” for Pr-SSG levels at 5 months, which suggests an abrupt change in the redox status from its normal trend of increasing oxidative stress with aging. Thus, it appears that the transgenes initially induce a stress response to compensate for its expression and this leads to the early increase in S-glutathionylation, but the oxidative stress balance reaches equilibrium, probably due to the large excess of antioxidant capacity at the middle age. Then the response repeats during plaque deposition at the later stage. At this end, our data suggests that 5-month (right before plaque manifestation) brain and blood oxidative stress profile seems not completely reliable for AD and non-AD phenotype classification. Currently, it is unknown what precise mechanisms are involved in oxidative stress at this stage.
On the other hand, we demonstrated the high accuracy of genotyping classification at 1- and 11-month old mice, based on PCA analysis of S-glutathionylated proteins electrophoretic profiles. Our finding indicates that the measurement of Mw based electrophoretic profiling of blood and brain S-glutathionylated proteins are sensitive to change, even at the early stage of the disease long before the plaque deposition. Also, our results highlight a unique method to use chromatographic technique for separation of oxidized protein biomarkers and further analyze them with PCA for monitoring the AD progression. We found out that the electrophoretic characteristics of oxidized proteins can serve as a predictor of AD progression and the early stage screening.
Which Mw range of protein biomarkers are most associated with AD pathogenesis?
To predict what Mw range indicates the most S-glutathionylated proteins associated with aging and genotyping effects, the electropherograms were analyzed by combining the loading vector of the first PC. The useful range extends up to 875 s that corresponds to 277.9 kDa. The migration time of Pr-SSG in the brain and blood is between 350 and 470 s which correspond to the Mw region at 8.4~20.3 kDa and 13.2 ~ 37.2 kDa, respectively. A previous proteome-based study showed that several key proteins within these Mw ranges: Deoxyhemoglobin (15.8 kDa), α-crystalline B (20.1 kDa), and GAPDH (36.1 kDa) were identified as S-glutathionylated proteins with the loss of functions [42]. S-glutathionylation proteomics study in AD brain shows the number of oxidized proteins increased and these identified proteins are involved in various cellular processes such as glucose or energy metabolism, synaptic plasticity with loss of their functions [42]. These results indicate the S-glutathionylation involvement in AD brain and that it plays a key role in AD pathogenesis.
Therefore, the particular Mw ranges of S-glutathionylated proteins predicted by fast profiling by CGE-LIF followed by PCA could serve as a powerful tool to locate the specific and precise Mw regions of interest. This prescreening would be instrumental for complex global proteomic study because it helps tease out the most crucial biomarkers within specific Mw range.
Could spectral separation of oxidative biomarkers be a different AD diagnostic approach?
By focusing on proteins that are susceptible to oxidative stress, we were able to identify AD phenotype. The simplicity and novelty of the method is that it allows the simultaneous monitoring of all proteins with various expression levels of oxidative damage, instead of investigating the abundance of each protein biomarker using various biochemical assays such as ELISA, western blot, or microarray. These biomarkers, although unknown, are preferentially prone to S-glutathionylation in brain tissues and blood samples. Our method naturally investigates a panel of protein biomarkers that are susceptible to S-glutathionylation. Our omnibus measures of S-glutathionylated proteome profiles with known abundance distribution as a function of Mw are promising approaches for the development of blood-based diagnostic tests for AD. These proteins are expected to have various functions such as amyloid-β generation, the inflammatory response, and proteolytic inhabitation. Compared with function imaging based AD diagnosis, our method is less costly, so it is a great alternative addition to the AD diagnosis.
Given the complexity implicated in AD pathogenesis, including amyloid plaque formation, inflammation, oxidative stress disturbance [43, 44], and lipid metabolism [45]; the diagnostic accuracy of biomarkers may be improved by combining several blood-based biomarkers related to different mechanisms [46]. Ray and colleagues found that a panel of 18 signaling proteins in blood plasma together may indicate the early molecular change in AD progression and are further used to identify MCI patients who progressed to AD years later [47]. Hence, a confirmation in larger populations and an incorporation of additional oxidative stress mechanisms such as carbonylation, nitrosylation, and nitration profiles may further improve the sensitivity and specificity of this approach.
Can we simply relate the pathology of this transgenic mouse model to an aged human brain?
Our chosen transgenic mouse model mostly mimics the early-onset familial AD (FAD) rather than the late-onset FAD because of AβPP and presenilin-1 (PS-1) genes mutations [48] and the lack of APOE4 gene inheritance.
Since AD is a very complicated disease, it is a major obstacle to find an ideal animal model that recapitulates the full spectrum of AD neuropathology, such as amyloid plaques, tangles, cell dysfunction/loss, and aging. Some aged primates and dogs exhibit AD-like neuropathology; however, it is not practical to use them as models due to the high cost and extensive time involved. Rodents, along with several other animal species such as guinea pigs, Drosophila, Caenorhabditis elegans, and yeast have been considered for AD research because they are relatively cheap to maintain and can be genetically engineered. But none of these species develop AD pathology on aging [49]. Among them, transgenic mice models are considered preferable because they have similar CNS and general neurobiology to humans. The disadvantage of a mouse model is that the short life span of mice makes it diffi-cult to study the effect of aging. In addition, humans are less resistant to neurotoxins and more easily develop AD with mutant AβPP compared to rodent models. We know that the rodent models have not been able to effectively demonstrate all AD aspects in a single animal [50].
In the end, it has been a significant limitation for the entire AD research field to create an animal model that replicates the multiple AD characteristics [51]. Because of this, currently we cannot simply relate the pathology resulting from the double mutation expression in this artificial mouse model to an aged human brain.
Even though transgenic mice cannot represent all aspects of AD, our current model helped us developed an invaluable tool for characterizing and detecting the molecular changes in the reactive oxygen species-induced oxidative stress damage, particularly, S-glutathionylation in the early-onset FAD. This PCA analysis of S-glutathionylation spectral profiles can be readily extrapolated to study the age effect on AD development using a different animal model such as ApoE4 mice crossed with PD-AβPP mice [52, 53]. Most importantly, our method has great potential to analyze S-glutathionylation profiles of human blood samples.
CONCLUSIONS
We developed a method by combining CGELIF electrophoretic profiling with PCA analysis to successfully classify the age and genotype defined six sub-groups, with achieved overall accuracies of 70.02% and 60.00% in mice brain tissues and blood samples, respectively. Moreover, mice brains and blood samples with protein masses at 8.4 ~ 20.3 kDa and 13.2 ~ 37.2 kDa were estimated to be most susceptible to S-glutathionylation. This method inherently investigates a panel of protein biomarkers that are affected by S-glutathionylation. Our findings demonstrate that (1) PCA analysis of S-glutathionylation electrophoretic profiling distinguishes AD pathology and non-AD features; and (2) the molecular weight based S-glutathionylation profiles in mice brains and blood samples are sensitive to change with disease progression.
Supplementary Material
ACKNOWLEDGMENTS
We thank Dr. Spaulding for his great assistance on animals care. Special thanks to Dr. Edgar Arriaga's group for providing their in-house written Wide Peak analysis software. This study was supported by the National Institutes of Health and the National Center for Research Resources Grant P20RR016456.
Footnotes
Supplementary data available online: http://www.j-alz.com/issues/30/vol30-4.html#supplementarydata06
Authors’ disclosures available onine (http://www.jalz.com/disclosures/view.php?id=1225).
REFERENCES
- 1.de Leon MJ, DeSanti S, Zinkowski R, Mehta PD, Pratico D, Segal S, Clark C, Kerkman D, DeBernardis J, Li J, Lair L, Reisberg B, Tsui W, Rusinek H. MRI and CSF studies in the early diagnosis of Alzheimer's disease. J Intern Med. 2004;256:205–223. doi: 10.1111/j.1365-2796.2004.01381.x. [DOI] [PubMed] [Google Scholar]
- 2.Klatt P, Lamas S. Regulation of protein function by S-glutathiolation in response to oxidative and nitrosative stress. Eur J Biochem. 2000;267:4928–4944. doi: 10.1046/j.1432-1327.2000.01601.x. [DOI] [PubMed] [Google Scholar]
- 3.Di Domenico F, Cenini G, Sultana R, Perluigi M, Uberti D, Memo M, Butterfield DA. Glutathionylation of the pro-apoptotic protein p53 in Alzheimer's disease brain: Implications for AD pathogenesis. Neurochem Res. 2009;34:727–733. doi: 10.1007/s11064-009-9924-9. [DOI] [PMC free article] [PubMed] [Google Scholar]
- 4.Zhang C, Rodriguez C, Circu ML, Aw TY, Feng J. S-Glutathionyl quantification in the attomole range using glutaredoxin-3-catalyzed cysteine derivatization and capillary gel electrophoresis with laser-induced fluorescence detection. Anal Bioanal Chem. 2011;401:2165–2175. doi: 10.1007/s00216-011-5311-x. [DOI] [PMC free article] [PubMed] [Google Scholar]
- 5.Teipel SJ, Born C, Ewers M, Bokde AL, Reiser MF, Moller HJ, Hampel H. Multivariate deformation-based analysis of brain atrophy to predict Alzheimer's disease in mild cognitive impairment. Neuroimage. 2007;38:13–24. doi: 10.1016/j.neuroimage.2007.07.008. [DOI] [PubMed] [Google Scholar]
- 6.Desikan RS, Cabral HJ, Hess CP, Dillon WP, Glastonbury CM, Weiner MW, Schmansky NJ, Greve DN, Salat DH, Buckner RL, Fischl B. Automated MRI measures identify individuals with mild cognitive impairment and Alzheimer's disease. Brain. 2009;132:2048–2057. doi: 10.1093/brain/awp123. [DOI] [PMC free article] [PubMed] [Google Scholar]
- 7.Querbes O, Aubry F, Pariente J, Lotterie JA, Demonet JF, Duret V, Puel M, Berry I, Fort JC, Celsis P. Early diagnosis of Alzheimer's disease using cortical thickness: Impact of cognitive reserve. Brain. 2009;132:2036–2047. doi: 10.1093/brain/awp105. [DOI] [PMC free article] [PubMed] [Google Scholar]
- 8.Andreasen N, Minthon L, Davidsson P, Vanmechelen E, Vanderstichele H, Winblad B, Blennow K. Evaluation of CSF-tau and CSF-Abeta42 as diagnostic markers for Alzheimer disease in clinical practice. Arch Neurol. 2001;58:373–379. doi: 10.1001/archneur.58.3.373. [DOI] [PubMed] [Google Scholar]
- 9.Kaplin A, Carroll KA, Cheng J, Allie R, Lyketsos CG, Calabresi P, Rosenberg PB. IL-6 release by LPS-stimulated peripheral blood mononuclear cells as a potential biomarker in Alzheimer's disease. Int Psychogeriatr. 2009;21:413–414. doi: 10.1017/S1041610208008107. [DOI] [PMC free article] [PubMed] [Google Scholar]
- 10.Mayeux R. Biomarkers: Potential uses and limitations. NeuroRx. 2004;1:182–188. doi: 10.1602/neurorx.1.2.182. [DOI] [PMC free article] [PubMed] [Google Scholar]
- 11.Jolliffe IT. Principal Component Analysis. Springer-Verlag; New York Inc.; New York: 2002. [Google Scholar]
- 12.Marsland S. Machine Learning: An Algorithmic Perspective. Chapman and Hall/CRC; Boca Raton, Florida: 2009. [Google Scholar]
- 13.Johannesson N, Olsson L, Backstrom D, Wetterhall M, Danielsson R, Bergquist J. Screening for biomarkers in plasma from patients with gangrenous and phlegmonous appendicitis using CE and CEC in combination with MS. Electrophoresis. 2007;28:1435–1443. doi: 10.1002/elps.200600606. [DOI] [PubMed] [Google Scholar]
- 14.Szymanska E, Markuszewski MJ, Capron X, van Nederkassel AM, Heyden YV, Markuszewski M, Krajka K, Kaliszan R. Increasing conclusiveness of metabonomic studies by chem-informatic preprocessing of capillary electrophoretic data on urinary nucleoside profiles. J Pharm Biomed Anal. 2007;43:413–420. doi: 10.1016/j.jpba.2006.08.015. [DOI] [PubMed] [Google Scholar]
- 15.Feng J, Navratil M, Thompson LV, Arriaga EA. Principal component analysis reveals age-related and muscle-type-related differences in protein carbonyl profiles of muscle mitochondria. J Gerontol A Biol Sci Med Sci. 2008;63:1277–1288. doi: 10.1093/gerona/63.12.1277. [DOI] [PMC free article] [PubMed] [Google Scholar]
- 16.Goto Y, Niidome T, Hongo H, Akaike A, Kihara T, Sugimoto H. Impaired muscarinic regulation of excitatory synaptic transmission in the APPswe/PS1dE9 mouse model of Alzheimer's disease. Eur J Pharmacol. 2008;583:84–91. doi: 10.1016/j.ejphar.2008.01.030. [DOI] [PubMed] [Google Scholar]
- 17.Choi SH, Leight SN, Lee VM, Li T, Wong PC, Johnson JA, Saraiva MJ, Sisodia SS. Accelerated Abeta deposition in APPswe/PS1deltaE9 mice with hemizygous deletions of TTR (transthyretin). J Neurosci. 2007;27:7006–7010. doi: 10.1523/JNEUROSCI.1919-07.2007. [DOI] [PMC free article] [PubMed] [Google Scholar]
- 18.Borchelt DR, Davis J, Fischer M, Lee MK, Slunt HH, Ratovitsky T, Regard J, Copeland NG, Jenkins NA, Sisodia SS, Price DL. A vector for expressing foreign genes in the brains and hearts of transgenic mice. Genet Anal. 1996;13:159–163. doi: 10.1016/s1050-3862(96)00167-2. [DOI] [PubMed] [Google Scholar]
- 19.Borchelt DR, Ratovitski T, van Lare J, Lee MK, Gonzales V, Jenkins NA, Copeland NG, Price DL, Sisodia SS. Accelerated amyloid deposition in the brains of transgenic mice coexpressing mutant presenilin 1 and amyloid precursor proteins. Neuron. 1997;19:939–945. doi: 10.1016/s0896-6273(00)80974-5. [DOI] [PubMed] [Google Scholar]
- 20.Liskowsky W, Schliebs R. Muscarinic acetylcholine receptor inhibition in transgenic Alzheimer-like Tg2576 mice by scopolamine favours the amyloidogenic route of processing of amyloid precursor protein. Int J Dev Neurosci. 2006;24:149–156. doi: 10.1016/j.ijdevneu.2005.11.010. [DOI] [PubMed] [Google Scholar]
- 21.Mehlhorn G, Hollborn M, Schliebs R. Induction of cytokines in glial cells surrounding cortical beta-amyloid plaques in transgenic Tg2576 mice with Alzheimer pathology. Int J Dev Neurosci. 2000;18:423–431. doi: 10.1016/s0736-5748(00)00012-5. [DOI] [PubMed] [Google Scholar]
- 22.Musaro A, Rosenthal N. Transgenic mouse models of muscle aging. Exp Gerontol. 1999;34:147–156. doi: 10.1016/s0531-5565(98)00079-5. [DOI] [PubMed] [Google Scholar]
- 23.Parachikova A, Nichol KE, Cotman CW. Short-term exercise in aged Tg2576 mice alters neuroinflammation and improves cognition. Neurobiol Dis. 2008;30:121–129. doi: 10.1016/j.nbd.2007.12.008. [DOI] [PMC free article] [PubMed] [Google Scholar]
- 24.Wirths O, Weis J, Kayed R, Saido TC, Bayer TA. Age-dependent axonal degeneration in an Alzheimer mouse model. Neurobiol Aging. 2007;28:1689–1699. doi: 10.1016/j.neurobiolaging.2006.07.021. [DOI] [PubMed] [Google Scholar]
- 25.Jankowsky JL, Fadale DJ, Anderson J, Xu GM, Gonzales V, Jenkins NA, Copeland NG, Lee MK, Borchelt DR. Mutant presenilins specifically elevate the levels of the 42 residue β-amyloid peptide in vivo: Evidence for augmentation of a 42-specific c secretase. Hum Mol Genet. 2004;13:159–170. doi: 10.1093/hmg/ddh019. [DOI] [PubMed] [Google Scholar]
- 26.Zhang Q, Zhang X, Chen J, Miao Y, Sun A. Role of caspase-3 in tau truncation at D421 is restricted in transgenic mouse models for tauopathies. J Neurochem. 2009;109:476–484. doi: 10.1111/j.1471-4159.2009.05959.x. [DOI] [PubMed] [Google Scholar]
- 27.Monostori P, Wittmann G, Karg E, Turi S. Determination of glutathione and glutathione disulfide in biological samples: An in-depth review. J Chromatogr B Analyt Technol Biomed Life Sci. 2009;877:3331–3346. doi: 10.1016/j.jchromb.2009.06.016. [DOI] [PubMed] [Google Scholar]
- 28.Reynaert NL, Ckless K, Guala AS, Wouters EF, van der Vliet A, Janssen-Heininger YM. In situ detection of S-glutathionylated proteins following glutaredoxin-1 catalyzed cysteine derivatization. Biochim Biophys Acta. 2006;1760:380–387. doi: 10.1016/j.bbagen.2006.01.006. [DOI] [PubMed] [Google Scholar]
- 29.Hamnell-Pamment Y, Lind C, Palmberg C, Bergman T, Cotgreave IA. Determination of site-specificity of S-glutathionylated cellular proteins. Biochem Biophys Res Commun. 2005;332:362–369. doi: 10.1016/j.bbrc.2005.04.130. [DOI] [PubMed] [Google Scholar]
- 30.Cheng G, Ikeda Y, Iuchi Y, Fujii J. Detection of S-glutathionylated proteins by glutathione S-transferase overlay. Arch Biochem Biophys. 2005;435:42–49. doi: 10.1016/j.abb.2004.12.016. [DOI] [PubMed] [Google Scholar]
- 31.Ellman GL. Tissue sulfhydryl groups. Arch Biochem Biophys. 1959;82:70–77. doi: 10.1016/0003-9861(59)90090-6. [DOI] [PubMed] [Google Scholar]
- 32.Circu ML, Moyer MP, Harrison L, Aw TY. Contribution of glutathione status to oxidant-induced mitochondrial DNA damage in colonic epithelial cells. Free Radic Biol Med. 2009;47:1190–1198. doi: 10.1016/j.freeradbiomed.2009.07.032. [DOI] [PMC free article] [PubMed] [Google Scholar]
- 33.MacQueen J. Proceedings of the Fifth Berkeley Symposium on Mathematical Statistics and Probability. Vol. 1. University of California Press; 1967. pp. 281–297. [Google Scholar]
- 34.Franc V, Hlavac V. Statistical Pattern Recognition Toolbox for Matlab. Czech Technical University; Prague: 2004. [Google Scholar]
- 35.Everitt BS. The Cambridge Dictionary of Statistics. Cambridge University Press; Cambridge: 2006. [Google Scholar]
- 36.Kohavi R. A study of cross-validation and bootstrap for accuracy estimation and model selection. Proceedings of the Fourteenth International Joint Conference on Artificial Intelligence. 1995;2:1137–1143. [Google Scholar]
- 37.Shao J. Linear model selection by cross-validation. J Am Stat Assoc. 1993;88:486–495. [Google Scholar]
- 38.Irizarry MC. Biomarkers of Alzheimer disease in plasma. NeuroRx. 2004;1:226–234. doi: 10.1602/neurorx.1.2.226. [DOI] [PMC free article] [PubMed] [Google Scholar]
- 39.Choi J, Malakowsky CA, Talent JM, Conrad CC, Gracy RW. Identification of oxidized plasma proteins in Alzheimer's disease. Biochem Biophys Res Commun. 2002;293:1566–1570. doi: 10.1016/S0006-291X(02)00420-5. [DOI] [PubMed] [Google Scholar]
- 40.Straface E, Matarrese P, Gambardella L, Vona R, Sgadari A, Silveri MC, Malorni W. Oxidative imbalance and cathepsin D changes as peripheral blood biomarkers of Alzheimer disease: A pilot study. FEBS Lett. 2005;579:2759–2766. doi: 10.1016/j.febslet.2005.03.094. [DOI] [PubMed] [Google Scholar]
- 41.Zhang C, Rodriguez C, Spaulding J, Aw TY, Feng J. Age-dependent and tissue-related glutathione redox status in a mouse model of Alzheimer's disease. J Alzheimers Dis. 2012;28:655–666. doi: 10.3233/JAD-2011-111244. [DOI] [PMC free article] [PubMed] [Google Scholar]
- 42.Newman SF, Sultana R, Perluigi M, Coccia R, Cai J, Pierce WM, Klein JB, Turner DM, Butterfield DA. An increase in S-glutathionylated proteins in the Alzheimer's disease inferior parietal lobule, a proteomics approach. J Neurosci Res. 2007;85:1506–1514. doi: 10.1002/jnr.21275. [DOI] [PubMed] [Google Scholar]
- 43.Castegna A, Aksenov M, Thongboonkerd V, Klein JB, Pierce WM, Booze R, Markesbery WR, Butterfield DA. Proteomic identification of oxidatively modified proteins in Alzheimer's disease brain. Part II: Dihydropyrimidinase-related protein 2, alpha-enolase and heat shock cognate 71. J Neurochem. 2002;82:1524–1532. doi: 10.1046/j.1471-4159.2002.01103.x. [DOI] [PubMed] [Google Scholar]
- 44.Castegna A, Aksenov M, Aksenova M, Thongboonkerd V, Klein JB, Pierce WM, Booze R, Markesbery WR, Butterfield DA. Proteomic identification of oxidatively modified proteins in Alzheimer's disease brain. Part I: Creatine kinase BB, glutamine synthase, and ubiquitin carboxy-terminal hydrolase L-1. Free Radic Biol Med. 2002;33:562–571. doi: 10.1016/s0891-5849(02)00914-0. [DOI] [PubMed] [Google Scholar]
- 45.Butterfield DA, Castegna A, Lauderback CM, Drake J. Evidence that amyloid beta-peptide-induced lipid peroxidation and its sequelae in Alzheimer's disease brain contribute to neuronal death. Neurobiol Aging. 2002;23:655–664. doi: 10.1016/s0197-4580(01)00340-2. [DOI] [PubMed] [Google Scholar]
- 46.Teunissen CE, Lutjohann D, von Bergmann K, Verhey F, Vreeling F, Wauters A, Bosmans E, Bosma H, van Boxtel MP, Maes M, Delanghe J, Blom HJ, Verbeek MM, Rieckmann P, De Bruijn C, Steinbusch HW, de Vente J. Combination of serum markers related to several mechanisms in Alzheimer's disease. Neurobiol Aging. 2003;24:893–902. doi: 10.1016/s0197-4580(03)00005-8. [DOI] [PubMed] [Google Scholar]
- 47.Ray S, Britschgi M, Herbert C, Takeda-Uchimura Y, Boxer A, Blennow K, Friedman LF, Galasko DR, Jutel M, Karydas A, Kaye JA, Leszek J, Miller BL, Minthon L, Quinn JF, Rabinovici GD, Robinson WH, Sabbagh MN, So YT, Sparks DL, Tabaton M, Tinklenberg J, Yesavage JA, Tibshirani R, Wyss-Coray T. Classification and prediction of clinical Alzheimer's diagnosis based on plasma signaling proteins. Nat Med. 2007;13:1359–1362. doi: 10.1038/nm1653. [DOI] [PubMed] [Google Scholar]
- 48.Selkoe DJ. The genetics and molecular pathology of Alzheimer's disease: Roles of amyloid and the presenilins. Neurol Clin. 2000;18:903–922. doi: 10.1016/s0733-8619(05)70232-2. [DOI] [PubMed] [Google Scholar]
- 49.Link CD. Transgenic invertebrate models of age-associated neurodegenerative diseases. Mech Ageing Dev. 2001;122:1639–1649. doi: 10.1016/s0047-6374(01)00291-3. [DOI] [PubMed] [Google Scholar]
- 50.Duff K, Suleman F. Transgenic mouse models of Alzheimer's disease: How useful have they been for therapeutic development? Brief Funct Genomic Proteomic. 2004;3:47–59. doi: 10.1093/bfgp/3.1.47. [DOI] [PubMed] [Google Scholar]
- 51.Li L, Cheung T, Chen J, Herrup K. A comparative study of five mouse models of Alzheimer's disease: Cell cycle events reveal new insights into neurons at risk for death. Int J Alzheimers Dis. 2011;2011:171464. doi: 10.4061/2011/171464. [DOI] [PMC free article] [PubMed] [Google Scholar]
- 52.Holtzman DM, Bales KR, Tenkova T, Fagan AM, Parsadanian M, Sartorius LJ, Mackey B, Olney J, McKeel D, Wozniak D, Paul SM. Apolipoprotein E isoform-dependent amyloid deposition and neuritic degeneration in a mouse model of Alzheimer's disease. Proc Natl Acad Sci U S A. 2000;97:2892–2897. doi: 10.1073/pnas.050004797. [DOI] [PMC free article] [PubMed] [Google Scholar]
- 53.Holtzman DM, Fagan AM, Mackey B, Tenkova T, Sartorius L, Paul SM, Bales K, Ashe KH, Irizarry MC, Hyman BT. Apolipoprotein E facilitates neuritic and cerebrovascular plaque formation in an Alzheimer's disease model. Ann Neurol. 2000;47:739–747. [PubMed] [Google Scholar]
Associated Data
This section collects any data citations, data availability statements, or supplementary materials included in this article.